What is the relationship between parental income and educational attainment or hours spent on social media and anxiety levels? Regression is a versatile statistical tool that can help you answer these types of questions. It’s a tool that lets you model the relationship between two or more variables.
The applications of regression are endless. You can use it as a machine learning algorithm to make predictions. You can use it to establish correlations, and in some cases, you can use it to uncover causal links in your data.
In this article, we’ll tell you everything you need to know about the most basic form of regression analysis: the simple linear regression model.
What Is Simple Linear Regression Analysis?
Simple linear regression is a statistical tool you can use to evaluate correlations between a single independent variable (X) and a single dependent variable (Y). The model fits a straight line to data collected for each variable, and using this line, you can estimate the correlation between X and Y and predict values of Y using values of X.
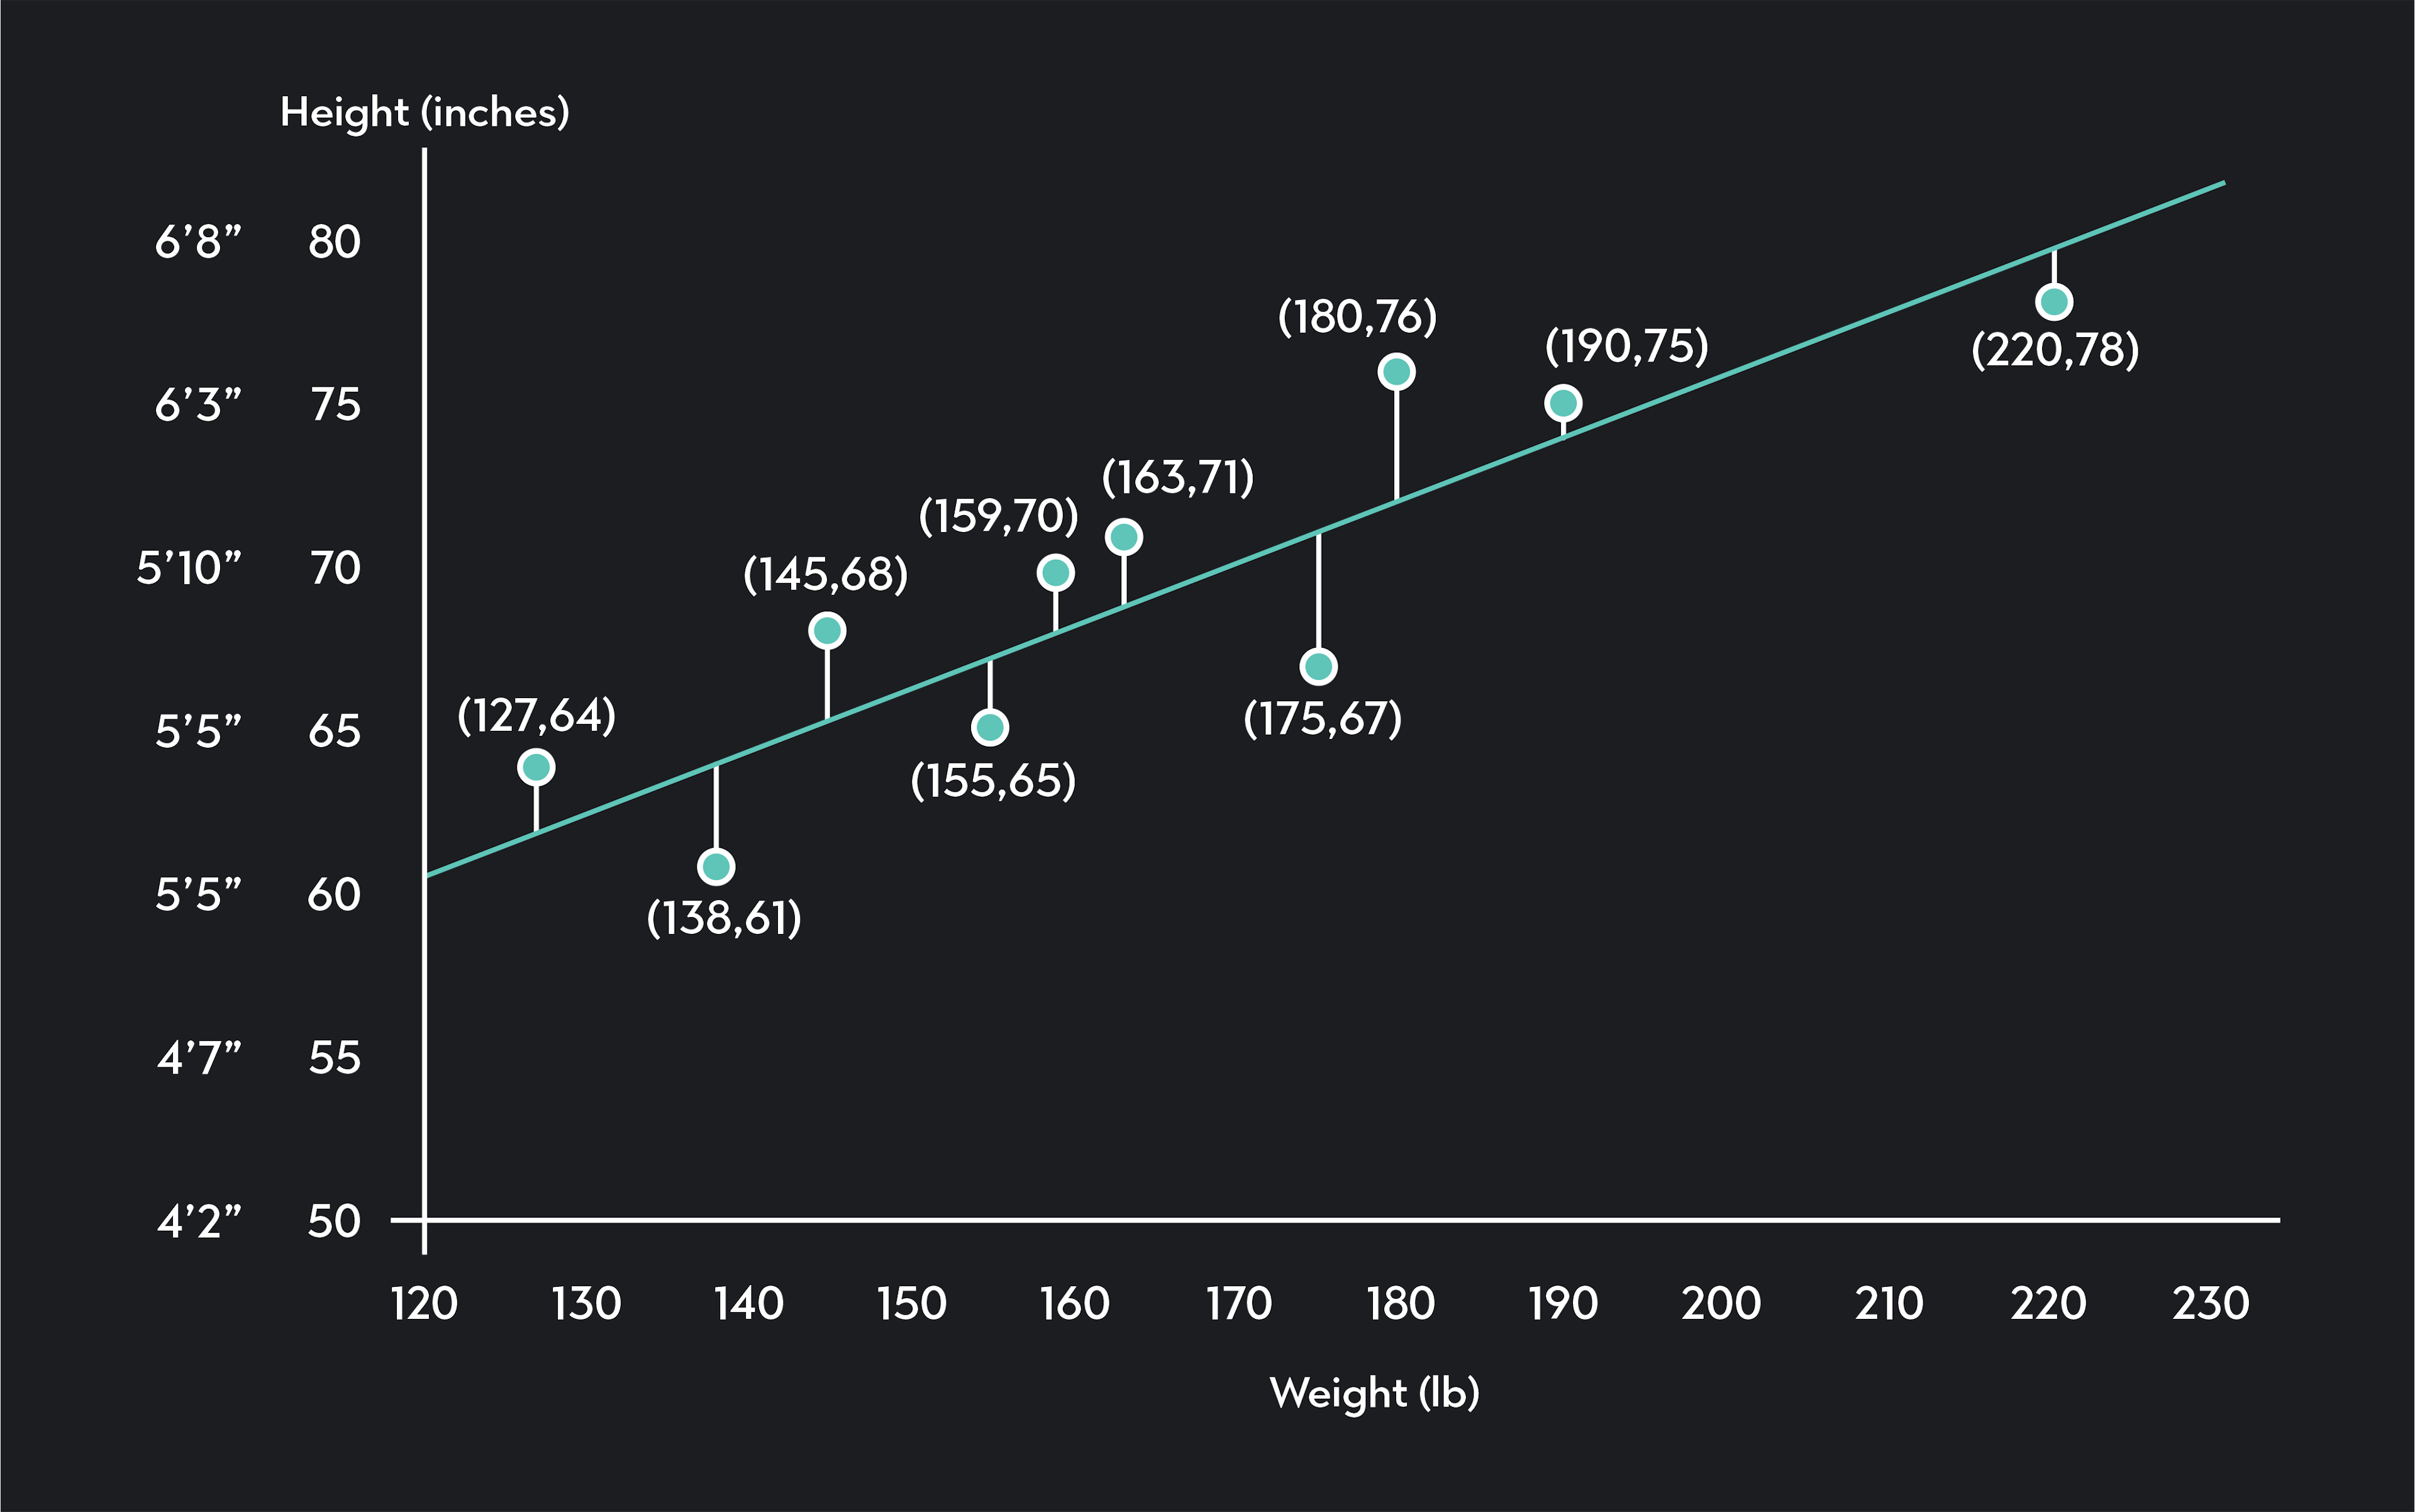
As a quick example, imagine you want to explore the relationship between weight (X) and height (Y). You collect data from ten randomly selected individuals, and you plot your data on a scatterplot like the one below.
In the scatterplot, each point represents data collected for one of the individuals in your sample. The blue line is your regression line. It models the relationship between weight and height using observed data. Not surprisingly, we see the regression line is upward-sloping, indicating a positive correlation between weight and height. Taller people tend to be heavier than shorter people.
Once you have this line, you can measure how strong the correlation is between height and weight. You can estimate the height of somebody not in your sample by plugging their weight into the regression equation.
Linear Regression Equation
The equation for a simple linear regression is:
Y=β0+β1X+ε
Where:
X is your independent variable
Y is an estimate of your dependent variable
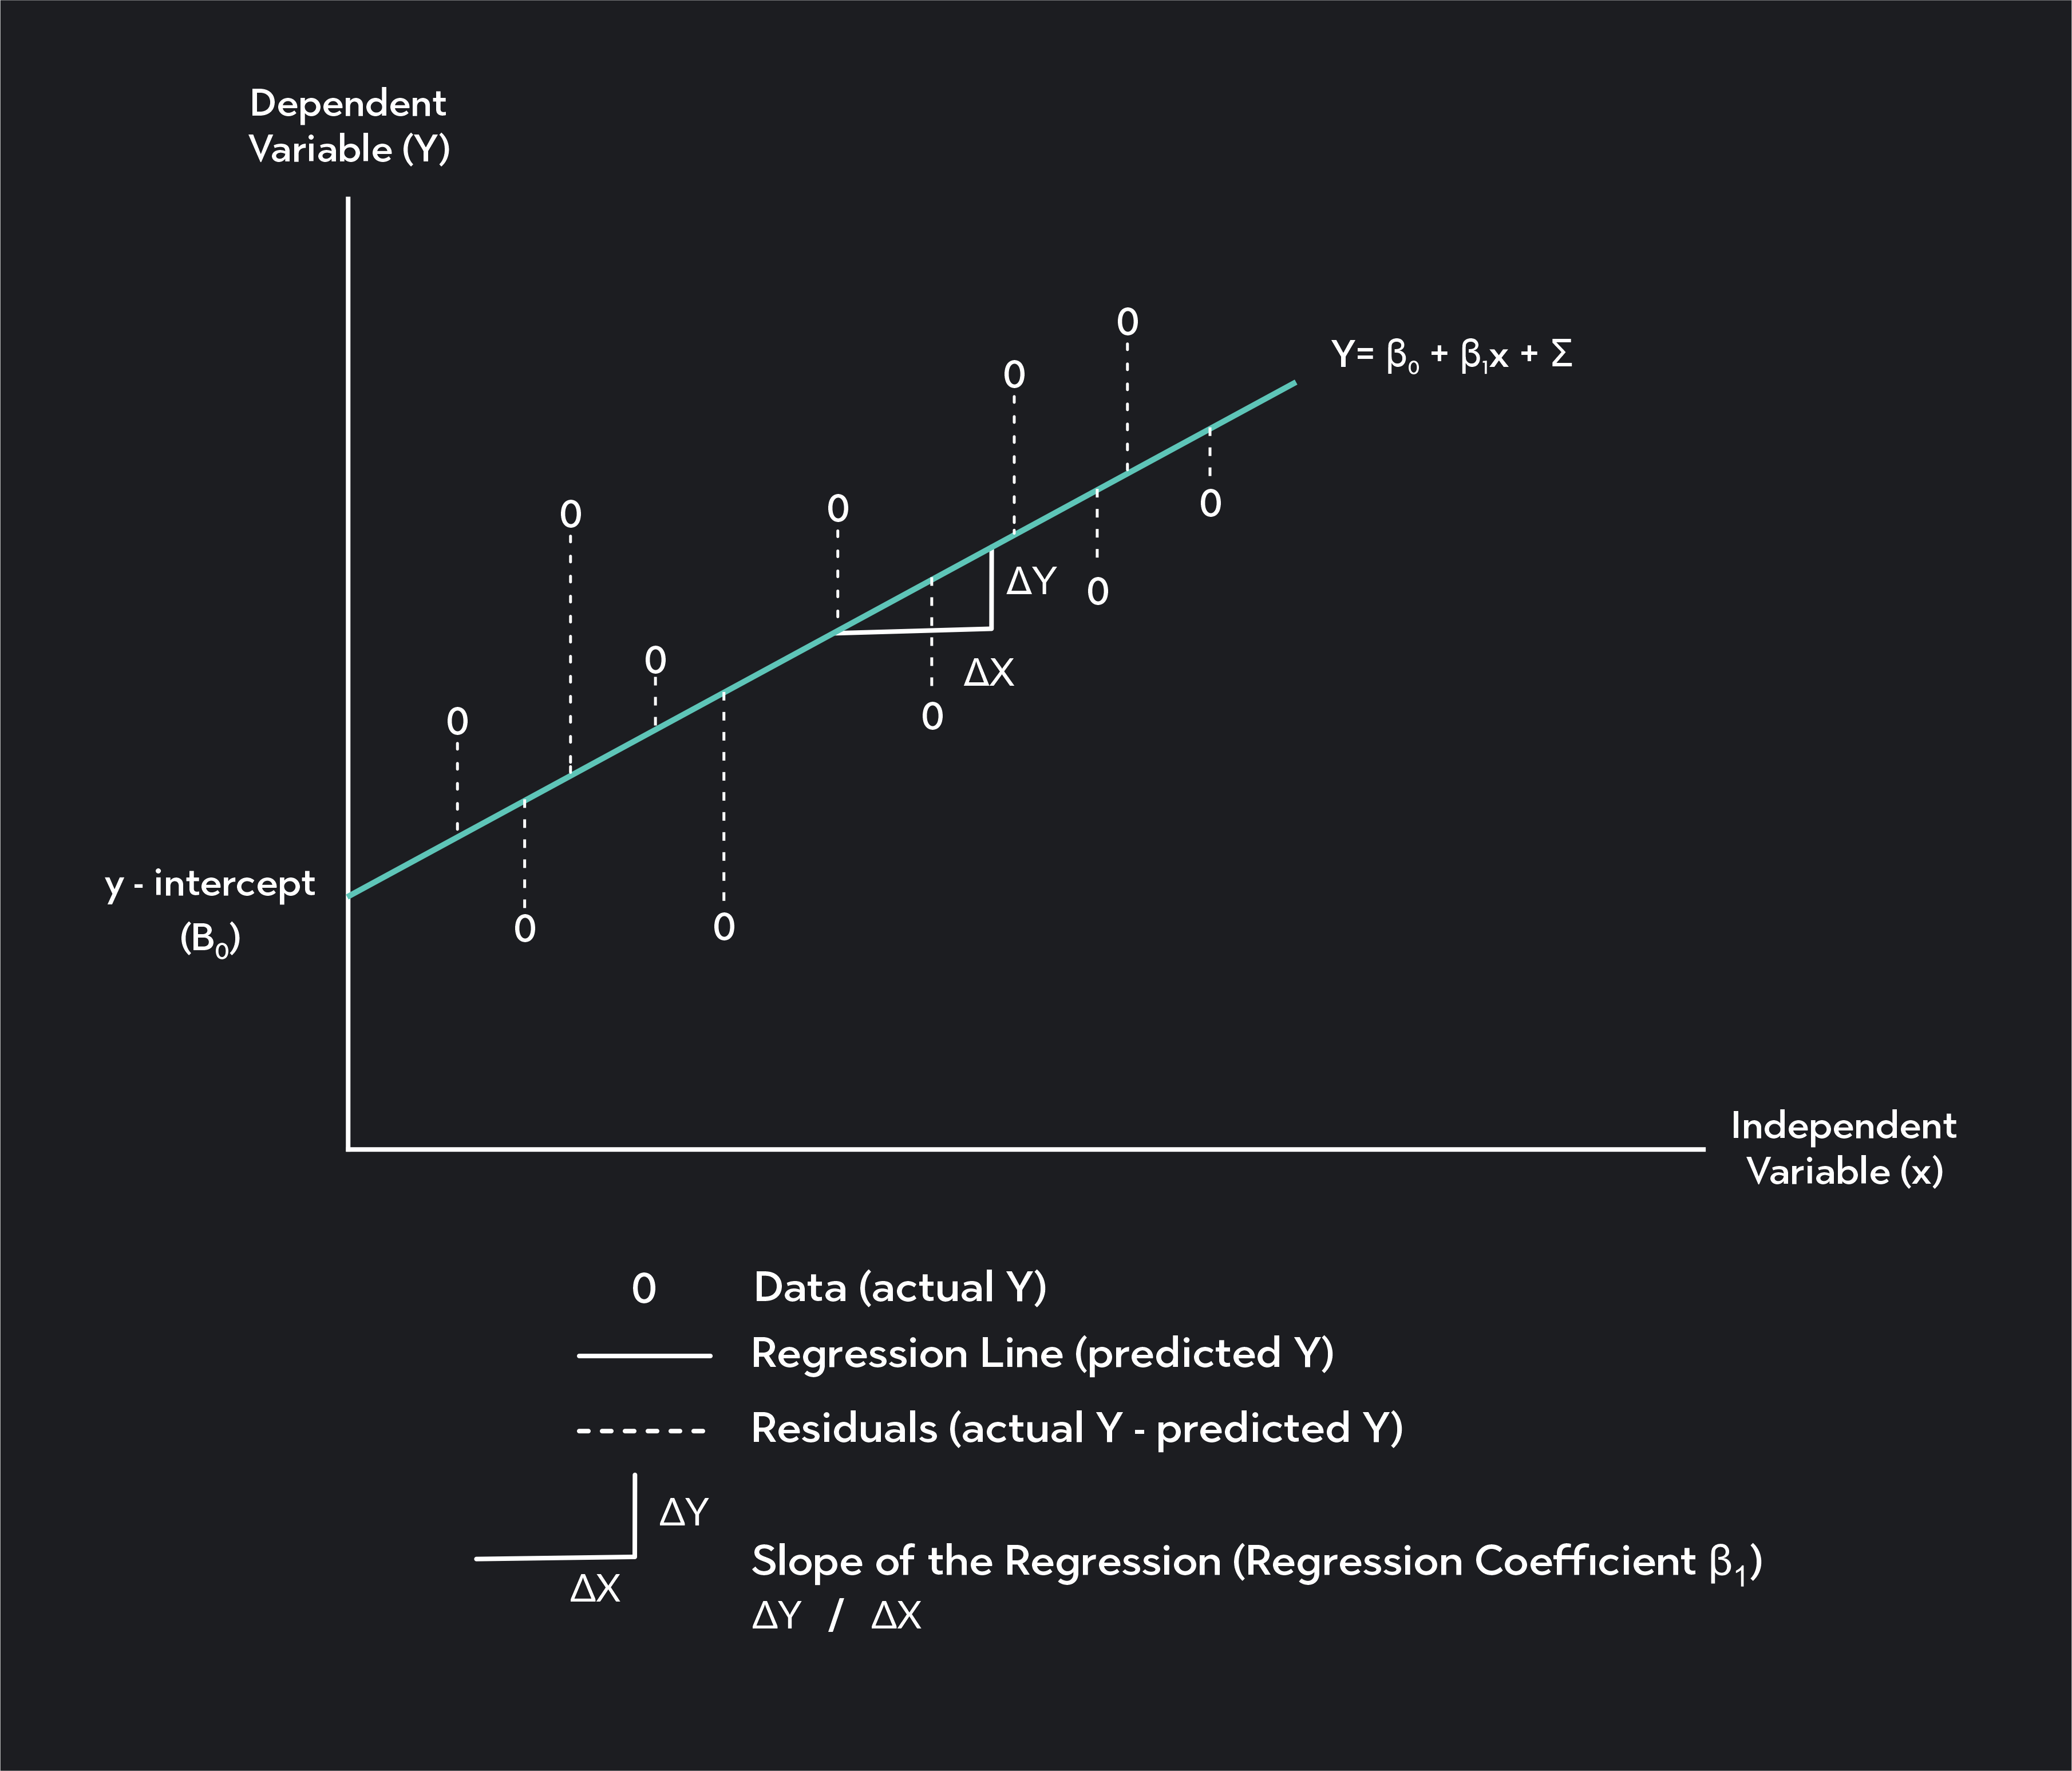
β0 is the constant or intercept of the regression line, which is the value of Y when X is equal to zero
β1 is the regression coefficient, which is the slope of the regression line and your estimate for the change in Y given a 1-unit change in X
ε is the error term of the regression
You may notice the formula for a regression looks very similar to the equation of a line (y=mX+b). That’s because linear regression is a line! It’s a line fitted to data that you can use to estimate the values of one variable using the value of a correlated variable.
How To Perform Linear Regression
You can build a simple linear regression model in 5 steps.
1. Collect data
Collect data for two variables (X and Y). Y is your dependent variable, which is the variable you want to estimate using the regression. X is your independent variable—the variable you use as an input in your regression.
2. Plot the data on a scatter plot
Plot the values of X and Y on a scatter plot with values of X plotted along the horizontal x-axis and values of Y plotted on the vertical y-axis.
3. Calculate a correlation coefficient
Calculate a correlation coefficient to determine the strength of the linear relationship between your two variables.
4. Fit a regression to the data
Find the regression line using the ordinary least-squares method. (You can do this by hand; but it’s much easier to use statistical software like Desmos, Excel, R, or Stata.)
5. Assess the regression line
Once you have the regression line, assess how well your model performs by checking to see how well the model predicts values of Y.
Linear Regression Assumptions
The key assumptions we make when using a simple linear regression model are:
Linearity
The relationship between X and Y (if it exists) is linear.
Independence
The residuals of your model are independent.
Homoscedasticity
The variance of the residual is constant across values of the independent variable.
You should not use a simple linear regression unless it’s reasonable to make these assumptions.
How Do You Find the Regression Line?
Simple linear regression involves fitting a straight line to your dataset. We call this line the line of best fit or the regression line. The most common method for finding this line is OLS (or the Ordinary Least Squares Method).
In OLS, we find the regression line by minimizing the sum of squared residuals—also called squared errors. Anytime you draw a straight line through your data, there will be a vertical distance between each point on your scatter plot and the regression line. These vertical distances are called residuals (or errors).
They represent the difference between the actual values of your dependent variableYi, and the predicted value of that variable,Yi. The regression you find with OLS is the line that minimizes the sum of squared residuals.
Residual(e)=yi−yi
You can calculate the OLS regression line by hand, but it’s much easier to do so using statistical software like Excel, Desmos, R, or Stata. In this video, Professor AnnMaria De Mars explains how to find the OLS regression equation using Desmos.
How To Interpret the Results of Simple Regression
Depending on the software you use, the results of your regression analysis may look different. In general, however, your software will display output tables summarizing the main characteristics of your regression.
The values you should be looking for in these output tables fall under three categories:
This is the β0 value in your regression equation. It is the y-intercept of your regression line, and it is the estimate of Y when X is equal to zero.
Next to your intercept, you’ll see columns in the table showing additional information about the intercept. These include a standard error, p-value, T-stat, and confidence interval. You can use these values to test whether the estimate of your intercept is statistically significant.
Regression coefficient
This is the β1 of your regression equation. It’s the slope of the regression line, and it tells you how much Y should change in response to a 1-unit change in X.
Similar to the intercept, the regression coefficient will have columns to the right of it. They'll show a standard error, p-value, T-stat, and confidence interval. Use these values to test whether your parameter estimate of β1 is statistically significant.
Regression Statistics
Correlation coefficient (or multiple R)
This is the Pearson Correlation coefficient. It measures the strength of the correlation between X and Y.
R-squared (or the coefficient of determination)
We calculate this value by squaring the correlation coefficient. The independent variable can explain how much of the variance in your dependent variable. You can convert R2 into a percentage by multiplying it by 100.
Standard error of the residuals
The standard error of the residuals is the average value of the errors in your model. It is the average vertical distance between each point on your scatter plot and the regression line. We measure this value in the same units as your dependent variable.
Degrees of freedom
In simple linear regression, the degrees of freedom equal the number of data points you used minus the two estimated parameters. The parameters are the intercept and regression coefficient.
Residuals
Some software will also output a 5-number summary of your residuals. It'll show the minimum, first quartile, median, third quartile, and maximum values of your residuals.
ANOVA
P-value (or Significance F)- This is the p-value of your regression model.
It returns a hypothesis test's results where the null hypothesis is that no relationship exists between X and Y. The alternative hypothesis is that a linear relationship exists between X and Y.
If you are using a significance level (or alpha level) of 0.05, you would reject the null hypothesis if the p-value is less than or equal to 0.05. You would fail to reject the null hypothesis if your p-value is greater than 0.05.
FAQ
What are correlations?
A correlation is a measure of the relationship between two variables.
Positive Correlations - If two variables, X and Y, have a positive linear correlation, Y tends to increase as X increases, and Y tends to decrease as X decreases. In other words, the two variables tend to move together in the same direction.
Negative Correlations - Two variables, X and Y, have a negative correlation if Y tends to increase as X decreases and Y tends to decrease as X increases. (i.e., The values of the two variables tend to move in opposite directions).
What’s the difference between the dependent and independent variables in a regression?
A simple linear regression involves two variables: X, the input or independent variable, and Y, the output or dependent variable. The independent variable is the variable you want to estimate using the regression. Its estimated value “depends” on the parameters and other variables of the model.
The independent variable—also called the predictor variable—is an input in the model. Its value does not depend on the other elements of the model.
Is the correlation coefficient the same as the regression coefficient?
The correlation coefficient and the regression coefficient will both have the same sign (positive or negative), but they are not the same. The only case where these two values will be equal is when the values of X and Y have been standardized to the same scale.
What is a correlation coefficient?
A correlation coefficient—or Pearson’s correlation coefficient—measures the strength of the linear relationship between X and Y. It’s a number ranging between -1 and 1. The closer a coefficient correlation is to 0, the weaker the correlation is between X and Y.
The closer the correlation coefficient is to 1 or -1, the stronger the correlation. Points on a scatter plot will be more dispersed around the regression line when the correlation between X and Y is weak, and the points will be more tightly clustered around the regression line when the correlation is strong.
What is the regression coefficient?
The regression coefficient,β1, is the slope of the regression line. It provides you with an estimate of how much the dependent variable, Y, will change in response to a 1-unit increase in the dependent variable, X.
The regression coefficient can be any number from −∞ to ∞. A positive regression coefficient implies a positive correlation between X and Y, and a negative regression coefficient implies a negative correlation.
Can I use linear regression in Excel?
Yes. The easiest way to add a simple linear regression line in Excel is to install and use Excel’s “Analysis Toolpak” add-in. To do this, go to Tools > Excel Add-ins and select the “Analysis Toolpak.”
Next, follow these steps.
In your spreadsheet, enter your data for X and Y in two columns
Navigate to the “Data” tab and click on the “Data Analysis” icon
From the list of analysis tools, select “Regression” and click “OK”
Select the data for Y and X respectively where it says “Input Y Range” and “Input X Range”
If you’ve labeled your columns with the names of your X and Y variables, click on the “Labels” checkbox.
You can further customize where you want your regression in your workbook and what additional information you would like Excel to display.
Once you’ve finished customizing, click “OK”
Your regression results will display next to your data or in a new sheet.
Is linear regression used to establish causal relationships?
Correlations are not equivalent to causation. If two variables are correlated, you cannot immediately conclude one causes the other to change. A linear regression will immediately indicate whether two variables correlate. But you’ll need to include more variables in your model and use regression with causal theories to draw conclusions about causal relationships.
What are some other types of regression analysis?
Simple linear regression is the most basic form of regression analysis. It involves one independent variable and one dependent variable. Once you get a handle on this model, you can move on to more sophisticated forms of regression analysis. These include multiple linear regression and nonlinear regression.
Multiple linear regression is a model that estimates the linear relationship between variables using one dependent variable and multiple predictor variables. Nonlinear regression is a method used to estimate nonlinear relationships between variables.
Outlier (from the co-founder of MasterClass) has brought together some of the world's best instructors, game designers, and filmmakers to create the future of online college.