What Is Standard Error? Statistics Calculation and Overview
02.02.2023 • 6 min read
Sarah Thomas
Subject Matter Expert
Learn what is standard error in statistics. This overview explains the definition, the process, the difference with standard deviation, and includes examples.
The standard error (SE) of a statistic is the standard deviation of its sampling distribution.
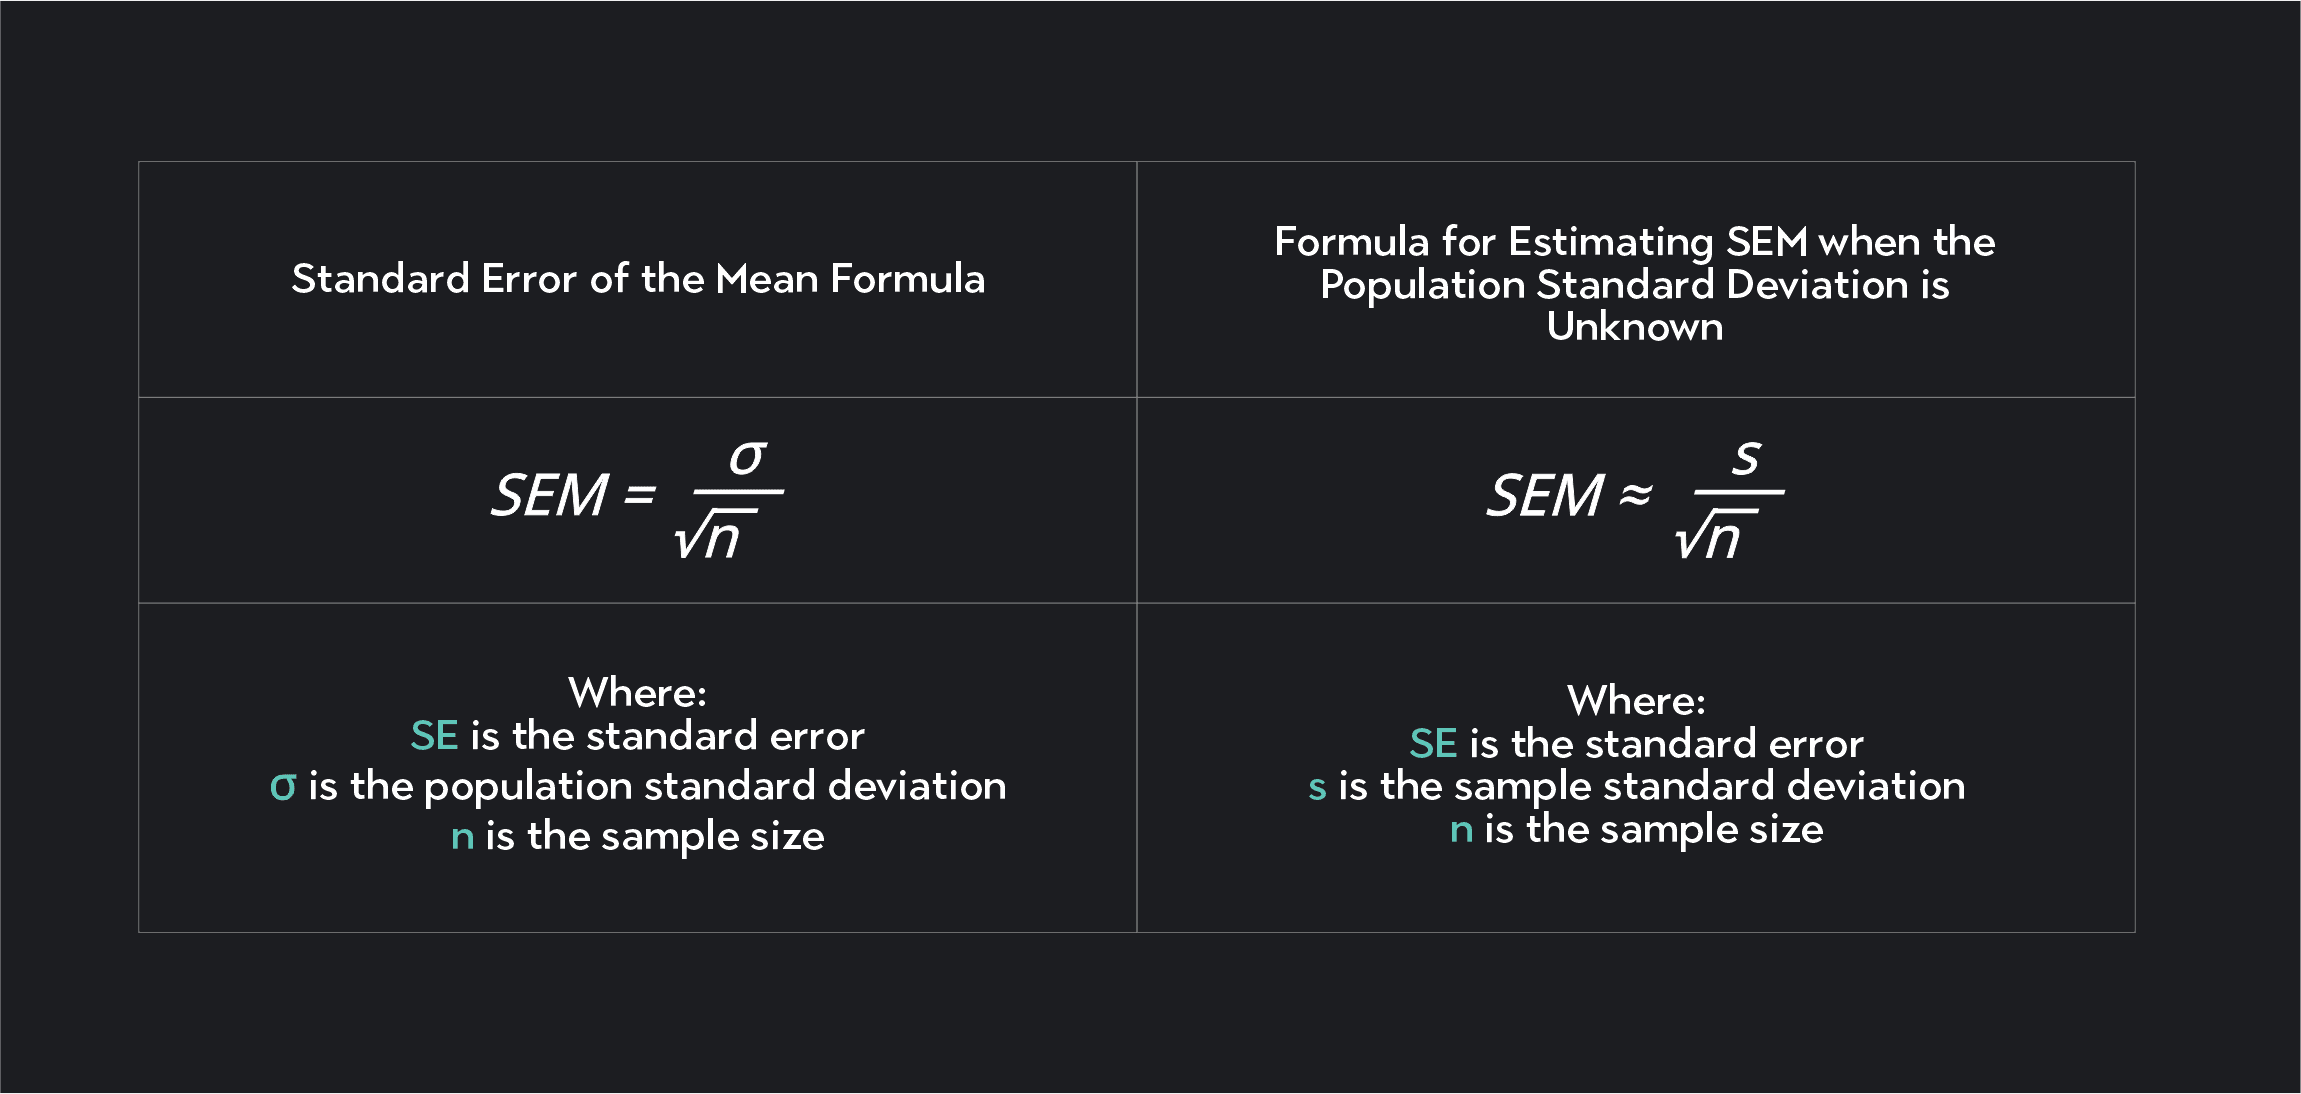
For a sample mean, the standard error is denoted by SE or SEM and is equal to the population standard deviation (σ) divided by the square root of the sample size (n).
If the population standard deviation is unknown, you can estimate the standard error by using the sample standard deviation (s) in place of the population standard deviation (σ).
What Does The Standard Error Tell Us?
Standard errors are important because they indicate how accurately a statistic estimates a parameter.
Remember, in inferential statistics, the goal is to draw conclusions about a population from a sample. We use our sample data to calculate sample statistics—such as a sample mean—which we can then use to estimate the corresponding population parameter.
For example, say you want to know the mean height for a population of 10,000 people. You can’t measure heights for the whole population, so instead, you draw a random sample of 100 individuals and calculate the average height for the sample. The average height you calculate is your sample statistic (xˉ), and you can use it to make inferences about the average height (μ) for the population.
Use a sample mean → To estimate the population mean
xˉ→μ
Because your sample is not identical to your population, the sample mean is likely somewhat larger or smaller than the actual population mean. If you were to repeat the sampling process, you would get numerous sample means, each deviating from the true population parameter to some degree. These sample means form a distribution of their own, known as a sampling distribution.
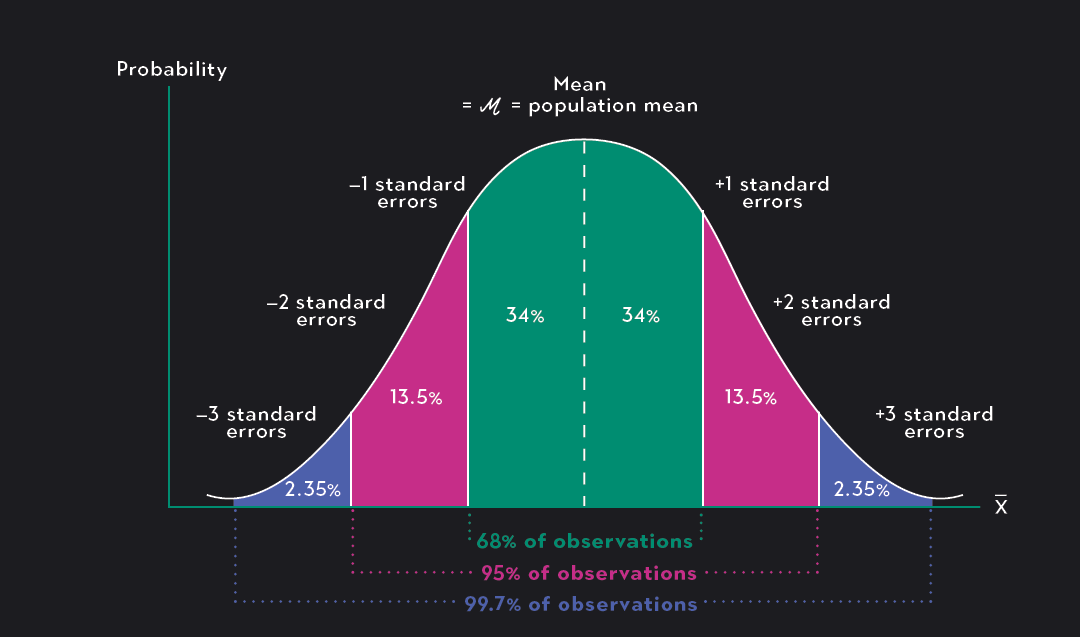
According to the Central Limit Theorem, so long as each sample size is large enough, the sampling distribution of the sample means will follow a normal distribution with a mean equal to the true population mean. The standard error measures the dispersion of the sampling distribution; it is the standard deviation of the sampling distribution.
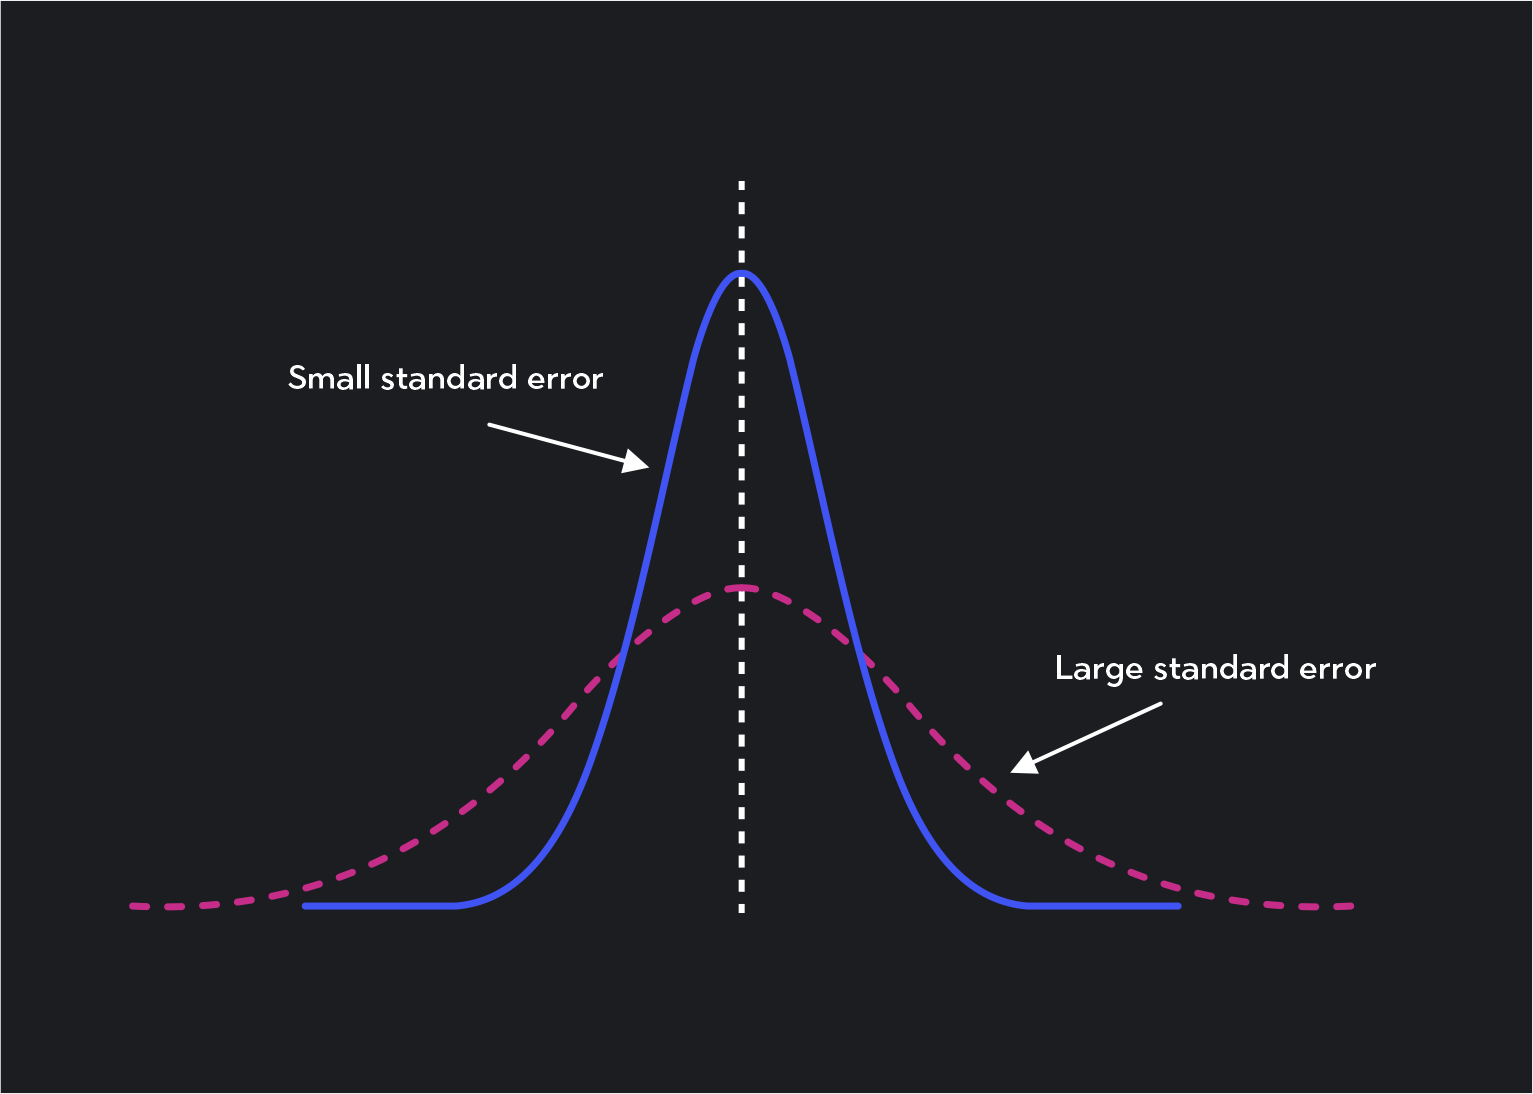
A large standard error tells you that the sampling distribution is widely spread around its mean, while a smaller standard error tells you that the sampling distribution is more tightly clustered around the true population mean. The smaller the standard error is, the more likely it is that any given sample mean you calculate is closer to the value of the true population mean.
Standard Error, Sample Size, and the Law of Large Numbers
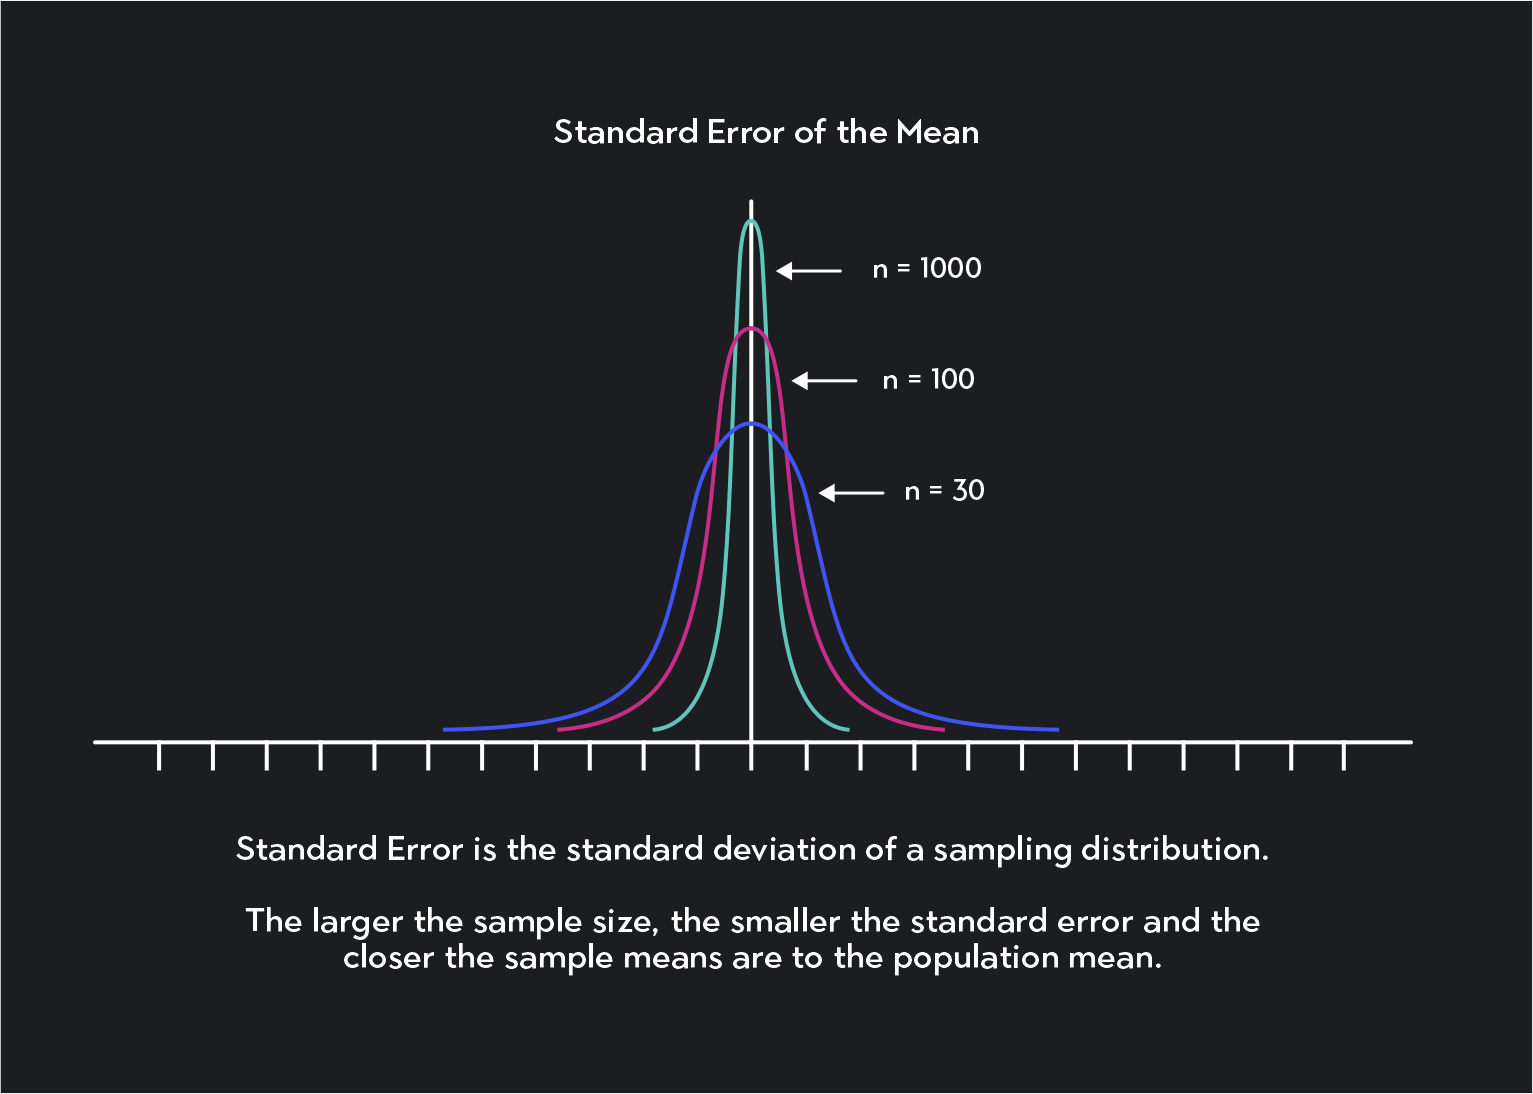
Notice that the sample size, n, is in the denominator of the standard error equation.
With a large sample size, your standard error will be smaller. In other words, as your sample size increases, the sample means in the sampling distribution will move closer and closer to the true population mean, and any given sample mean is likely to be a better estimate of the true population mean than was the case for when the sample size was smaller. In statistics, this is known as the law of large numbers.
The Law of Large Numbers
For a random sample, as the sample size (n) approaches the population size (N), the sample mean (xˉ) approaches the true population mean μ.
It’s easy to confuse standard error with standard deviation. Standard deviation measures the variability of your data relative to its mean. The standard error is a special case of standard deviation. We strictly use it to describe the standard deviation of a sampling distribution.
In inferential statistics, you’ll need to remember the differences between the standard deviation of your population, the standard deviation of your sample, and the standard error of the sampling distribution.
Population Standard Deviation (σ)
- This is the standard deviation calculated for your population data.
Sample Standard Deviation (s)
- This is the standard deviation calculated for your sample data.
Standard Error (SE)
- This is the standard deviation of the sampling distribution.
How To Find the Standard Error?
To calculate the standard error of the mean, follow these three steps:
Find the population standard deviation sigma (𝜎). If the population standard deviation is unknown, calculate the sample standard deviation, s.
Calculate the square root of your sample size.
Divide the population standard deviation—or sample standard deviation—by the square root of the sample size. If you are using the sample standard deviation, understand that your result will only be an estimate of the standard error.
Solved Examples
Example 1
A company has 500,000 employees, and you want to know their average income. You take a random sample of 100 employees and find that the average income for your sample is $55,000. You also know that the population standard deviation is $30,000.
Solution
In this example, you have all of the information you need to calculate the standard error. You’re given both the population standard deviation ($30,000) and the sample size (100). All you need to do is divide the standard deviation by the square root of the sample size.
SEM=nσ=10030,000=3,000
Example 2
Noah has a citrus farm where he grows tangelos. He grows hundreds of thousands of tangelos each year and wants to know, on average, what one of his tangelos weighs. He takes a sample of 25 fruit and finds a sample mean value of 7 ounces. The sample standard deviation for his sample is 0.50.
Solution
In this example, you do not know the population standard deviation, so you can only estimate the standard error. You can do so by dividing the sample standard deviation by the square root of the sample size.
SEM=nσ=250.50=0.1 ounces
Reporting Standard Errors
We report a standard error in two common ways. The first is to report it alongside your sample statistic. The second is to report the standard error as a confidence interval.
In one of the examples from above, the sample mean income was $55,000, and we calculated a standard error equal to $3,000.
We could report this as:
xˉ=55,000±3000(SE)
Or we could construct a 95% confidence interval and say:
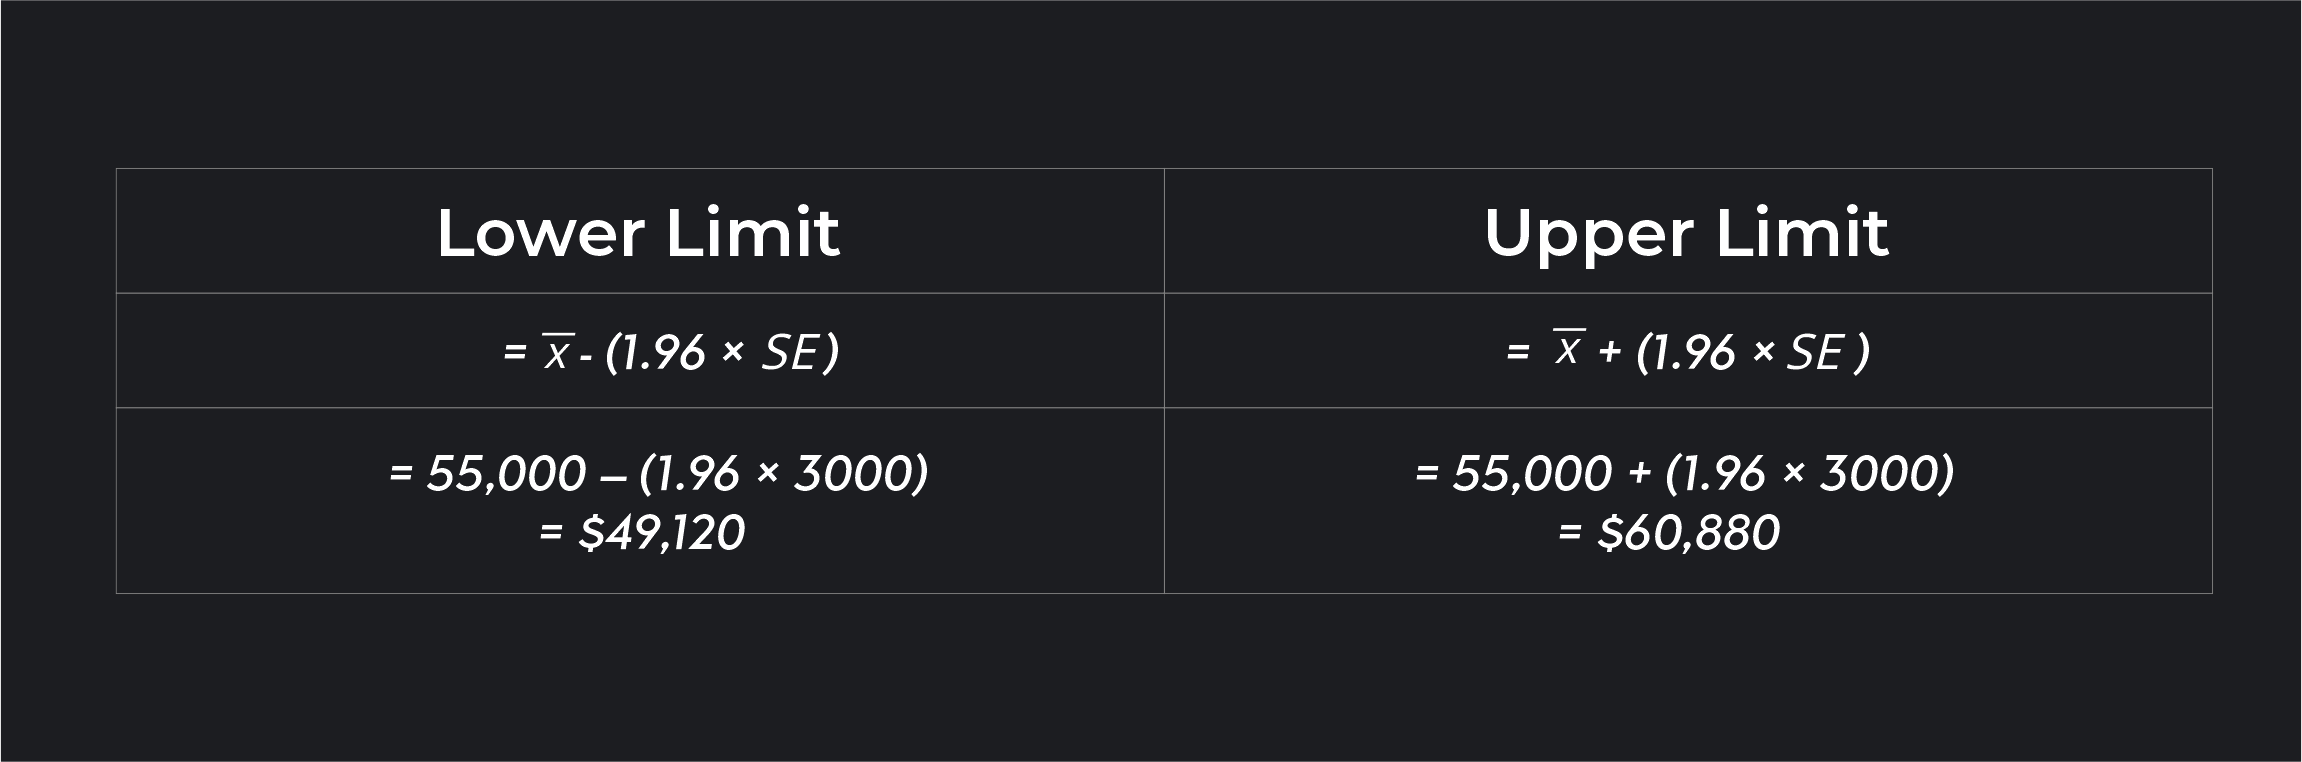
The population mean is in [$49,120 $60,880] reported at a 95% confidence level.
A confidence interval is a way of estimating a population parameter using a range of values rather than a point estimate. A 95% confidence interval tells you that if you were to repeat the sampling process, 95% of your intervals would contain the true value of the population parameter. To construct a 95% confidence interval, calculate a lower and upper limit equal to xˉ±(1.96×SE).
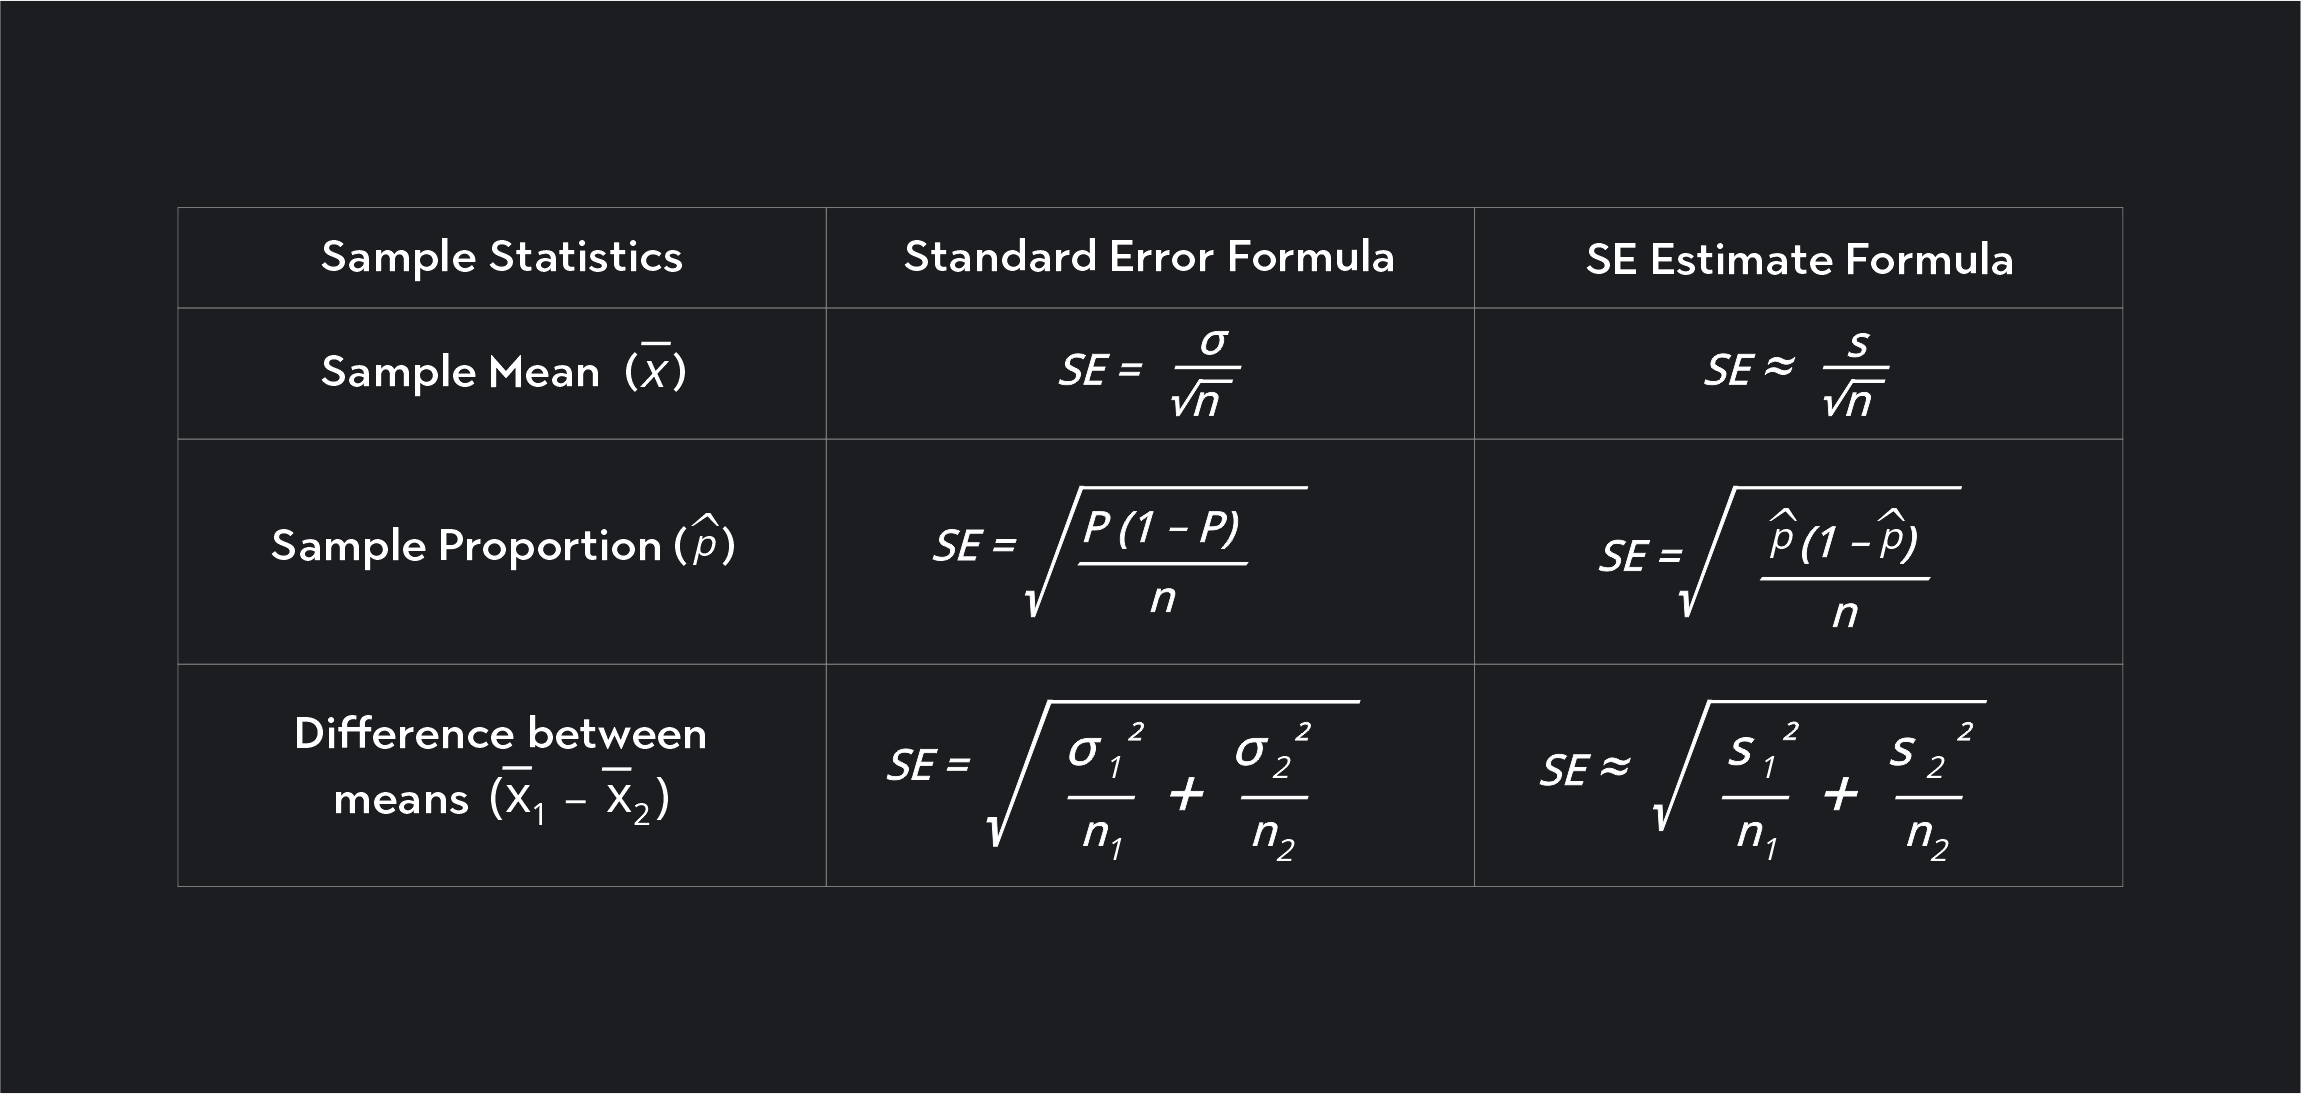
Other Standard Error Formula
In this article, we focused mainly on the standard error of the sample mean, but statisticians calculate standard errors for other statistics as well. Here are some examples.
Outlier (from the co-founder of MasterClass) has brought together some of the world's best instructors, game designers, and filmmakers to create the future of online college.