In This Article
What Is the Median?
How to Find the Median
Finding the Median Using Statistical Software
Why Are Medians Important? And How Are They Different from the Mean?
Finding the Median with Ordinal Data
What Is the Median?
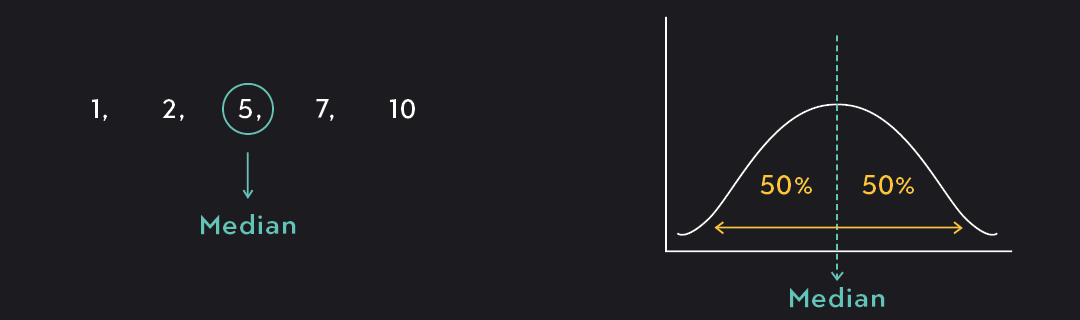
The median is the value that falls in the middle of a data set when the values are arranged in increasing order. The median marks the data’s 50th percentile, dividing the bottom half of the data from the top half.
Median, mean, and mode are all measures of center, but they do not represent the same thing:
The median is the middle of your data, and it marks the 50th percentile.
The mean is the arithmetic average of your data.
The mode is the value that occurs most frequently in your data.
How to Find the Median
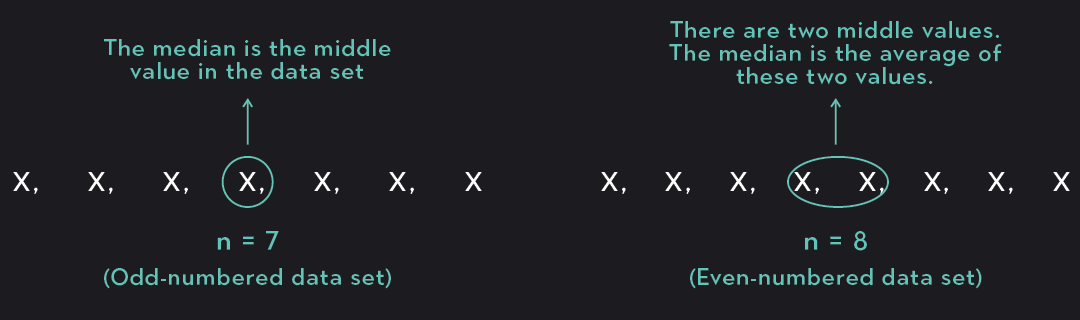
To find the median, arrange your data from smallest to largest and look for the middle value. If the total number of data points is odd, there will be one number that sits directly in the middle of your data set, and this will be your median. If the total number of data points is even, look for the two middle values and average them. This average will be your median.
Example 1. Finding the median in an odd-numbered data set
Say you have the following odd-numbered data set where n=9:
115, 138, 133, 120, 117, 125, 130, 100, 112
You can calculate the median in 3 easy steps:
1. Arrange the data from smallest to largest
100, 112, 115, 117, 120, 125, 130, 133, 138
2. Identify the position of the median.
If your data set is small, you can identify the middle position just by looking at the data. If your data set is large, you can identify the middle position by dividing the total number of data points by two and rounding up to the nearest whole number.
2n = 29 = 4.5
Rounding up we get 5.
The median will be the 5th value in the data set.
2. Find the median based on the position identified in the previous step.
From the previous step, we know that the median is the 5th value in the data set. The 5th value, in this case, is 120. We can confirm that this is the median by checking to see if there is an equal number of observations above and below it.
Example 2. Finding the median with an even-numbered data set
Say you have the following even-numbered data set where n=8:
1, 11, 17, 5, 15, 10, 3, 8
The first step is the same, but the second and third steps are slightly different.
1. Arrange the data in numerical order from smallest to largest
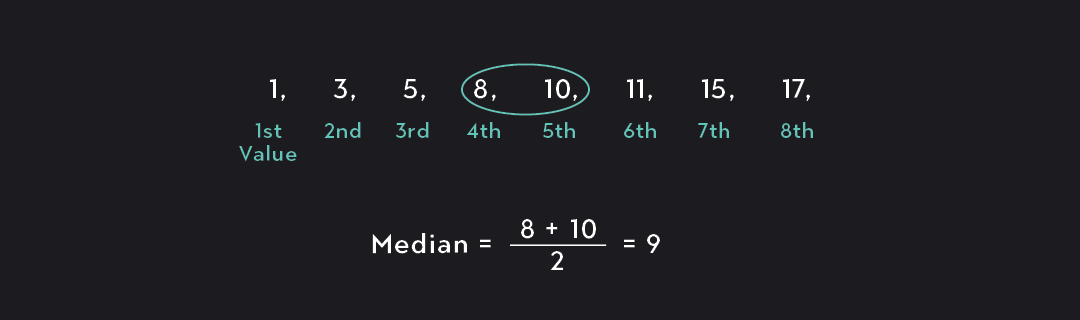
1, 3, 5, 8, 10, 11, 15, 17
2. Identify the position of the two middle values.
When n is even, there will be two values in the middle of your data. You can identify the position of these two values using the following formulas:
In this case, the middle values are the 4th and 5th values:
28 = 4
28 + 1 = 5
3. Find the median by averaging the two values positioned in the middle of your data.
The fourth and fifth values of this data are 8 and 10. We find the median by averaging them.
Finding the Median Using Statistical Software
While it’s helpful to know how to calculate the median by hand, it is often easier to find the median using statistical software.
In Excel or Google sheets, use the formula =MEDIAN().
The list of your data should be included inside the parentheses. For example, if your data has ten values in cells A1 through A10, the formula would be =MEDIAN(A1:A10).
In Desmos, use the function median() to find the median.
The values in your data set should be included inside the parentheses. To find the median from Example 1 above, you would type: median(115, 138, 133, 120, 117, 125, 130, 100, 112).
In R, you can also use the command median().
You should include a list of your data or the name of your random variable inside the parentheses.
For practice, try calculating the median from the examples above using one or all of these options.
Why Are Medians Important? And How Are They Different from the Mean?
The median is a measure of center that is not affected by outliers or the skewness of data.
If you have a roughly symmetric data set, the mean and the median will be similar values, and both will be good indicators of the center of the data. When the distribution of data is not symmetric—when data is skewed heavily to the right or to the left—the median is the preferred measure of centrality. This is because the median is resistant to extreme values and long tails in the data, while the mean is not.
To demonstrate this, imagine ten people grabbing a drink at a local tavern. All ten have similar annual incomes represented in the data below.
$55K, $58K, $62K, $65K, $67K, $70K, $73K, $74K, $77K, $83K
The mean income of this group is $68,400. The median income is $68,500. Notice that the mean and the median are not so different and that both are good indicators of where the data is centered.
Out of the blue, in walks Oprah Winfrey. Let’s say Oprah makes $300 million a year. What happens to the mean and the median? The median income is now $70,000. Not too different from what it was before. The mean income has shot up to $27,335,000. Oprah’s income is an extreme outlier, and it skews the data far to the right.
If someone told you that the mean income of patrons in a bar was just above $27 million, you might imagine a bar filled with millionaires and billionaires. The mean no longer gives us a good sense of where the data is centered, but the median still does.
Finding the Median with Ordinal Data
Ordinal data is data that is not quite qualitative and not quite quantitative, as it consists of categories with a natural order or prescribed rank. A good example is survey data that asks respondents to rank their satisfaction on a scale of 1 to 5. Even though ordinal data has a clear ranking (5 is better than 4 is better than 3, etc.), the scale or distance between each ranking can be uneven or unknown. 5 may be a lot better than 4, but 4 may only be a bit better than 3. Alternatively, different respondents might have subjective interpretations of what constitutes each ranking.
Medians cannot be calculated for qualitative data, but you can calculate a median for an odd-numbered ordinal data set. Let’s say you have a survey asking respondents to rank a movie on a scale from 1 to 10. In this case, you could calculate the median following the exact same method we showed above.
If you have an even-numbered ordinal data set, technically speaking, you cannot calculate a median. This is because you cannot average two ranks that have an uneven or unknown scale.
Consider the following health survey question. Each response to this question is coded with a ranked number:
How often do you have a drink containing alcohol?
Imagine you survey eight people with this question, and the resulting ordinal data is: {0, 1, 2, 3, 4, 4, 4, 4}. In this case, the two middle values of the data are 3 and 4, but there is no way to take the average of “2 to 3 times a week” and “4 or more times a week.”
Despite the technical ambiguities, some people believe that calculating a median for ordinal data is meaningful and necessary, even for even-numbered data. In spite of the equivocal results, you can choose to calculate the median of ordinal data, even when the data set is even-numbered. To do this, you can assign the median to the lower of your two middle values, or you can go ahead and take the average of the two middle rankings. If you want to calculate a median for an ordinal data set, think carefully about what it means to do so and always keep in mind that some people might challenge your calculations.
Explore Outlier's Award-Winning For-Credit Courses
Outlier (from the co-founder of MasterClass) has brought together some of the world's best instructors, game designers, and filmmakers to create the future of online college.
Check out these related courses: