
Statistics
What Do Subsets Mean in Statistics?
This article explains what subsets are in statistics and why they are important. You’ll learn about different types of subsets with formulas and examples for each.
Sarah Thomas
Subject Matter Expert

Statistics
03.23.2022 • 6 min read
Subject Matter Expert
The article explains what variance means, how to calculate it, how to use the formula and the main differences between variance and standard deviation.
In This Article
Variance is a parameter or a statistic that measures how spread-out data is relative to its mean. We calculate variance as the average of the squared deviations from the mean.
Measures of spread like variance are important in statistics because they give you additional information about your data.
You can’t get this information by only using measures of center such as:
Mean
Mode
A low variance tells you your data is clustered closely around the mean and does not vary much.
A high variance tells you your data is dispersed widely around the mean and varies quite a bit.
Imagine there are two statistics classes taught by two different professors. Both professors have agreed to aim for a class average of 85—a B letter grade. Yet, in one class, the variance of grades is very low. In the other class, the variance of grades is very high.
Which class would you prefer to be in? Most of the grades will be close to a B in the class with low variance, while there will be more students with very low or very high grades in the second class.
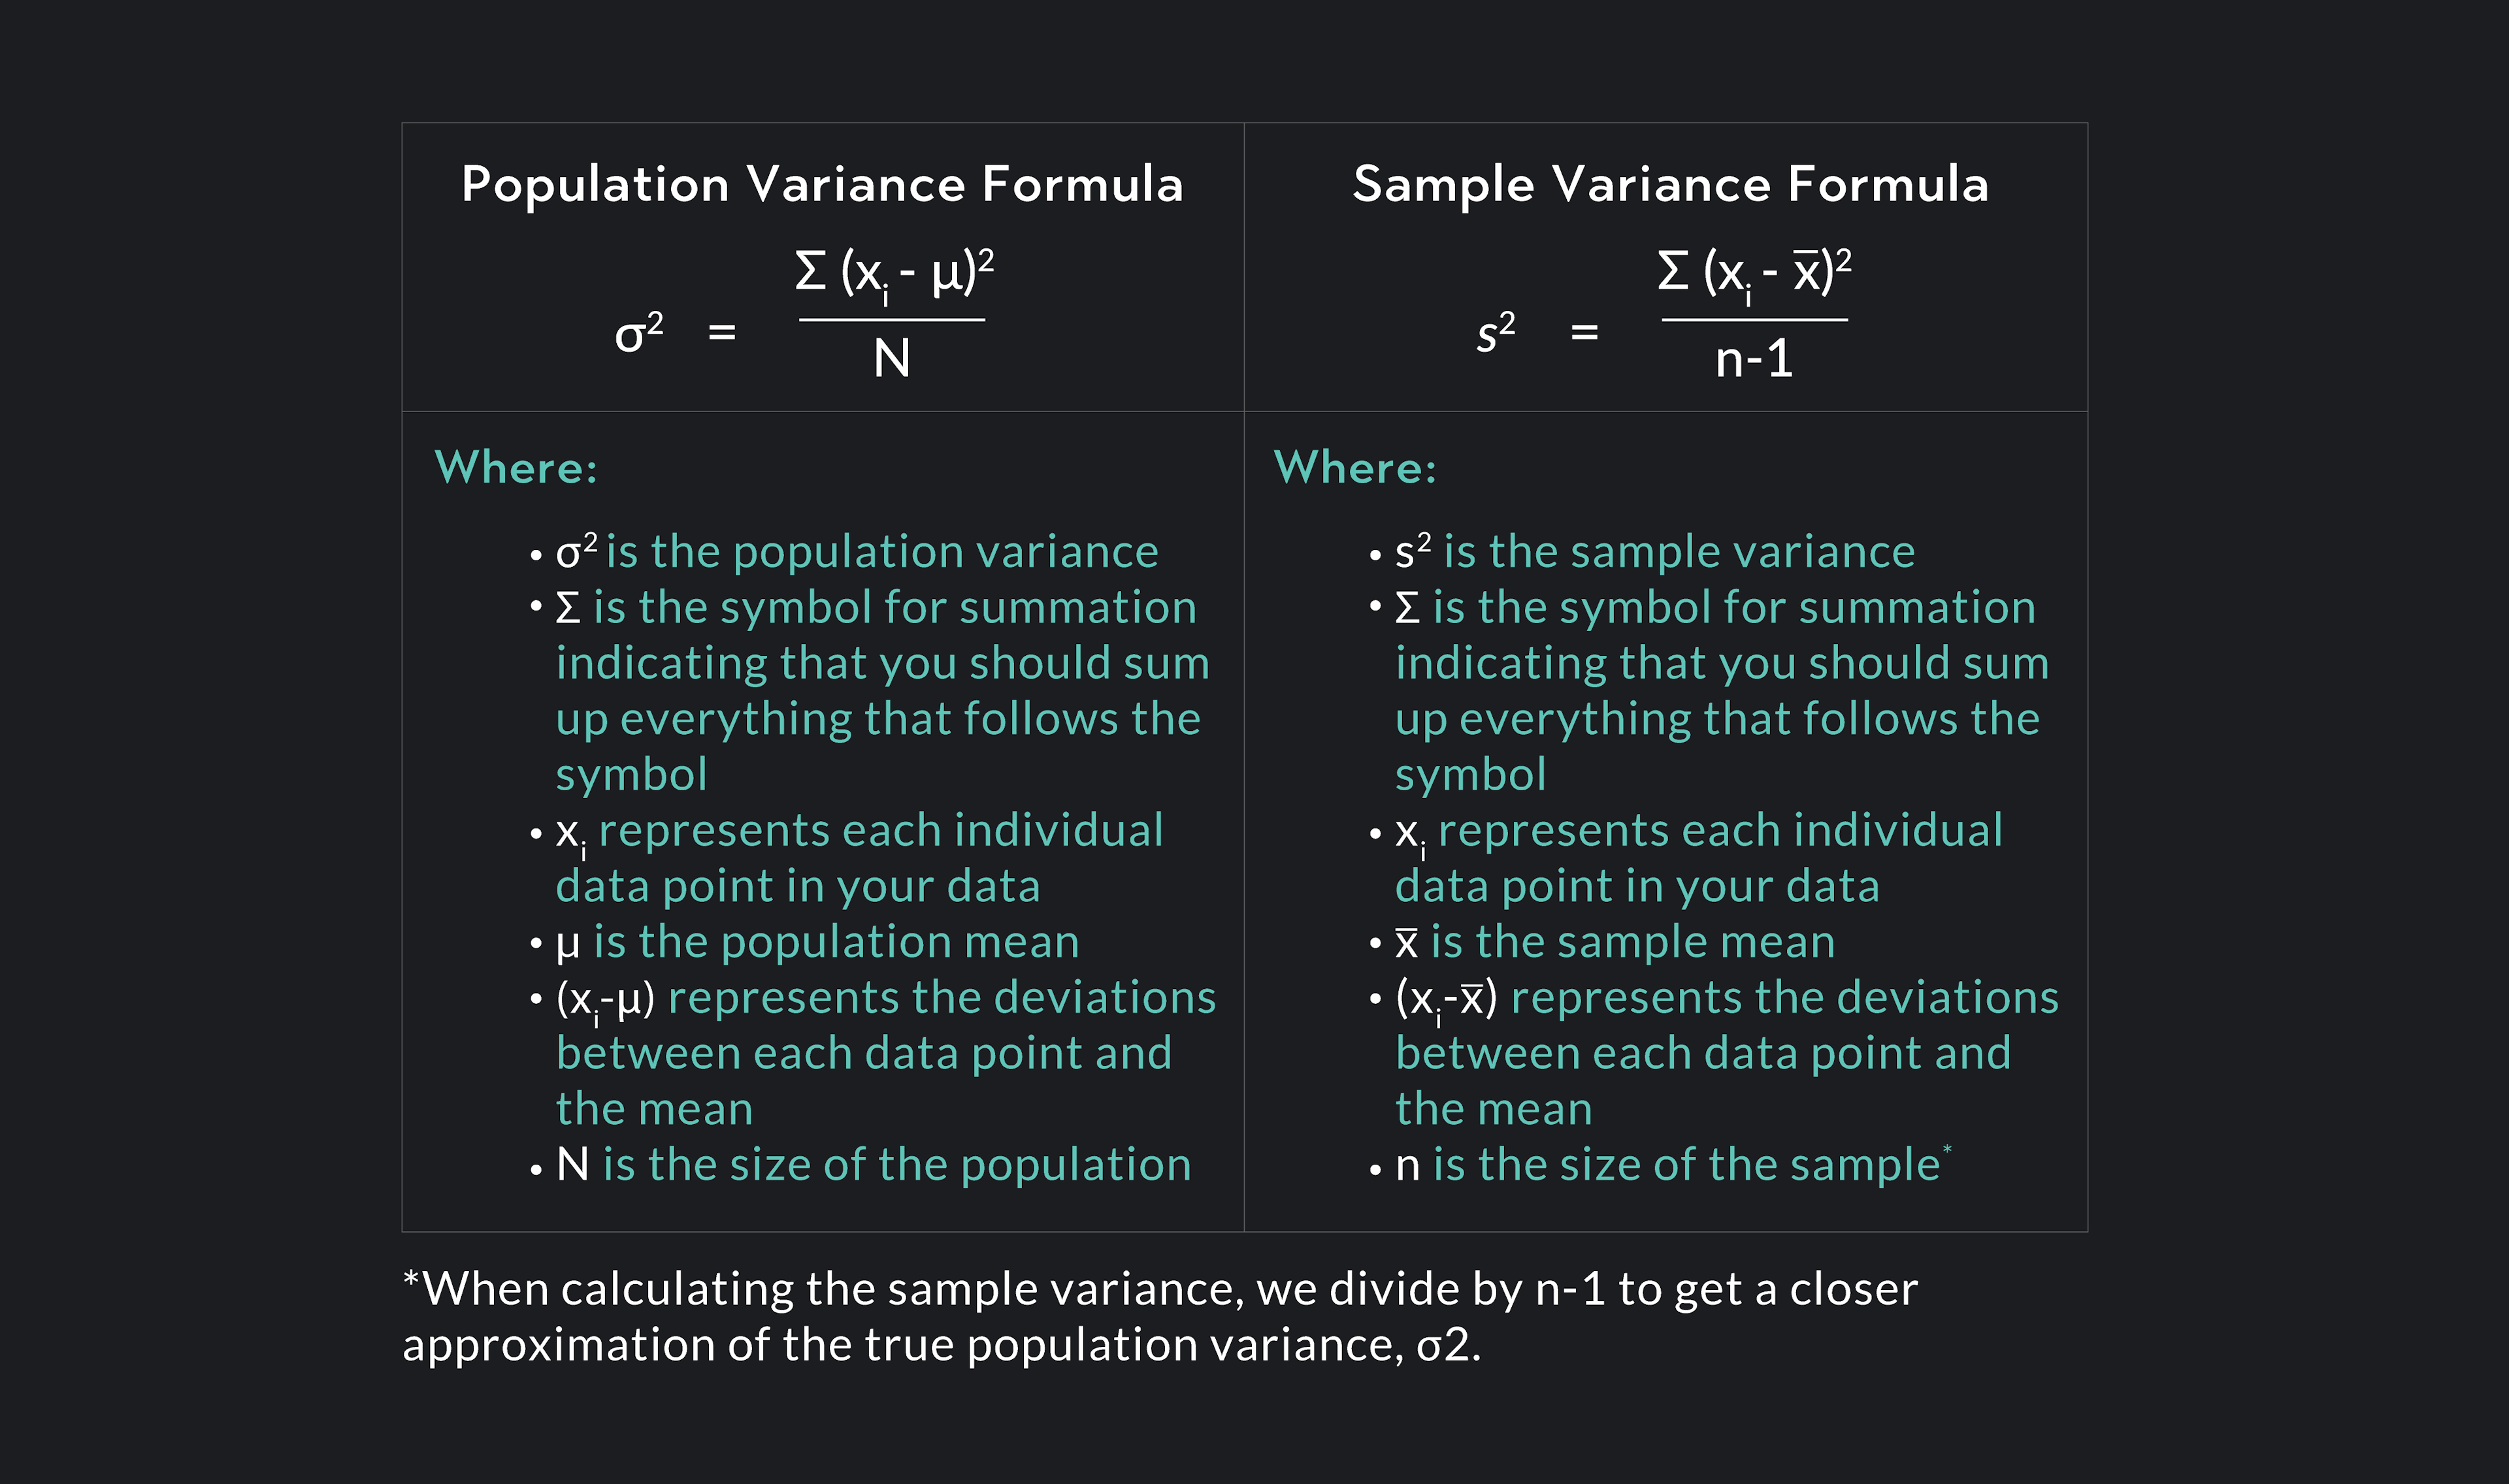
When we calculate variance for a population, the symbol sigma-squared represents it.
When we calculate variance for a sample denotes it.
Variance is a parameter or a statistic that measures how spread-out data is relative to its mean.
To calculate variance, take the average of the squared deviations—also called the squared differences—from the mean.
Remember, a deviation from the mean is the difference between a particular data point and the mean.
In statistics, a population refers to the entire set of objects or events being studied. A sample is a subset of the population. As an example, imagine you’re studying national elections in the United States. Your population of interest consists of every single eligible voter across the 50 states, but because you can’t collect data for the entire population, you draw random samples (subsets) of voters.
Sometimes statisticians have data for an entire population, but most of the time, they only have sample data from which they draw statistical inferences about the population.
When you are working with population data and calculating variance, use the population variance formula given above.
When you are working with sample data and want to calculate variance, use the sample standard deviation formula given above.
Here is an example of how to calculate variance in 4 easy steps.
Say you have the following sample data on the heights of 10 NBA players randomly selected from the 2021-22 season.
Find the sample mean of your data
To find the variance, you need to first know what the arithmetic mean of your data is. To find the mean, add together all the values in the data set and divide by the sample size . Since we have 10 people in this data set, the sample size is .
Find the squared deviation from the mean for every data point in your data set.
To find the squared deviations from the mean, subtract the sample mean from each player’s height and square the result. This is shown in the third column of the table.
| Player | Height (inches) | |
| RJ Barrett | 78 | |
| Jusuf Nurkic | 84 | |
| James Harden | 77 | |
| Rodney Hood | 80 | |
| Jae'Sean Tate | 76 | |
| Nikola Jokic | 83 | |
| E’Twaun Moore | 76 | |
| Dario Saric | 82 | |
| Tim Frazier | 73 | |
| Brad Wanamaker | 75 |
Sum up all the squared deviations you found in Step 2.
If we sum up the squared deviations from the previous step, we get the sum of the squared deviations from the mean.
Find the variance by dividing the sum of squared deviations by the sample size minus one (-1)
Because we are working with sample data, we divide the sum of squared deviations by -1. If we were instead trying to find the variance of a population, we would divide by the population size .
There’s your answer! The variance for this data set is 13.6 inches squared.
If you look at the example above, you’ll notice that variance is measured in units that are very difficult to interpret. In the example, we wanted to calculate the variance of ten NBA players’ heights. We measure the heights in inches, but we measure the variance in inches-squared!
We end up with units-squared when we measure variance because we use squared deviations in our calculation. There’s a good reason for doing this. To measure the average variation (or average deviation), we want to make sure that negative deviations for data points that lie below the mean don’t cancel out the positive deviations for data points that lie above the mean. The downside of doing this is that we end up with squared units in our result.
To avoid the difficulties of interpreting variance, you will often use a related measure of spread called standard deviation. Standard deviation is just the square root of variance. By taking the square root of the variance, we get our measure back into the interpretable units of the data.
In our NBA example, the variance was 13.6 inches squared, so the sample standard deviation would be 3.69 inches. Because we measure standard deviations in the same units as the data, interpretation is much easier.
A standard deviation of 3.69 inches tells us that an NBA player randomly selected from our sample will tend to have a height that is 3.69 inches above or below the average height of 122.4 inches.
Standard deviation is just the square root of variance.
While it’s important to know how to calculate variance by hand, you are more likely to use programs such as Excel, R, and Desmos to do the calculation for you!
In Microsoft Excel or Google sheets, use the formula =VAR() to calculate variance. Your data should be included inside the parentheses, so if you have ten data points in cells A1 through A10; the formula would be =VAR(A1:A10).
In Desmos and R, the command for variance is also VAR(). You can type your data right between the parentheses, so if your data consists of the set of numbers {5, 7, 10, 15, 20} you would type VAR(5, 7, 10, 15, 20). If your data is stored as a variable, you can use the var() command with the name of the variable inside the parentheses instead of a list of the data points.
For practice, try calculating the variance from our NBA example using one or all of these programs for practice. See if you get the correct answer of 13.6!
Outlier (from the co-founder of MasterClass) has brought together some of the world's best instructors, game designers, and filmmakers to create the future of online college.
Check out these related courses:


Statistics
This article explains what subsets are in statistics and why they are important. You’ll learn about different types of subsets with formulas and examples for each.
Subject Matter Expert

Statistics
Here is an overview of set operations, what they are, properties, examples, and exercises.
Subject Matter Expert

Calculus
Knowing how to find definite integrals is an essential skill in calculus. In this article, we’ll learn the definition of definite integrals, how to evaluate definite integrals, and practice with some examples.
Subject Matter Expert