
Statistics
What Do Subsets Mean in Statistics?
This article explains what subsets are in statistics and why they are important. You’ll learn about different types of subsets with formulas and examples for each.
Sarah Thomas
Subject Matter Expert
Statistics
12.20.2021 • 5 min read
Subject Matter Expert
The Z Score Formula is easy to calculate if you know three things. Learn how to calculate & interpret a Z-Score with real-life examples using the formula.
In This Article
Take Intro to Statistics Online with Outlier.org
From the co-founder of MasterClass, earn transferable college credits from the University of Pittsburgh (a top 50 global school). The world's best online college courses for 50% less than a traditional college.
Get started
Life is full of instances where we want to compare an observed value against the norm.
Here are some examples:
The Netflix series Squid Game drew 111 million views in its first month on the streaming service. How does Squid Game’s viewership compare to other popular series?
You get offered a job out of college at a salary of $42,000 a year. Is this salary high? Low? How does it compare to the incomes of other recent college graduates?
Your niece was just born weighing 6.9 pounds. Is that normal?
Your score on the SAT was 1479. How does that compare to other students?
We can answer all of these questions in a compelling way using Z-scores.
A Z-score is a standardized number that tells you how far away a given data point is from the mean.
Let’s check out three ways to look at z-scores.
1. Z-scores are measured in standard deviation units.
For example, a Z-score of 1.2 shows that your observed value is 1.2 standard deviations from the mean. A Z-score of 2.5 means your observed value is 2.5 standard deviations from the mean and so on.
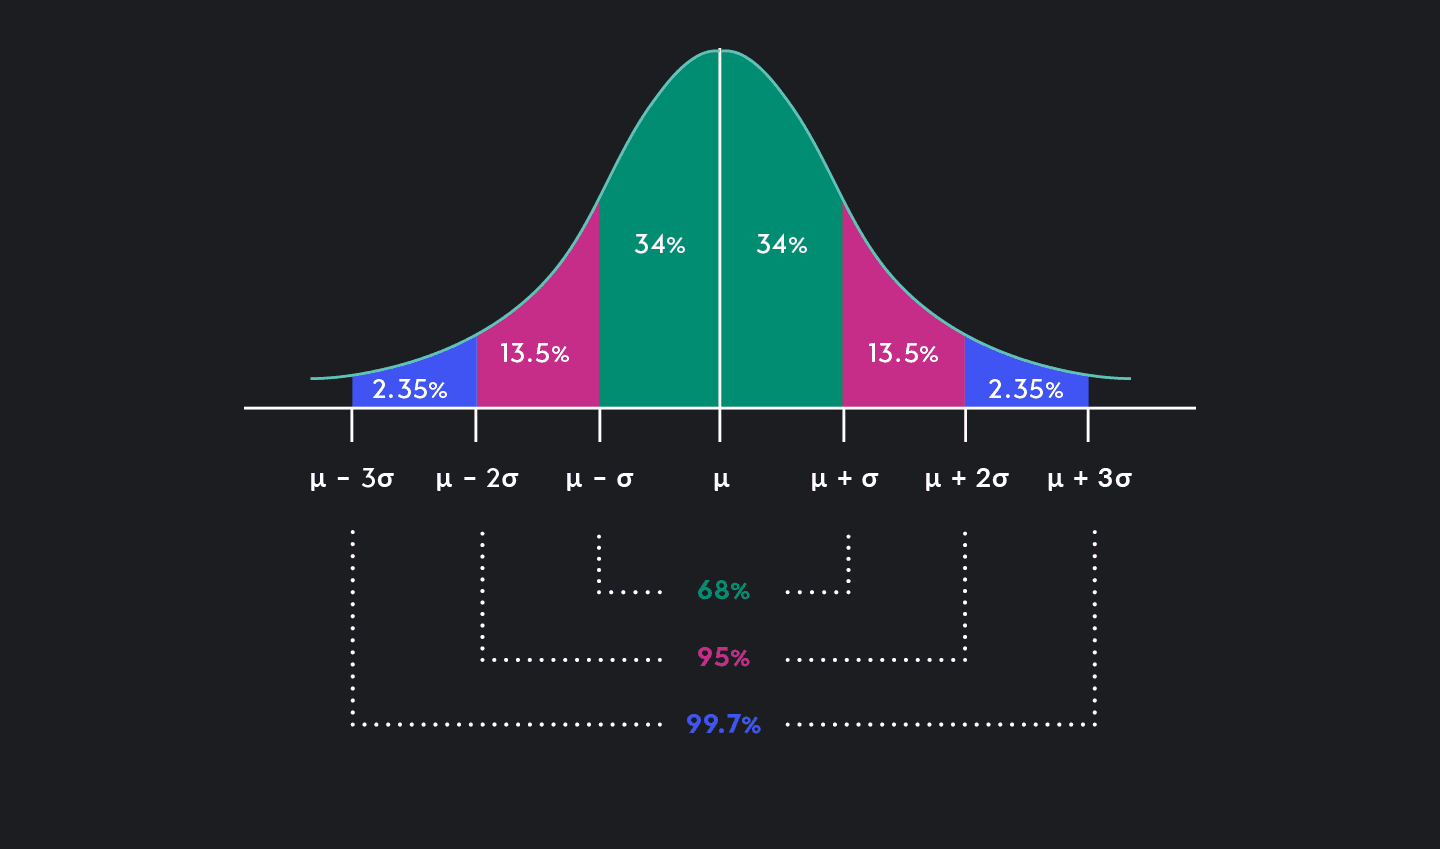
The closer your Z-score is to zero, the closer your value is to the mean. The further away your Z-score is from zero, the further away your value is from the mean. Typically, you will not see Z-scores that are more than 3 standard deviations from the mean. This is because most data points lie within 3 standard deviations of the mean. If you need a refresher, you can visit this guide on standard deviation.
2. Z-scores can be positive or negative.
A positive Z-score shows that your value lies above the mean, while a negative Z-score shows that your value lies below the mean. If I tell you your income has a Z-score of -0.8, you immediately know that your income is below average. How far below average? 0.8 standard deviations. If I tell you that an SAT score has a Z-score of 2, you know the score is above average. How far above the average? 2 standard deviations. Note that a Z-score of zero shows that your value is equal to the mean.
3. Z-Scores allow you to compare your data easily to other metrics.
Beyond telling you just how far a particular value is from the mean, Z-scores come in handy when drawing comparisons between related but distinct metrics.
For example, imagine you are a college admissions officer reviewing an application. The applicant has a 1500 on their SAT and a 3.2 GPA. It is not immediately obvious how to compare these two figures, but if you calculate a Z-score relative to the average test scores and high school GPAs of students enrolled in your college, the comparison becomes much easier. Say the applicant’s SAT Z-score is equal to 2.8 and their GPA Z-score is equal to -1.2. Immediately, you can infer that the applicant is well above average on their test scores but below average with their GPA.
Similarly, you can compare Z-scores across metrics like height and weight, household income and household debt levels, resting heart rates for men versus women, and more. The only thing to remember is that the variables being compared should have similar underlying distributions.
How to find a Z-score is a simple process where you need to know three things:
x. The value for which you want to calculate the Z-score. We sometimes call this the raw score.
𝝁. The population mean.
𝜎. The population standard deviation.
If you know these three things, calculating a Z-score is easy. In the z-score formula, you simply subtract the population mean from your raw score and divide by the population standard deviation.
Let’s go through one of the examples from above. Your niece has just been born weighing 6.9 pounds, and you want to know if this is a normal weight. Use the following information about birthweights in the US to calculate a Z-score.
| Niece’s birth weight (x): 6.9 pounds or 3130 grams |
| Mean birth weight (𝝻): 7.224 pounds or 3276 grams |
| Standard deviation (𝞂): 1.25 pounds or 567 grams |
1. To calculate the Z-score, start by subtracting the mean from the observed value.
| 3130 grams - 3276 gram = -146 grams |
2. Next, divide by the standard deviation.
| -146 grams / 567 grams = -0.26 |
3. Voila! You’ve got the Z-score for your niece’s birth weight. Her birth weight is 0.26 standard deviations below the mean.
| Z-score = -0.26 |
AnnMaria De Mars talks more about z-scores and calculation correlation.
When the raw score, x, is drawn from a distribution that is approximately normal, you can use Z-scores to find probabilities. If x is normally distributed, the probability distribution of the Z-scores will be a standard normal distribution — a normal distribution with a mean equal to 0 and a standard deviation equal to 1.
Because the standard normal distribution follows the empirical rule, and because probabilities associated with the standard normal distribution are well documented, it is easy to look up probabilities based on Z-scores.
Let’s take a look at two examples.
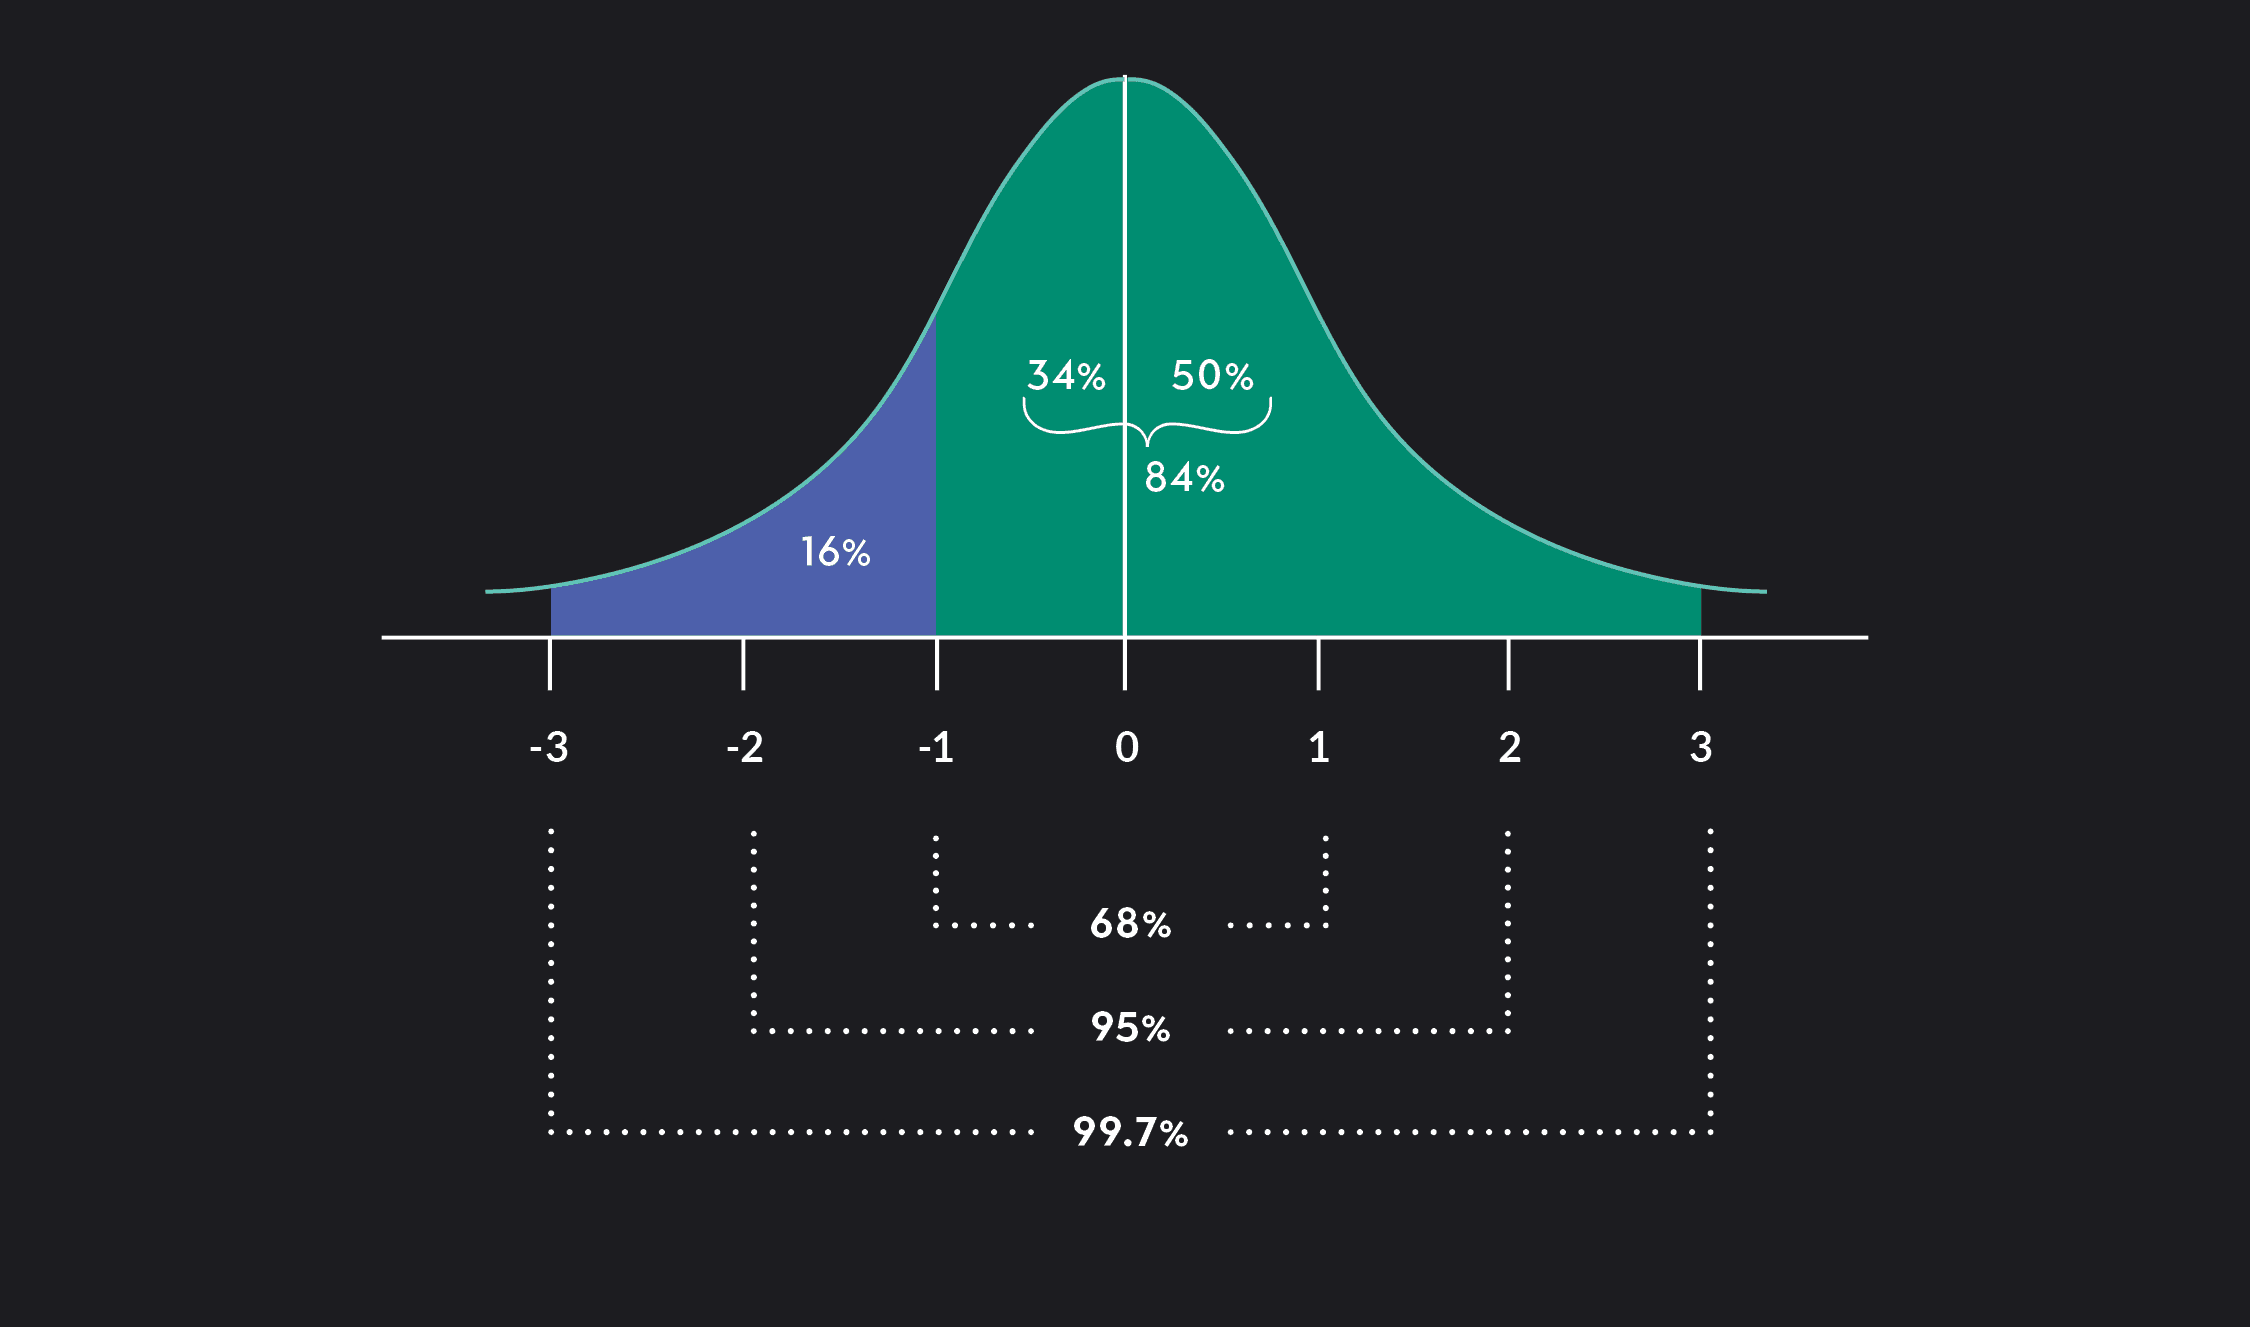
Say that a recent college graduate named Ben has an annual income, which when compared to the incomes of other recent college graduates, has a Z-score of -1. Assuming incomes are normally distributed, you can use the empirical rule to find the percentage of recent college graduates whose incomes are above and below Ben’s. Roughly 16% of recent college graduates will have an income below Ben’s, and roughly 84% of recent graduates will have an income above Ben’s. In other words, a Z-score of -1 puts Ben at roughly the 16th percentile of the distribution.
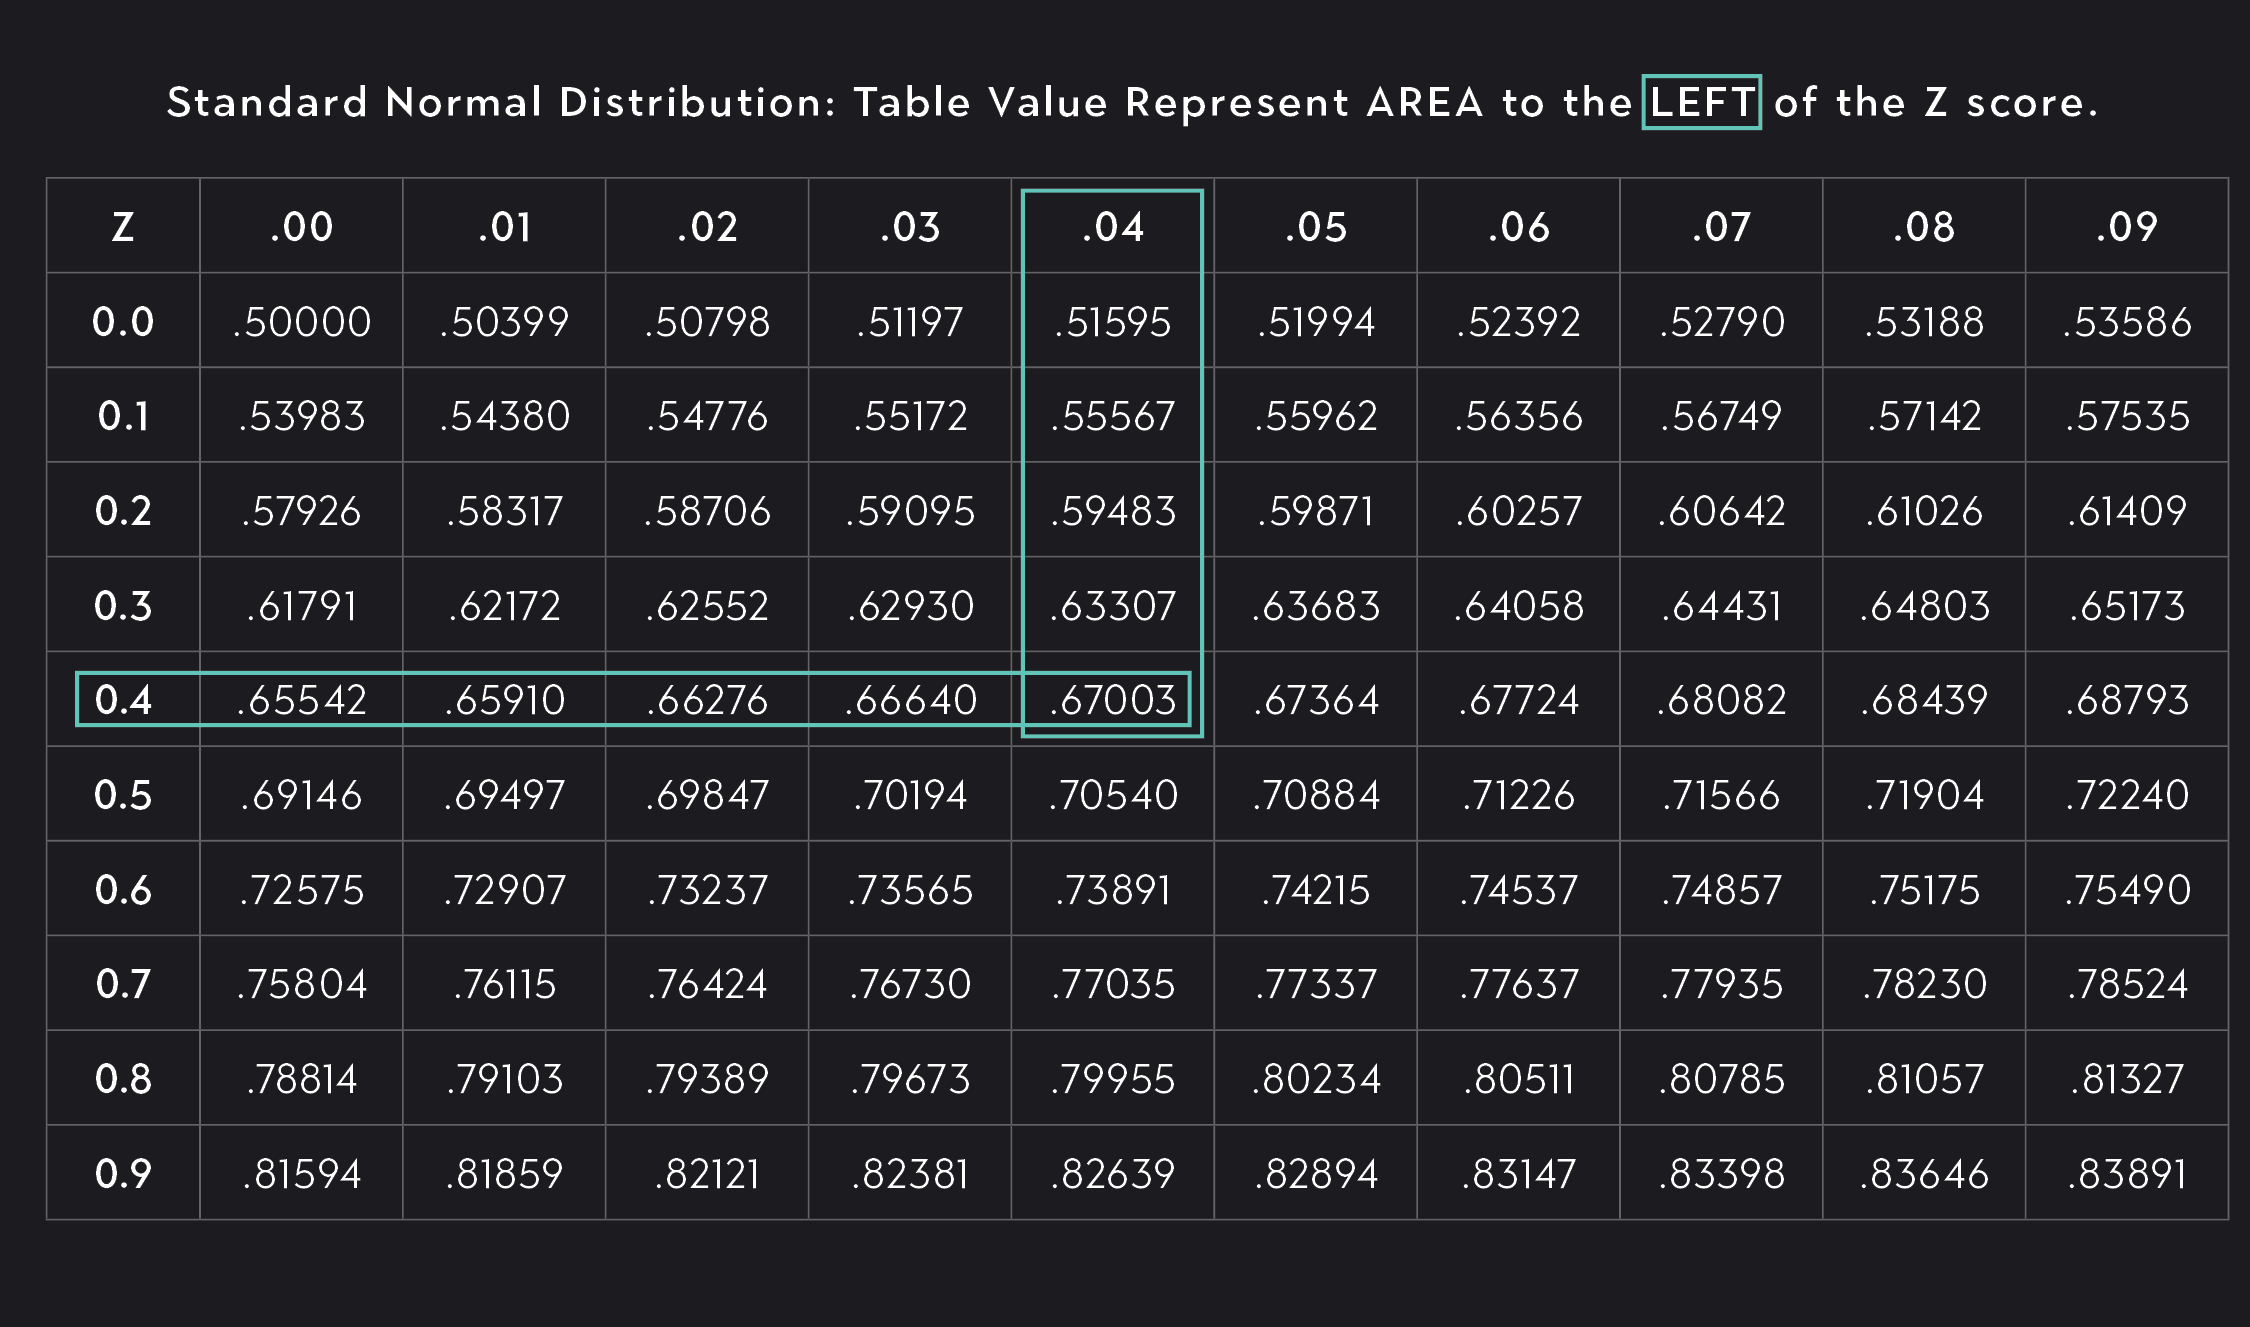
Assume that SAT scores are normally distributed and that an SAT score of 1150 has a Z-score of 0.44. What percent of students score below 1150 and what percent of students score above 1150?
To answer questions like these, you can look up the probabilities associated with the given Z-score (in this case 0.44) in a standard normal table. If you look at a standard normal table that shows probabilities to the left of the Z-score, you will find that roughly 0.67 or 67% of the scores fall below 1150. Knowing this, we can also say that 1-0.67 or 33% of scores are above 1150.
Outlier (from the co-founder of MasterClass) has brought together some of the world's best instructors, game designers, and filmmakers to create the future of online college.
Check out these related courses:


Statistics
This article explains what subsets are in statistics and why they are important. You’ll learn about different types of subsets with formulas and examples for each.
Subject Matter Expert

Statistics
Here is an overview of set operations, what they are, properties, examples, and exercises.
Subject Matter Expert

Calculus
Knowing how to find definite integrals is an essential skill in calculus. In this article, we’ll learn the definition of definite integrals, how to evaluate definite integrals, and practice with some examples.
Subject Matter Expert