Learn all about the coefficient of variation. Included are explanations of the standard deviation and the mean as well as examples and common applications.
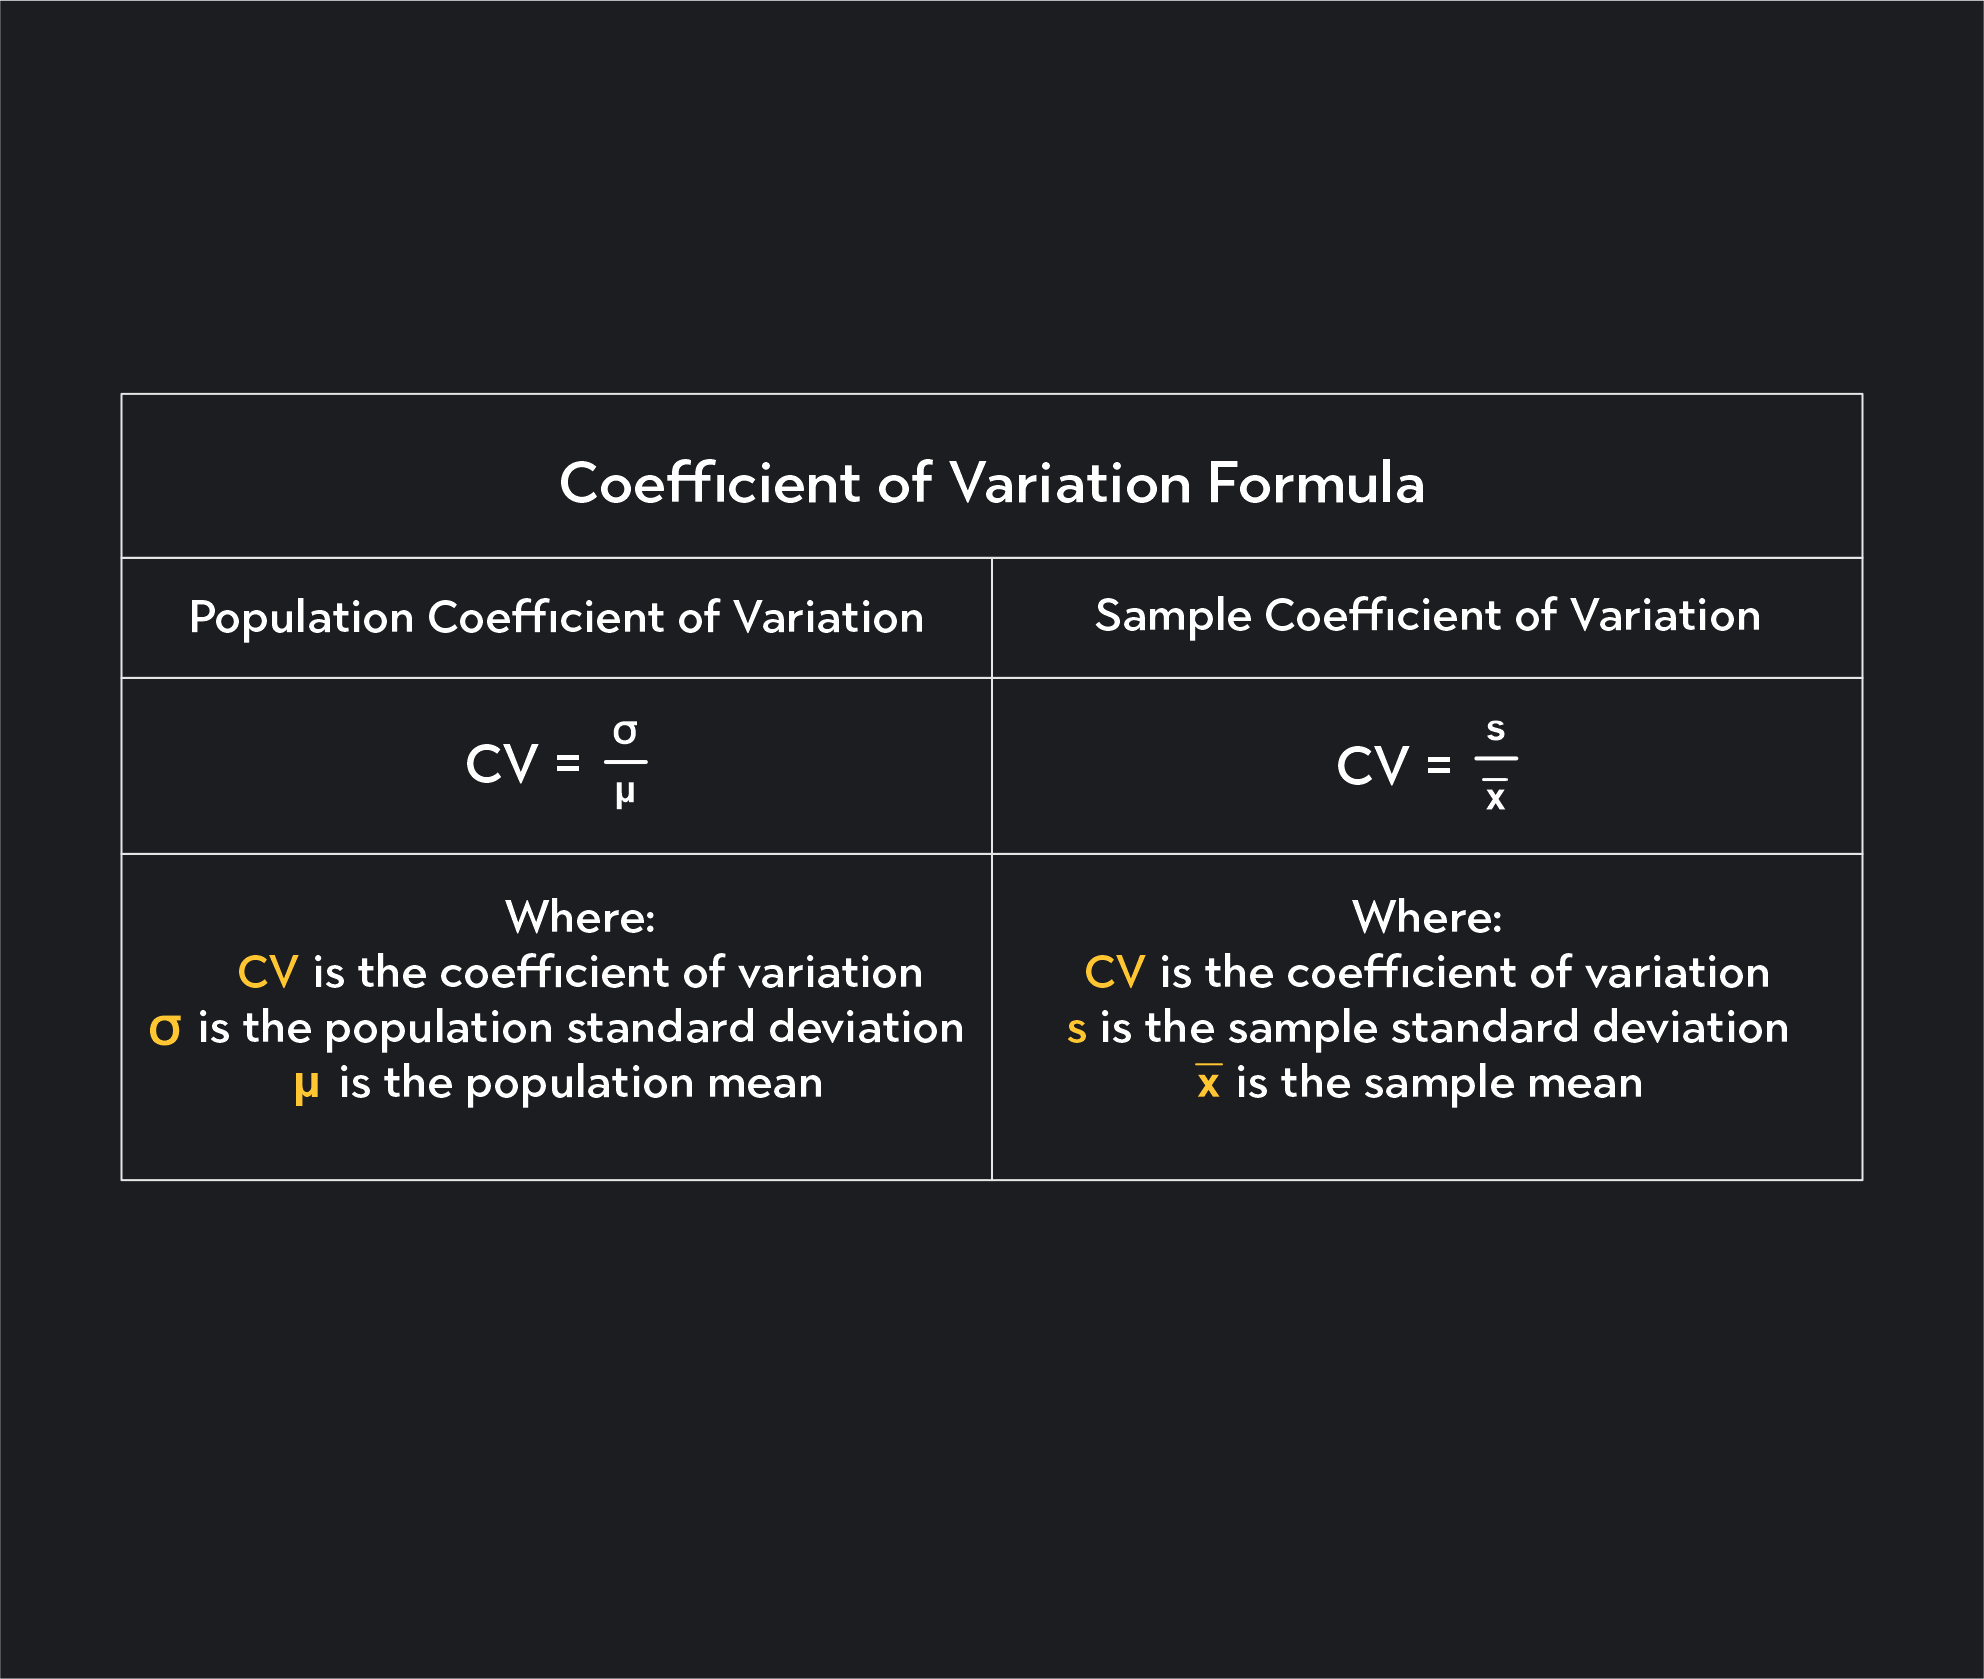
The coefficient of variation (CV)—also called the relative standard deviation (RSD)—is the ratio of the standard deviation to the mean. It is a parameter or statistic used to convey the variability of your data in relation to its mean.
Interpreting the Coefficient of Variation
You can express the coefficient of variation as a decimal or a percentage. To convert the coefficient into a percentage, just multiply the ratio of the standard deviation to the mean by 100.
For example, if the standard deviation of your data is 5 and the mean value is 50, the value of the coefficient of variation is equal to 550=0.10 or 0.10 x 100 = 10%.
Unlike absolute measures of dispersion—such as quartiles, mean absolute deviation, variance, and standard deviation—the coefficient of variation is a relative measure of dispersion. It compares how large the standard deviation is relative to the mean in proportional terms rather than absolute terms.
If you find a coefficient of variation of 0.10 or 10%, the standard deviation is one-tenth or 10% of the mean.
The standard deviation of a data set is the square root of its variance. Both variance and standard deviation are absolute measures of variability. Still, variance measures the dispersion of data in squared units that are hard to interpret. In contrast, the standard deviation converts variance into “standardized,” easy-to-interpret units that are the same as the units used in your data.
Standard deviations are always positive or 0. The larger your standard deviation, the more spread out your data. If the standard deviation is zero, your data has no variation. This means all values in the data set are the same.
How To Calculate Standard Deviation
You can calculate standard deviation in 5 steps:
You calculate the distances between each point in your data and the mean. You do this by subtracting the mean from each data point.
You square each distance found in the previous step.
You sum all the squared distances.
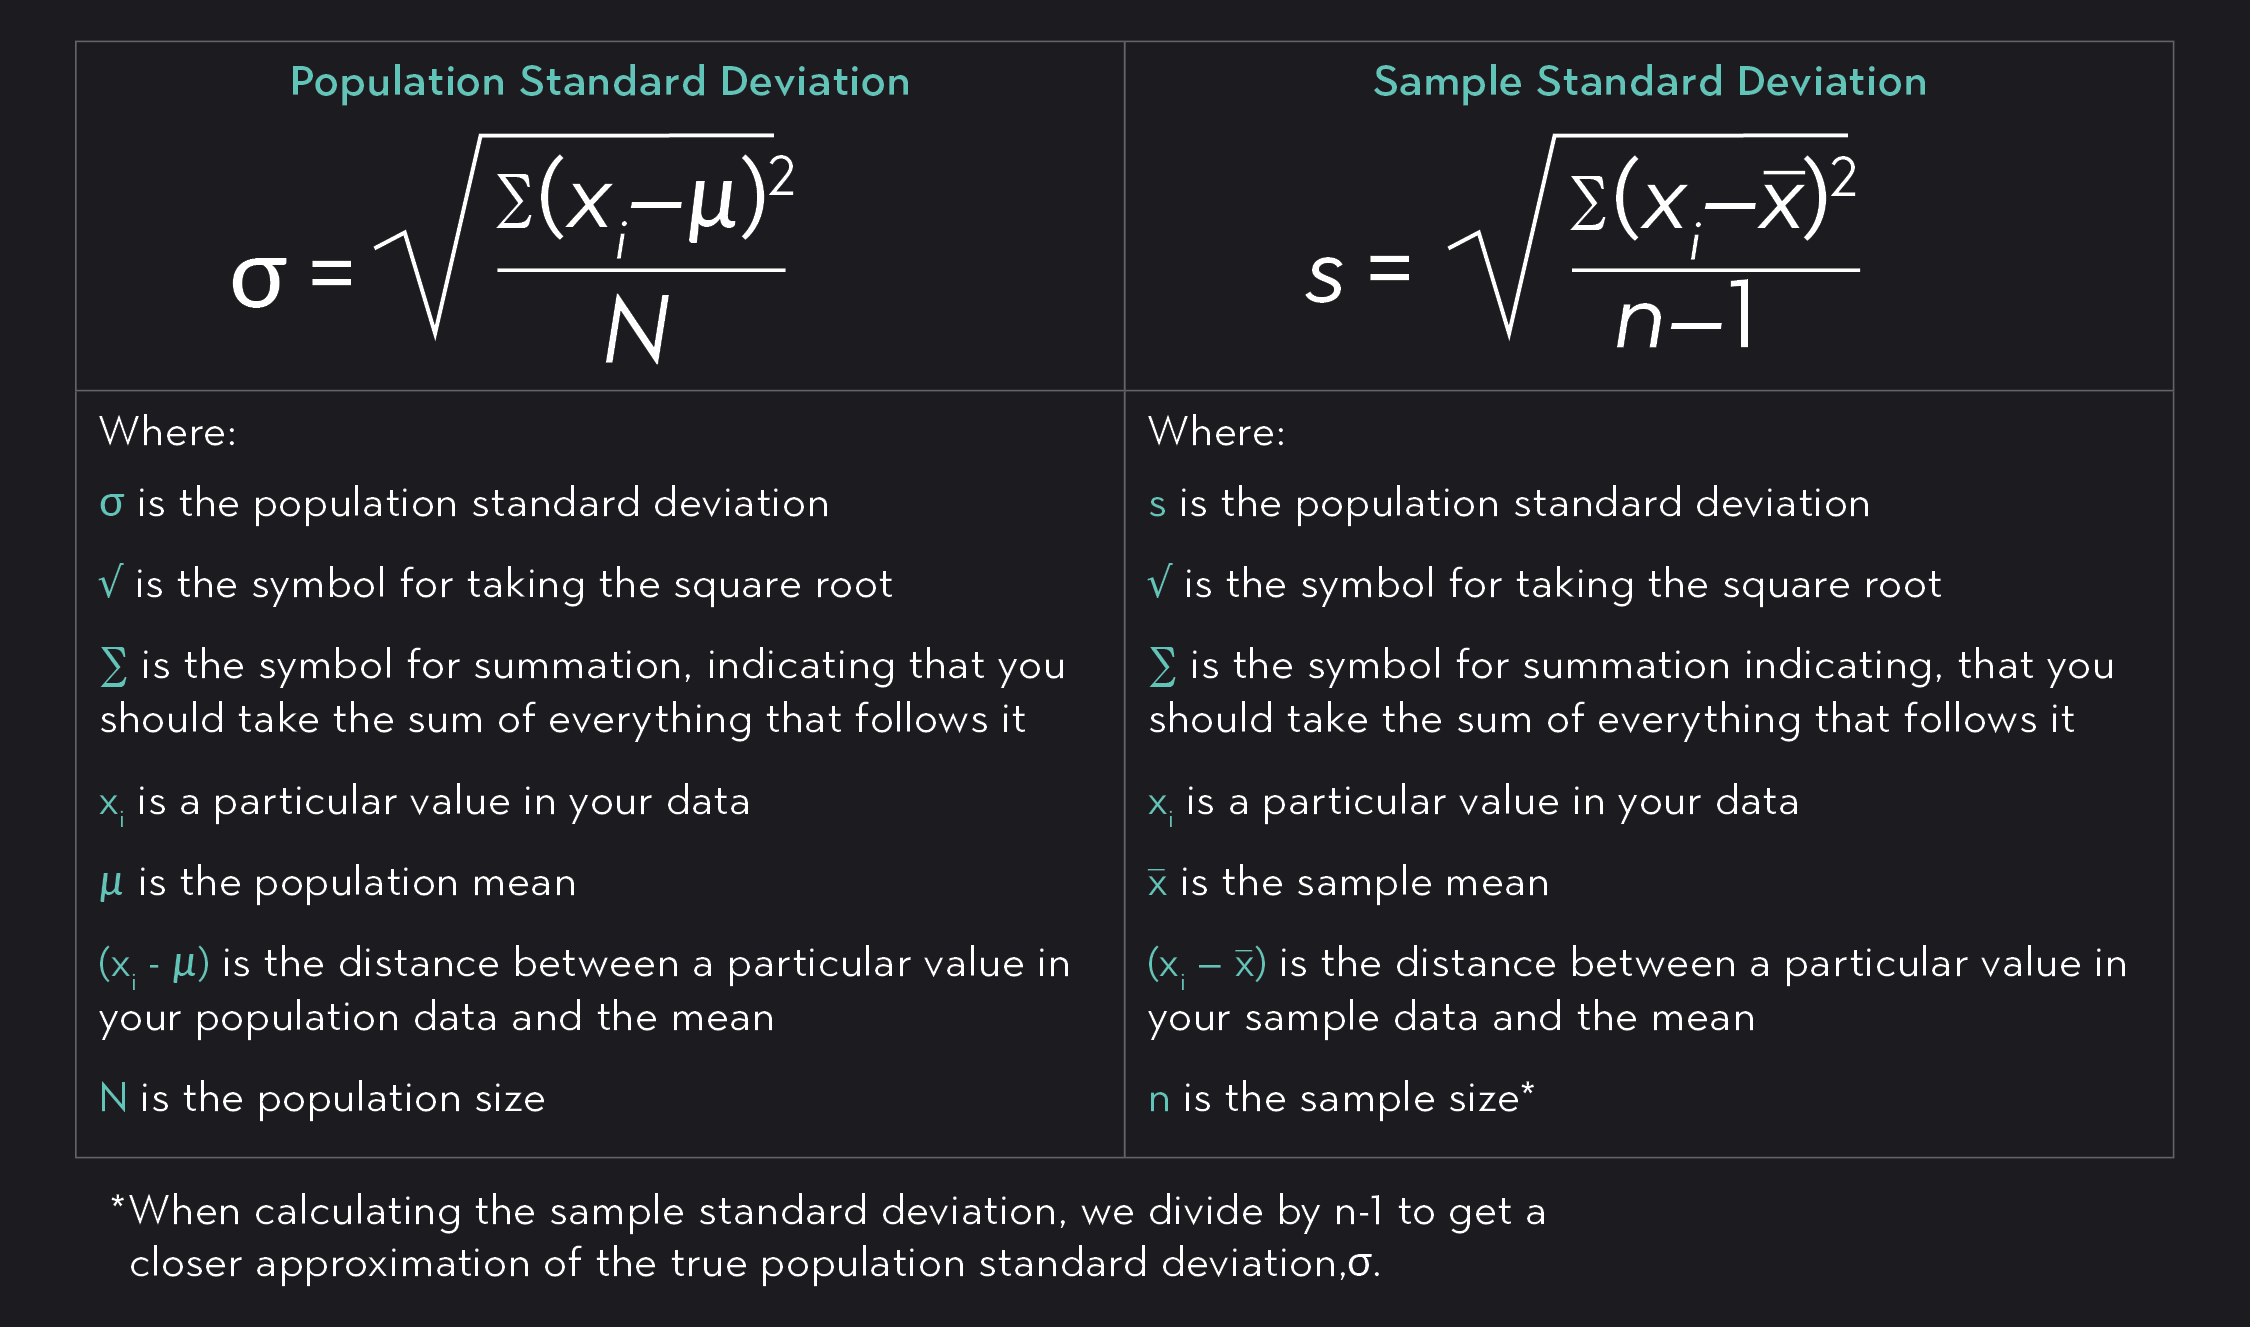
In the case of a population standard deviation, you divide the sum of squared distances by the number of values in your data set (N). In the case of a sample standard deviation, you divide the sum of squared distances by the number of values in your data set minus one (n -1).
Finally, you take the square root of the value you calculated in Step 4.
Coefficient of Variation Examples
Now that you know what the coefficient of variation and standard deviation are, let’s work through two examples of calculating the CV.
Sample Data A
2, 4, 6, 8, 10
In this example:
The sample mean is 6
The standard deviation is 3.16
The coefficient of variation is 0.53 (rounded to the nearest hundredth) or 53%.
Remember, this sample data set has 5 numbers, so n=5.
Mean(xˉ)=52+4+6+8+10=6
Standard Deviation(s)=n−1∑(xi−xˉ)2=3.16
Coefficient of Variation(CV)=xˉs=53.16=0.53=53%
Example 2
Here is another sample data set. See if you can calculate the coefficient of variation without looking at the answer. This data set only has three values, so n=3.
Sample Data Set B
90, 100, 110
Answer: s=10, xˉ=100, CV=0.10
Major Advantages and Disadvantages of CV
Advantages of Coefficient of Variation
The main reason we use the coefficient of variation is that it is dimensionless.
A dimensionless quantity is a number without any units. For example, if you have data for temperatures measured in Fahrenheit, both the mean and standard deviation of the data will be measured in Fahrenheit.
However, when you calculate the coefficient of variation (xˉs), the units disappear, and the resulting coefficient is dimensionless.
As a dimensionless quantity, the coefficient of variation offers two main advantages.
You can compare dispersion in data sets with drastically different means
You can compare dispersion of data sets measured in different units
As an example, consider the hypothetical data below. The data on the left shows how the price of a carton of milk varied in a U.S. grocery store over the course of a year. The prices are measured in U.S. dollars. The data on the right shows how the price of a carton of milk varied in a Japanese grocery store over the course of a year. The data is measured in Japanese yen.
PRICE OF CARTON OF MILK IN THE U.S.
PRICE OF CARTON OF MILK IN JAPAN
[ $0.75, $0.90, $1.50, $2.20, $4.10 ]
[¥178, ¥198, ¥205, ¥210, ¥220 ]
Mean (xˉ) - wumbo.net = $1.89
Mean (xˉ) = ¥202.20
Standard Deviation (s) = $1.36
Standard Deviation (s) = ¥15.72
Coefficient of Variation (CV) = 0.72
Coefficient of Variation (CV) = 0.08
If you want to compare the variation in prices in the U.S. grocery store and the Japanese store, you cannot simply compare standard deviations since they are measured in different units—yen and U.S. dollars.
You could convert the Japanese prices into dollars, but that would be more work than simply calculating the coefficient of variation. When we compare the coefficient of variation for two data sets, we see that the coefficient of 0.08 is much smaller than the coefficient of variation for the U.S. data, 0.72. This tells you that the prices varied more in the U.S. grocery store than in the Japanese grocery store.
Disadvantages of Coefficient of Variation
The coefficient of variation has three main disadvantages.
You can only use it for data measured on a ratio scale; you cannot use it for data measured on an interval scale.
For data with a mean close to zero, the coefficient of variation will approach infinity.
You cannot use it to construct confidence intervals for the mean.
Common Applications for the Coefficient of Variation
The coefficient of variation is used in many fields.
Here are some examples:
In analytical chemistry, researchers use the CV to express the precision and repeatability of an assay.
In applied probability, the CV is used in areas such as renewal theory, queuing theory, and reliability theory.
Archaeologists use the CV to compare the standardization of ancient artifacts.
Economists use the CV as a way of measuring economic inequality.
Engineers use the CV in quality assurance studies.
Financial analysts and investors use the CV to calculate risk-reward ratios and to determine whether the expected return makes up for the volatility of an investment.
Neuroscientists utilize the CV when studying brain activity.
How To Calculate CV in Excel, Google Sheets, and R
In Excel and Google Sheets, you can calculate the coefficient of variation by first using the functions for mean and standard deviation. These are =AVG(), and =STDEV(). The range of cells containing your data should be selected and placed within the parentheses of each function. Once you have the mean and standard deviation, simply divide the standard deviation by the mean.
In R, create a vector containing your data and give it a name like “data.” Then use the command cv(data, na.rm = FALSE) to calculate the coefficient of variation.
Outlier (from the co-founder of MasterClass) has brought together some of the world's best instructors, game designers, and filmmakers to create the future of online college.