
Statistics
Understanding Variables in Statistics: Types & Examples
Learn the different types of variables in statistics, how they are categorized, their main differences, as well as several examples.
Sarah Thomas
Subject Matter Expert

Statistics
03.26.2023 • 5 min read
Subject Matter Expert
Learn what quartiles are and how they work in statistics. Understand how to calculate them and why even learn them.
In This Article
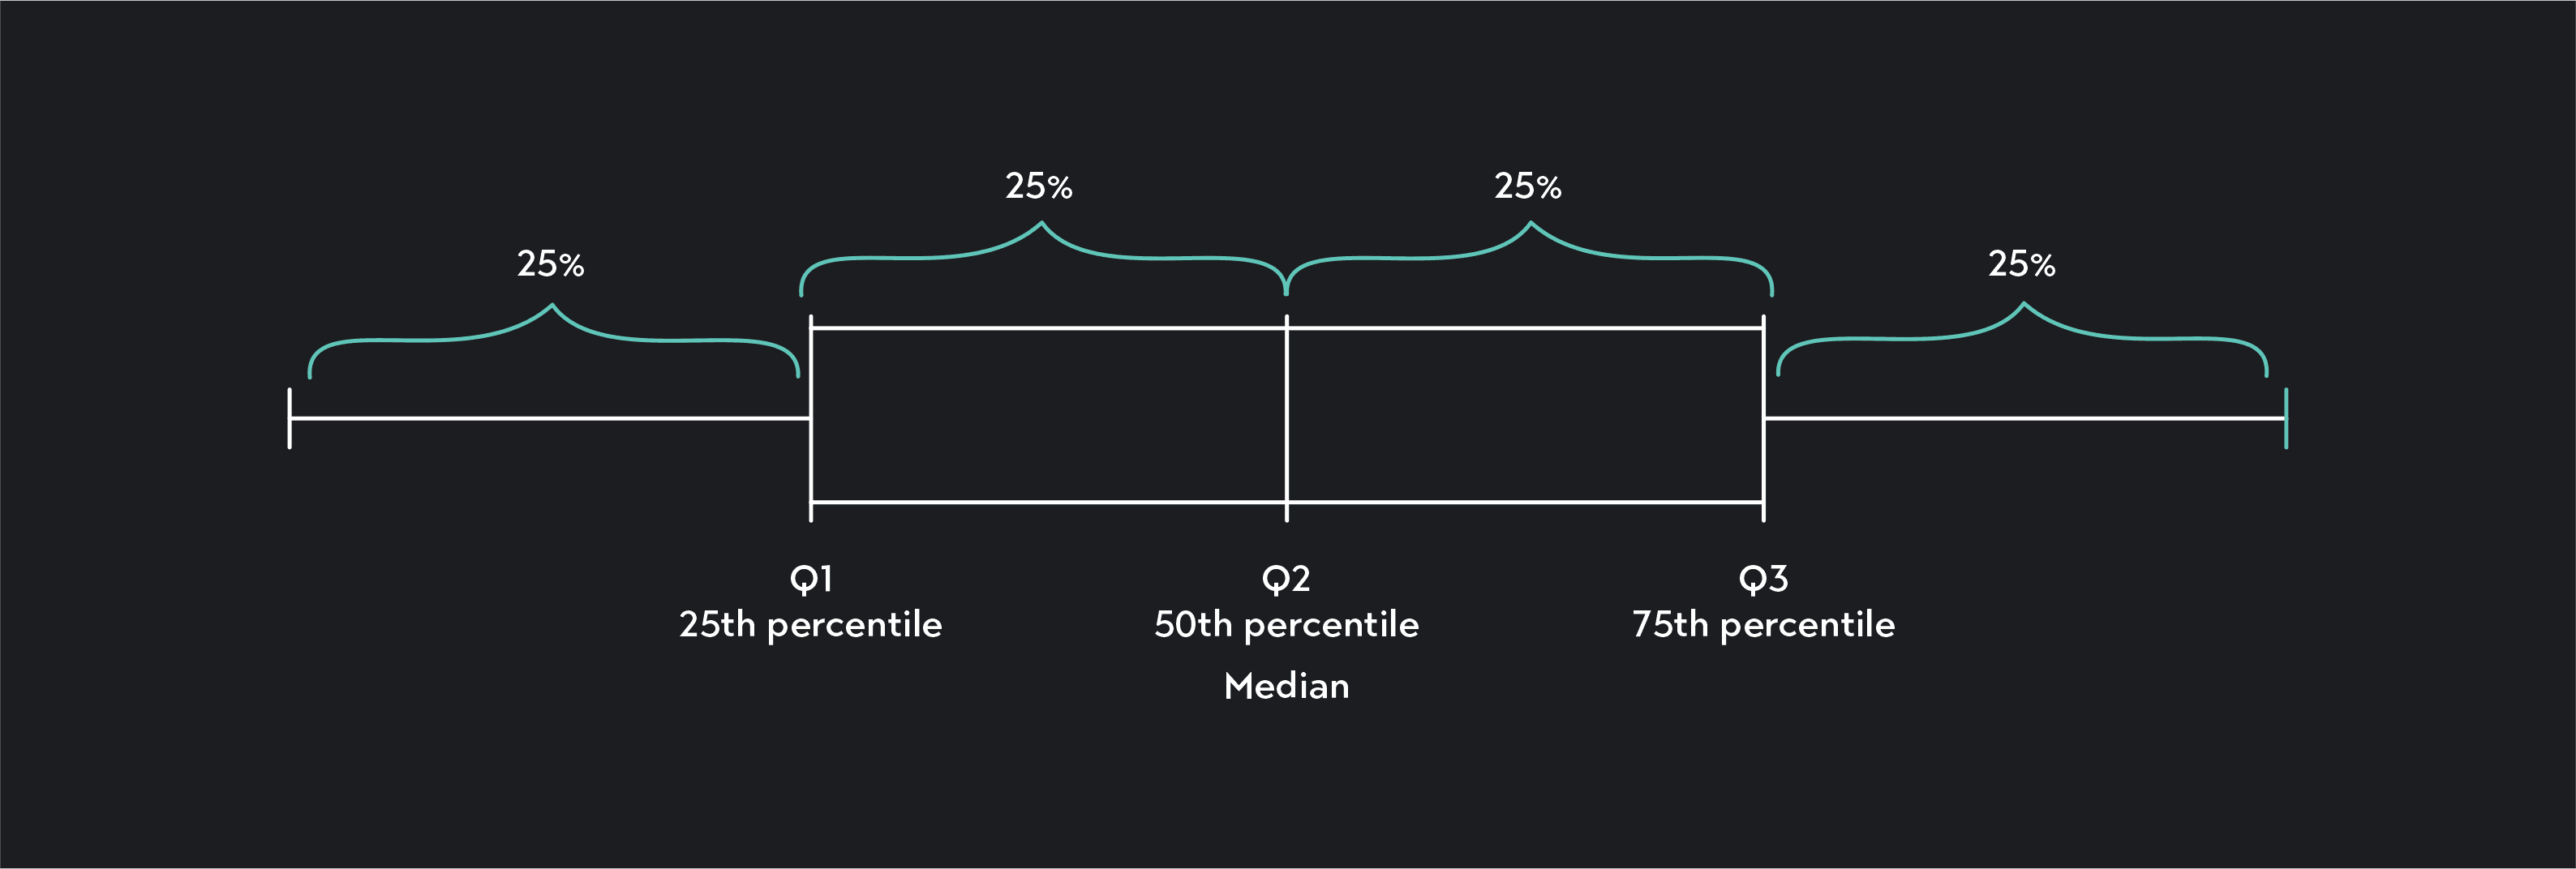
In statistics, quartiles divide your data into four equal groups, each containing 25% (or a quarter) of your data points.
3 quartiles exist:
The first quartile—also called the lower quartile or Q1—marks the 25th percentile of a data set. It divides the bottom quarter of your data from the second quarter.
The second quartile—also called the median or Q2—marks the 50th percentile of the data set. It divides the second quarter of your data from the third quarter. It also divides your data into two equal groups: the bottom 50 percent and the top 50 percent.
The third quartile—also called the upper quartile or Q3—marks the 75th percentile of the data set. It divides the third quarter of your data points from the top quarter.
Quartiles are a type of quantile—a set of values that divide data into equal groups, each containing approximately the same number of observations.
Whenever you use quantiles, you arrange your data from smallest to largest, and the quantiles act as markers or cutoff points between each group.
Other commonly used quantiles include:
Percentiles divide data into 100 groups, each containing 1% of your observations.
Deciles divide data into 10 groups, each containing 10% of your observations.
Quintiles divide data into 5 groups, each containing 20% of your observations.
Quartiles are useful because they provide a quick and easy way to summarize the spread and skewness of your data.
Once you know what your quartiles are, you can use them to contextualize other data points. For example, say you have data where Q1 is equal to 300, Q2 is equal to 500, and Q3 is 900. You can now take any data point, say 450, and know that it’s located between the 25th percentile and the median.
You can also use quartiles to construct the following related measures of location:
The five-number summary is a list of the three quartiles and the minimum and maximum of your data.
The interquartile range is the difference between the upper and lower quartiles (Q3-Q1). The IQR measures the dispersion of the middle 50 percent of your data.
You can also use quartiles and the interquartile range to identify outliers in your data. The outlier formula describes any value greater than Q3 + (1.5 x IQR) and any value less than Q1 - (1.5 x IQR) as an outlier.
To calculate quartiles by hand, follow these steps.
Count the number of data points and arrange them from smallest to largest. Arrange the data in ascending order and find the total number of values in your data.
To find Q1, multiply n by 25/100 (or ¼). This will give you a locator value, .
If is a whole number, take the average of the value of the data set and the value. This average will be the first quartile.
If is not a whole number, round up to the nearest whole number and find the corresponding value in the data set. This will be the first quartile.
To find Q2, use the same method used to find Q1, except this time, multiply by 50/100 (or ½) to get the locator value, .
To find Q3, use the same method used to find Q1, except this time, multiply by 75/100 (¾) to get the locator value, .
Another way of calculating quartiles by hand is by first identifying the median of the data. Here are the step-by-step instructions for calculating quartiles using the median method.
To find the median (or Q2), arrange your data in ascending order. If the number of data points you have is odd, the median will be the middle value of your data. If you have an even number of data points, the median will be the average of the two middle numbers in your data.
The median divides your set of data into two equal parts: a lower half and an upper half. You can calculate the first quartile (Q1), by finding the median of the lower half of the data.
You can calculate the upper quartile (Q3) by finding the median of the upper half of your data.
To calculate quartiles in Excel or Google Sheets, use the QUARTILE() function. Because we can use different methods for calculating quartiles, the results you get from calculating quartiles in Excel or Google Sheets may be slightly different than the results you get when calculating quartiles by hand.
Suppose your data is in cells A1 through A20. To find Q1, type: =QUARTILE(A1:A20, 1)
To find Q2, use the same function, only this time, type a 2 before the closing parenthesis. Type =QUARTILE(A1:A20,2)
To find Q3, use the same function, but type a 3 before the closing parenthesis. Type =QUARTILE(A1:A20,3)
To calculate quartiles in R, use the QUANTILE() function.
Suppose you have your data stored in a variable called . You can find the three quartiles by typing: QUANTILE(x, probs = (0.25, 0.5, 0.75)).
You can also use the quantile function to find percentiles, deciles, and quintiles.
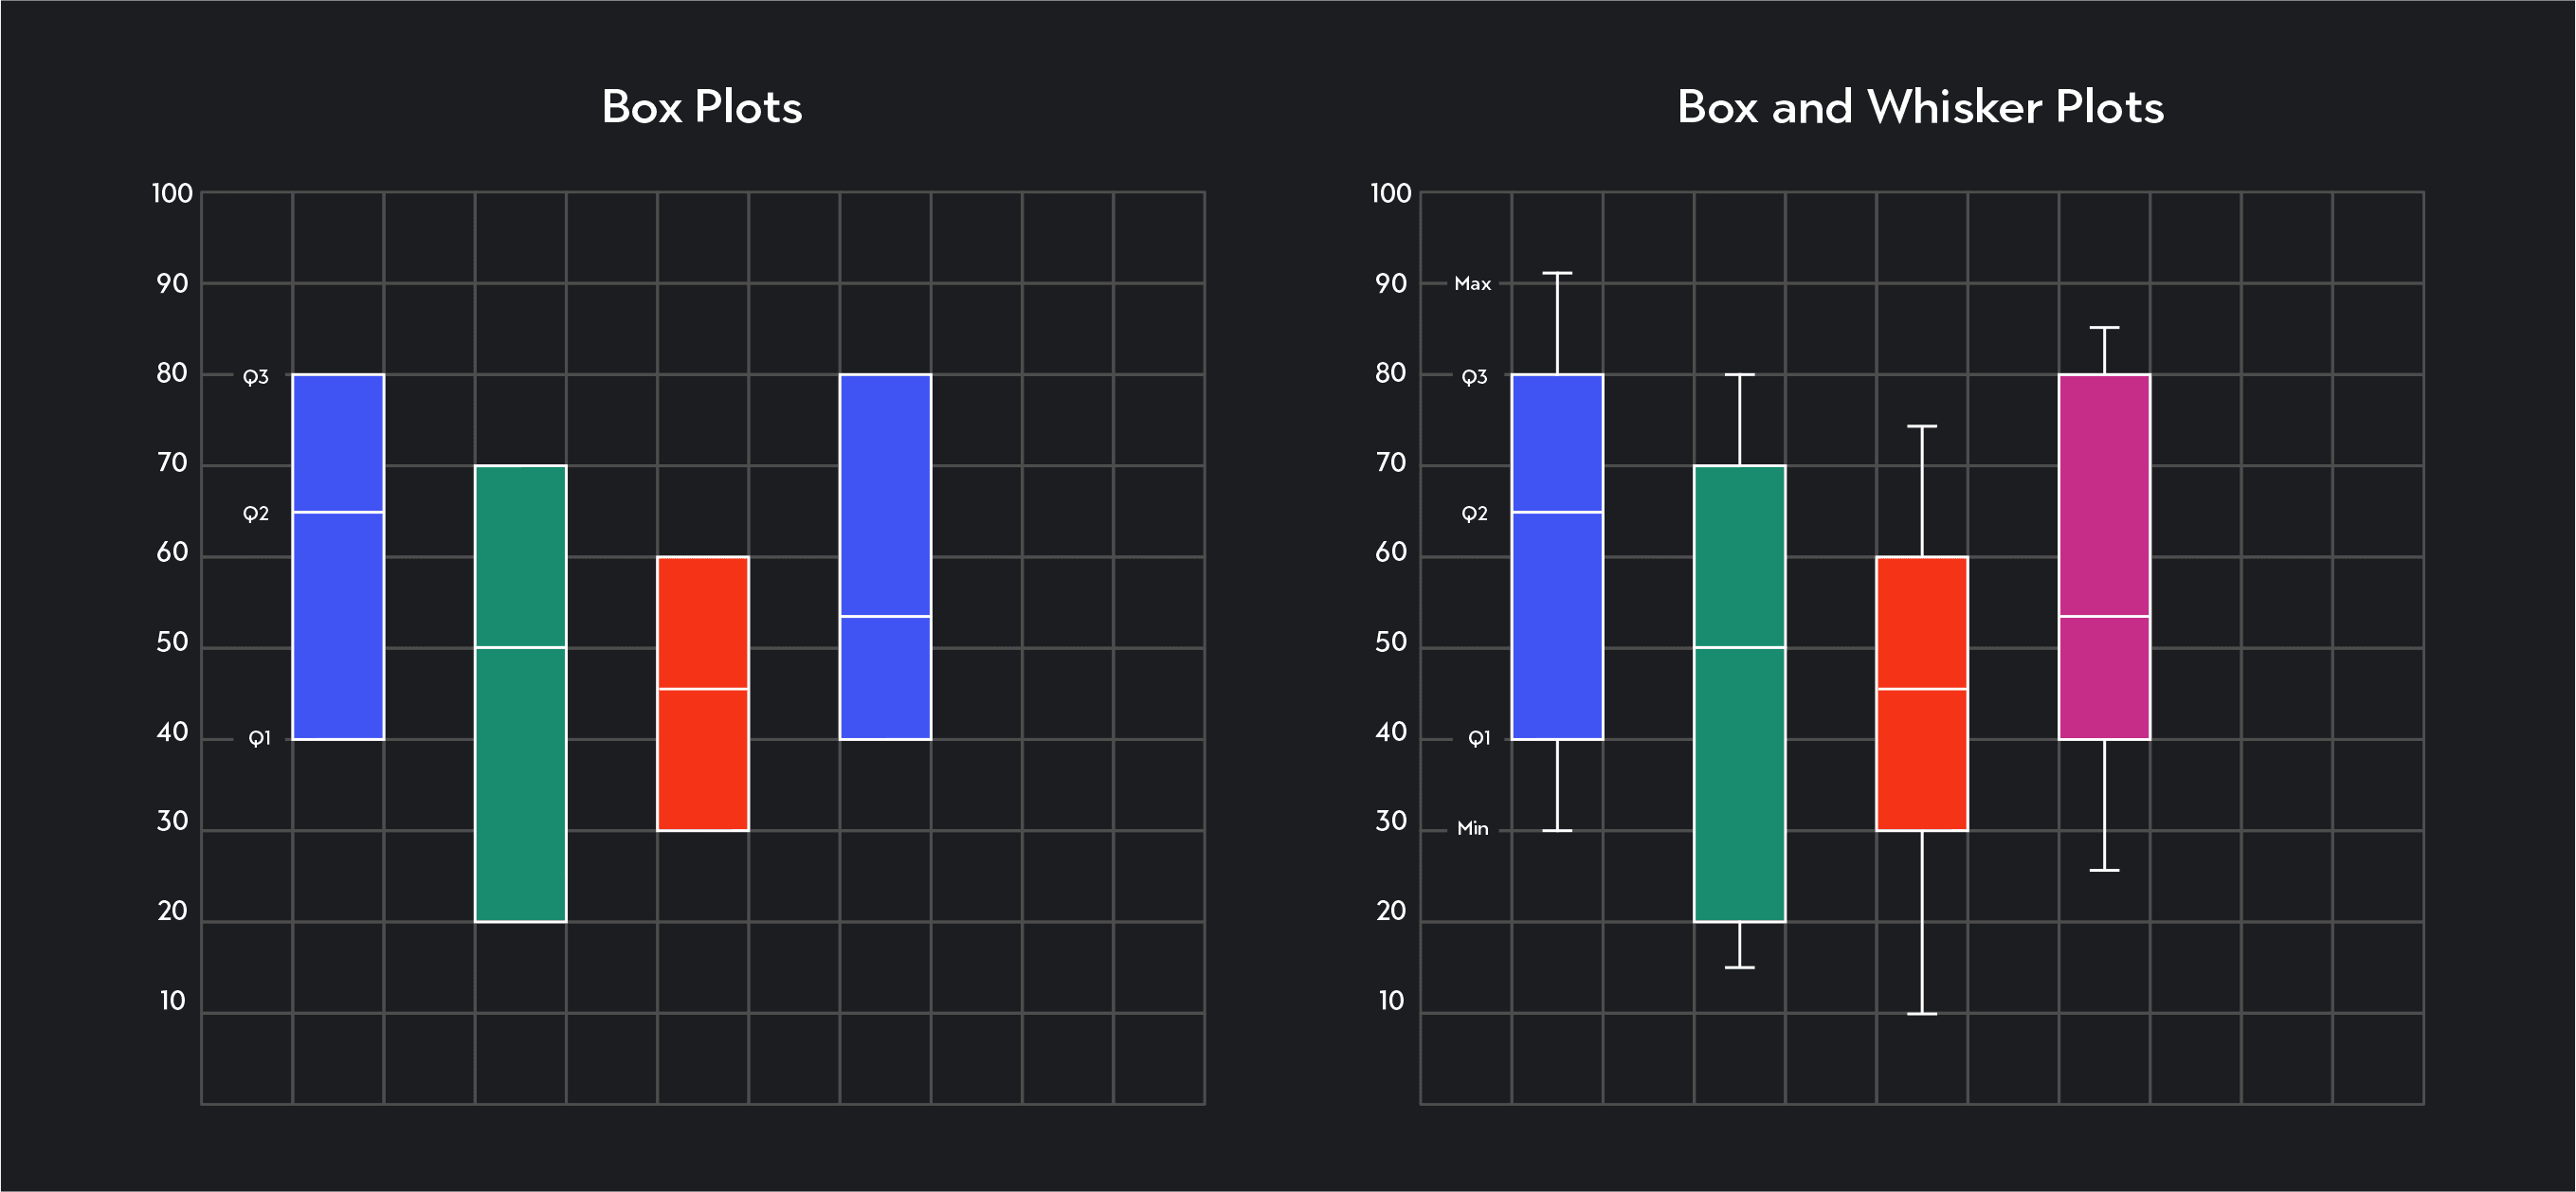
Quartiles are listed as a set of numbers or shown visually using a box plot or a box and whisker plot.
A box plot is a graph in the shape of a rectangle. The two shorter sides of the rectangle mark the lower and upper quartiles, and a line in the middle of the rectangle marks the median (Q2).
A box plot with two lines stretching out from either end of the rectangle is called a box and whisker plot. In addition to the three quartiles, a box and whisker plot marks the minimum and the maximum of your data.
Whether you are looking at a list of quartiles, a boxplot, or a box and whisker plot, always remember what each quartile represents.
Q1 marks the 25th percentile of your data and divides the bottom quarter of your data from the second quarter.
Q2 marks the 50th percentile (the median) of your data and divides the second quarter of your data from the third quarter.
Q3 marks the 75th percentile of your data and divides the third quarter of your data points from the top quarter.
Subtracting Q3 from Q1 will give you the interquartile range (IQR). The IQR tells you how dispersed the middle 50 percent of your data is.
Here are two examples of quartiles calculated for different data sets. Notice that in each of these examples, we have already arranged the data in ascending order.
*Answer will depend on what method you use
*Answer will depend on what method you use
Outlier (from the co-founder of MasterClass) has brought together some of the world's best instructors, game designers, and filmmakers to create the future of online college.
Check out these related courses:


Statistics
Learn the different types of variables in statistics, how they are categorized, their main differences, as well as several examples.
Subject Matter Expert

Statistics
Learn what is standard error in statistics. This overview explains the definition, the process, the difference with standard deviation, and includes examples.
Subject Matter Expert

Statistics
Learn what statistical analysis is and why it’s important. We’ll list the most used types and examples and go over how to do statistical analysis.
Subject Matter Expert