Statistics
What Is Statistical Analysis?
Learn what statistical analysis is and why it’s important. We’ll list the most used types and examples and go over how to do statistical analysis.
Sarah Thomas
Subject Matter Expert

Statistics
03.15.2023 • 5 min read
Subject Matter Expert
Learn the different types of variables in statistics, how they are categorized, their main differences, as well as several examples.
In This Article
In statistics, a variable is a symbol representing a mathematical object whose value can vary.
For example, if you're curious about the age of people in a certain population, you could assign the variable X to represent those ages. You might also be curious about the political affiliation of your population.
In this case, you could assign another variable—such as the letter Y—to represent political affiliation, where the values might be “Republican,” “Democrat,” or “Independent.”
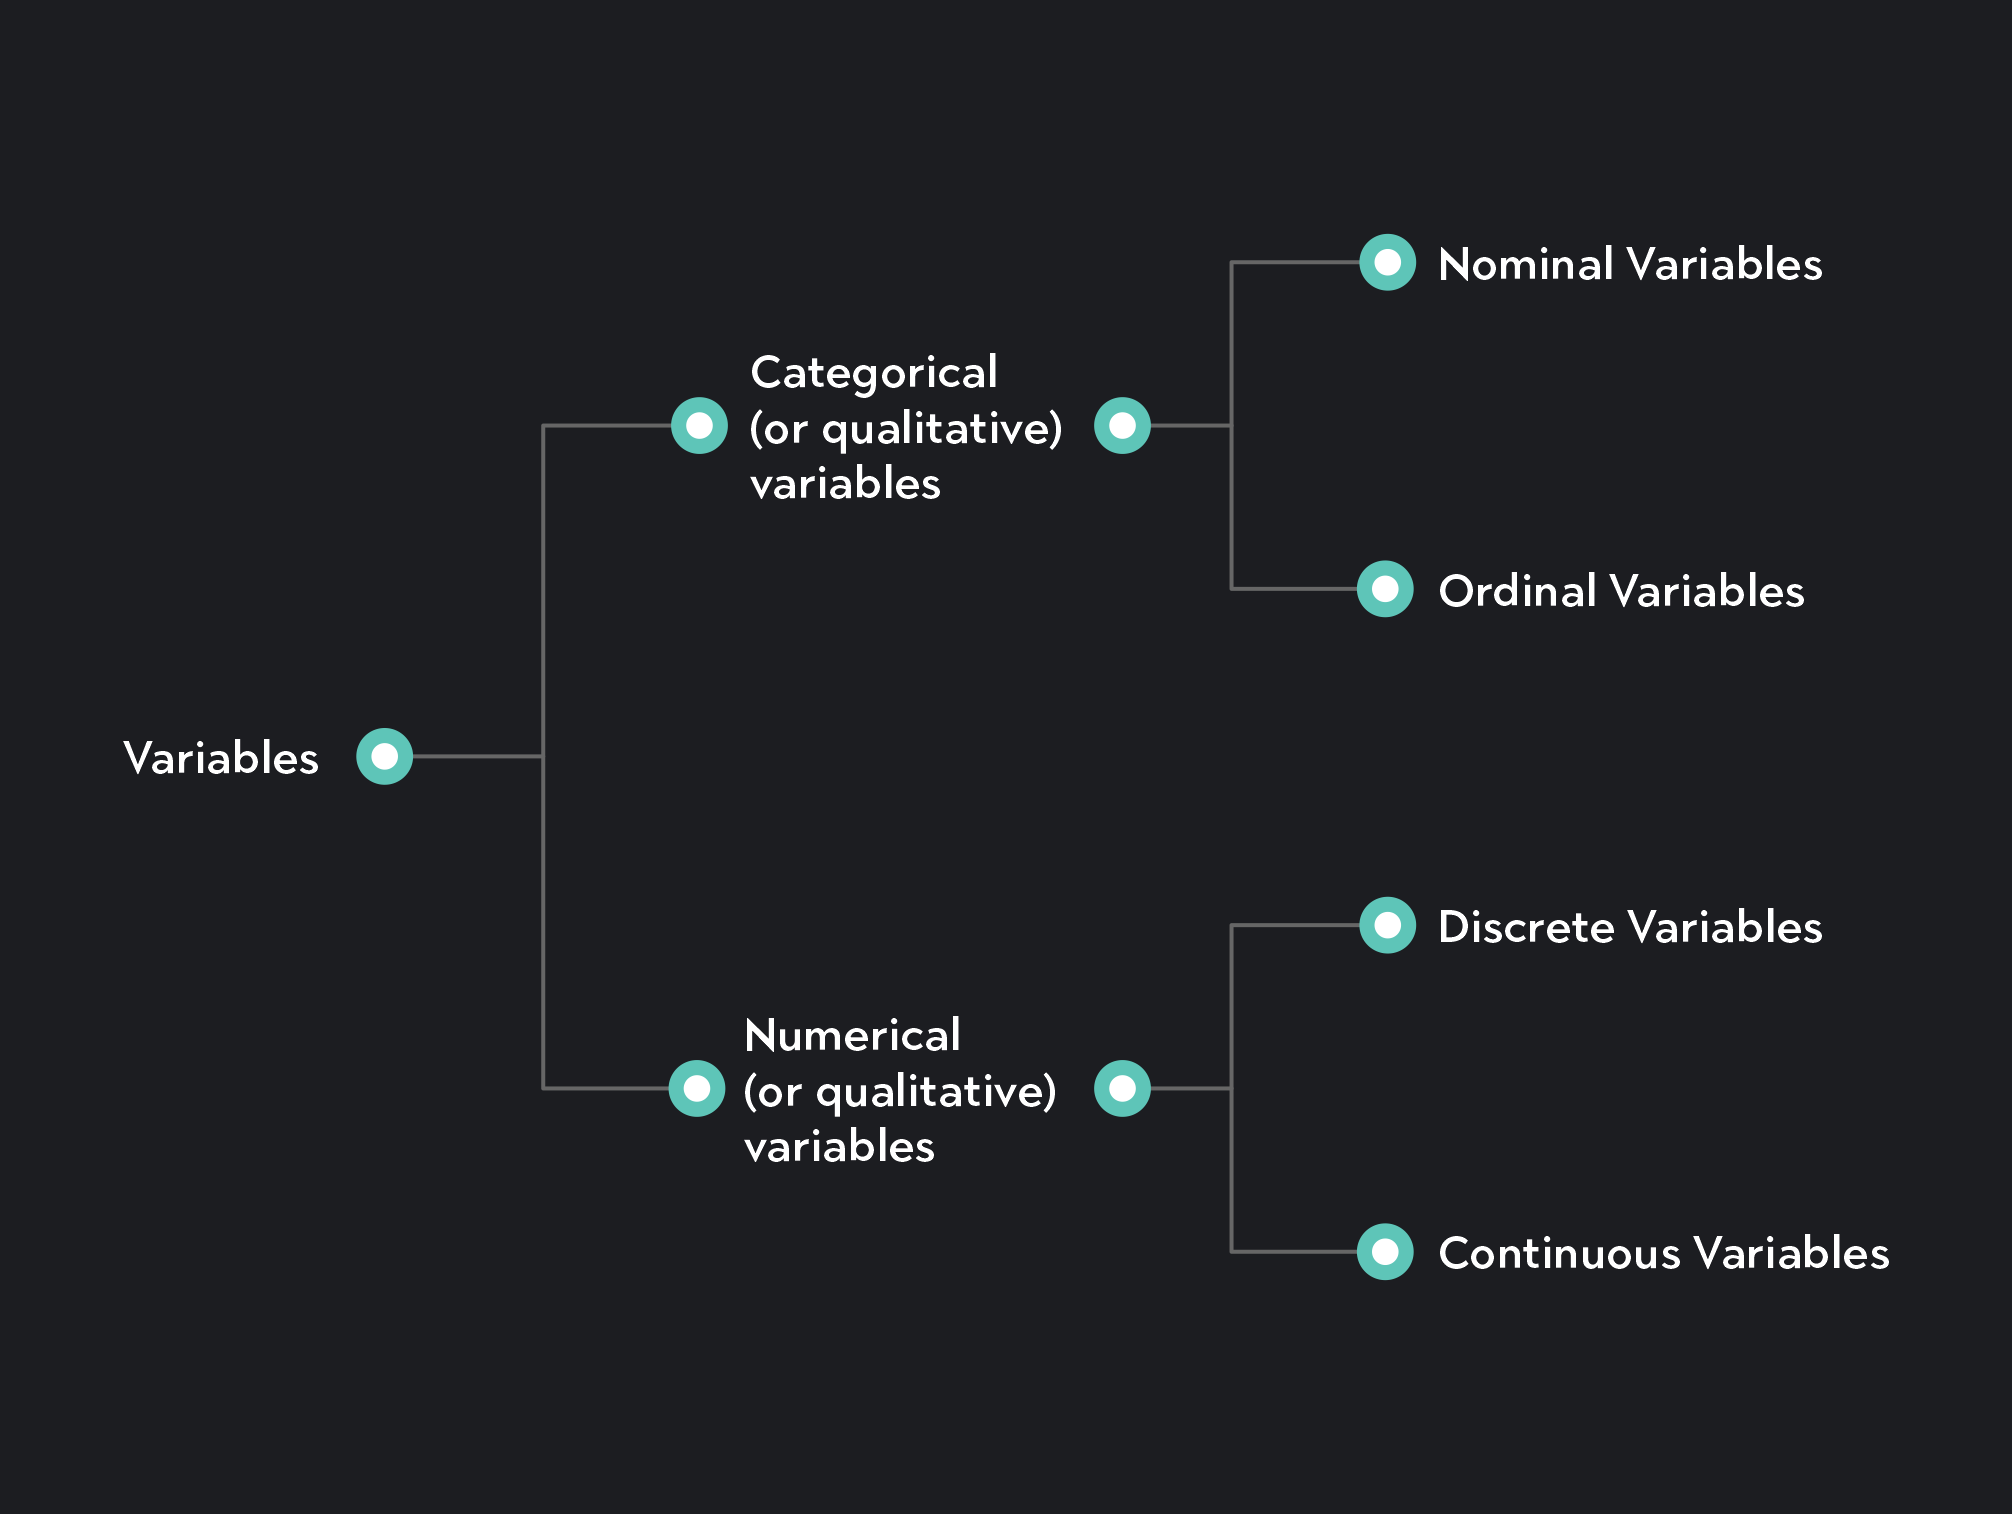
Variables fall into one of two categories:
Categorical variables represent names, qualities, and other labels, which divide your data set into groups or classes. You can further classify categorical variables as nominal or ordinal.
Numeric variables represent countable or measurable quantities. You can further classify numeric variables as discrete or continuous.

Let’s take a closer look at the different types of variables.
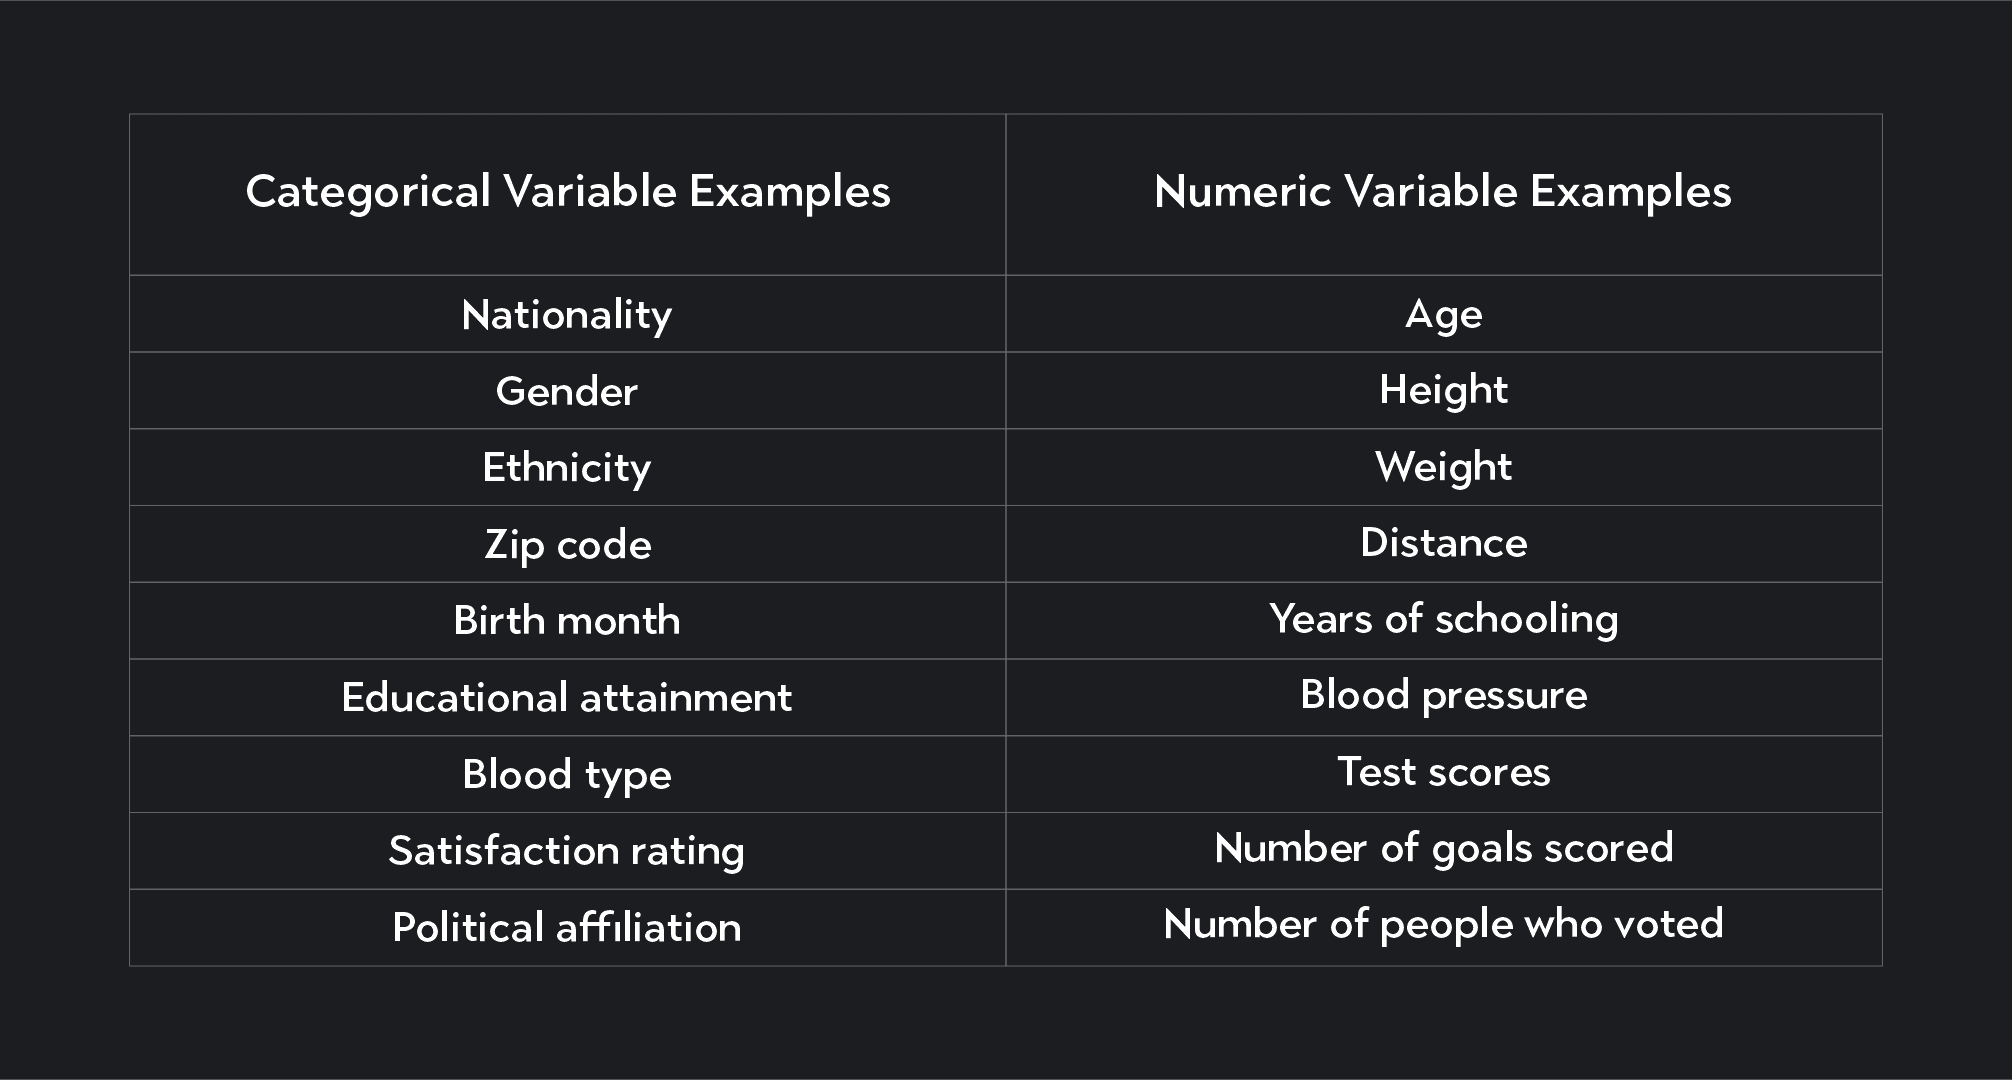
Again, categorical variables represent qualities and labels that divide your data set into different categories. When you select your nationality or race on a survey, your response is stored as a categorical variable.
You can classify categorical variables as nominal or ordinal.
A nominal variable is a categorical variable with no order or ranking based on magnitude or size. Nationality, for example, is a nominal variable, as is blood type.
Ordinal variables are categorical variables where the groups being defined do have a rank or order based on size or magnitude.
For example, if Starbucks asks their customers what size drink they typically order—short, tall, grande, or venti—the variable “drink size” is an ordinal variable. The categories it defines have an order based on size.
Similarly, another example of an ordinal variable is a satisfaction rating asking respondents to judge how likely they are to buy a product—extremely unlikely, unlikely, not sure, likely, very likely.
Numeric variables are countable or measurable quantities. We can divide them into discrete and continuous variables.
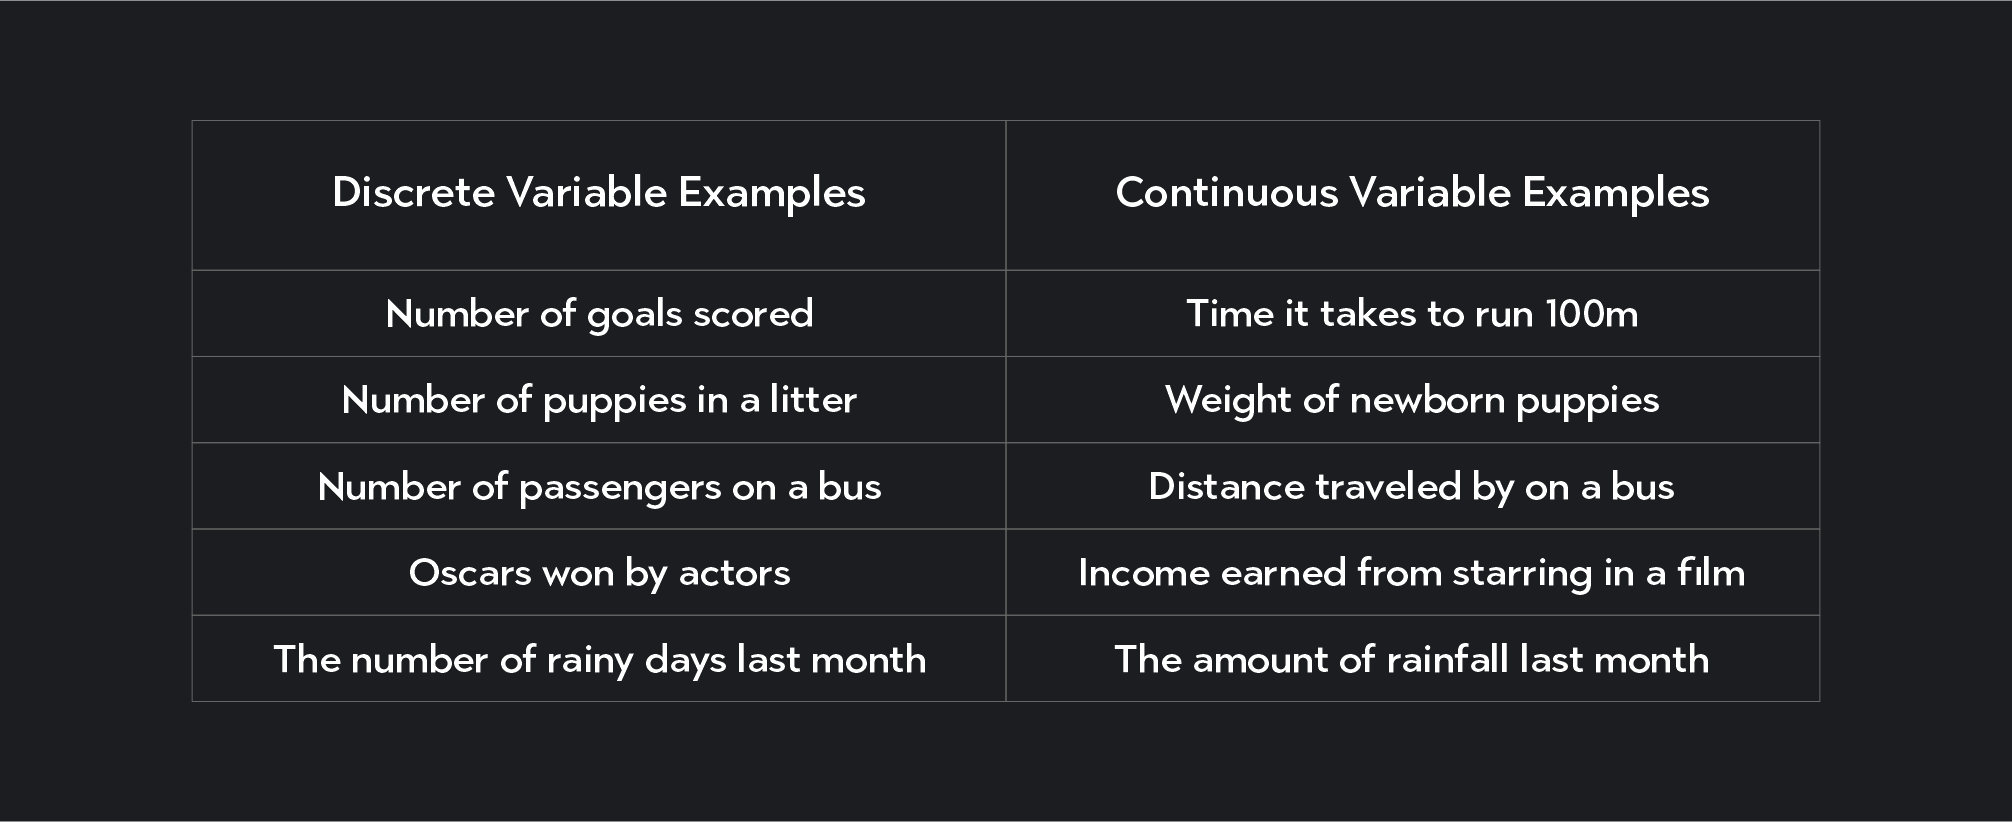
Discrete variables are numeric variables that take on distinct, countable values. Discrete variables only take on integer values (whole numbers). The number of customers who enter a Starbucks each hour is an example of a discrete numeric variable. You can count the number of people who walk into the store, and the number will not be fractional. Another example is the number of touchdowns a football team scores in a season. Again, such a variable takes on whole countable values.
Continuous variables are numeric variables that take on any value within a range, where the number of possible values the variable can take is infinite. Continuous variables can take on fractional values and typically require a measuring device, such as a measuring tape or a stopwatch, to measure them.
Weights, distances, and heights are all examples of continuous variables. For example, the weights of NBA players are typically between 160 and 350 pounds, but within this range, you could have weights taking on an infinite number of values—163.239 lbs, 189.8 lbs, etc.
A key difference exists between categorical and numeric variables. Categorical variables represent categories or labels and divide your data into groups, while numeric variables represent counts or measures.
Be careful! The distinction between categorical and numeric variables is not that one takes on numbers while the other does not.
It’s possible for categorical variables to take on numerical values. For example, consider a variable like zip code or birth month. Both of these variables can be a number, but the number represents categorical data, not numerical data.

Discrete and continuous variables are both types of numeric variables. The main distinction between them is discrete variables are countable whole numbers, while continuous variables are measured and can take on an infinite number of values within a range.
Keep in mind certain cases exist where we treat continuous variables as discrete variables. Age is a good example. Technically, age is a continuous variable. A person can be 11.0002 years old, 23.92305 years old, or infinite possibilities on a continuous scale. However, we are usually only interested in people's age measured in years, and so we treat age as a discrete variable.

In addition to the categories we’ve discussed, you may hear the following terminology when working with variables in statistics.
In a statistical study, a dependent variable—also called an outcome variable—is a variable whose value depends on the values of other variables in your model.
The dependent variable is the variable whose value you are trying to explain. For example, in medical research, a statistician might want to study the effect of various treatments on a patient's health. The patient’s health, in this case, is the dependent variable.
In contrast, an independent variable—also called an explanatory variable or predictor variable—is a variable whose value does not depend on the value of other variables in the model.
The independent variables in the model are the variables you manipulate to see if they help explain or alter the value of the dependent variable. In a causal study, an independent variable is the proposed cause, and the dependent variable is the effect.
Confounding variables have the potential to invalidate your results since they:
Correlate with at least one of the independent variables in your study.
Help to explain the dependent variable in your study.
If they are not properly accounted for, they can lead to misleading and false results.
A control variable is a variable you hold constant in a statistical study. For example, say you study the relationship between a fitness regime and weight loss. Diet, in this case, might be a control variable in your experiment.
A binary variable is a categorical variable with only two possible values. For example, true or false, heads or tails, win or lose.
In regression analysis, a dummy variable is a binary variable that will either be 0 or 1. Dummy variables indicate whether a condition in your data is either present or absent. For example, you could use 1 to show whether a patient received a treatment and 0 to mean they did not receive the treatment.
Intervening variables—or mediators—sit between an independent and a dependent variable and help explain how the independent variable influences the dependent variable. These variables are not always included in your statistical analysis because they are hard to observe. Statisticians often just hypothesize about them.
A moderator is a variable that impacts the relationship between an independent and a dependent variable. For example, if you are studying the relationship between going to college—an independent variable—and future earnings—a dependent variable—“college major” might be a moderating variable between these two variables. It likely influences the relationship between a college education and earnings.
Outlier (from the co-founder of MasterClass) has brought together some of the world's best instructors, game designers, and filmmakers to create the future of online college.
Check out these related courses:

Statistics
Learn what statistical analysis is and why it’s important. We’ll list the most used types and examples and go over how to do statistical analysis.
Subject Matter Expert

Statistics
Learn how to find critical value, its importance, the different systems, and the steps to follow when calculating it.
Subject Matter Expert

Statistics
This article explains what subsets are in statistics and why they are important. You’ll learn about different types of subsets with formulas and examples for each.
Subject Matter Expert