
Statistics
Binomial Distribution: Meaning & Formula
Learn what binomial distribution is in probability. Read a list of the criteria that must be present to apply the formula and learn how to calculate it.
Sarah Thomas
Subject Matter Expert

Statistics
10.28.2022 • 13 min read
Subject Matter Expert
Learn how to find critical value, its importance, the different systems, and the steps to follow when calculating it.
In This Article
Take Intro to Statistics Online with Outlier.org
From the co-founder of MasterClass, earn transferable college credits from the University of Pittsburgh (a top 50 global school). The world's best online college courses for 50% less than a traditional college.
Get started
In baseball, an ump cries “foul ball” any time a batter hits the ball into foul territory. In statistics, we have something similar to a foul zone. It’s called a rejection region. While foul lines, poles, and the stadium fence mark off the foul territory in baseball, in statistics numbers called critical values mark off rejection regions.
A critical value is a number that defines the rejection region of a hypothesis test. Critical values vary depending on the type of hypothesis test you run and the type of data you are working with.
In a hypothesis test called a two-tailed Z-test with a 95% confidence level, the critical values are 1.96 and -1.96. In this test, if the statistician’s results are greater than 1.96 or less than -1.96. We reject the null hypothesis in favor of the alternative hypothesis.
In Outlier's Intro to Statistics course, Dr. Gregory Matthews explains more about hypothesis testing and why to use it:
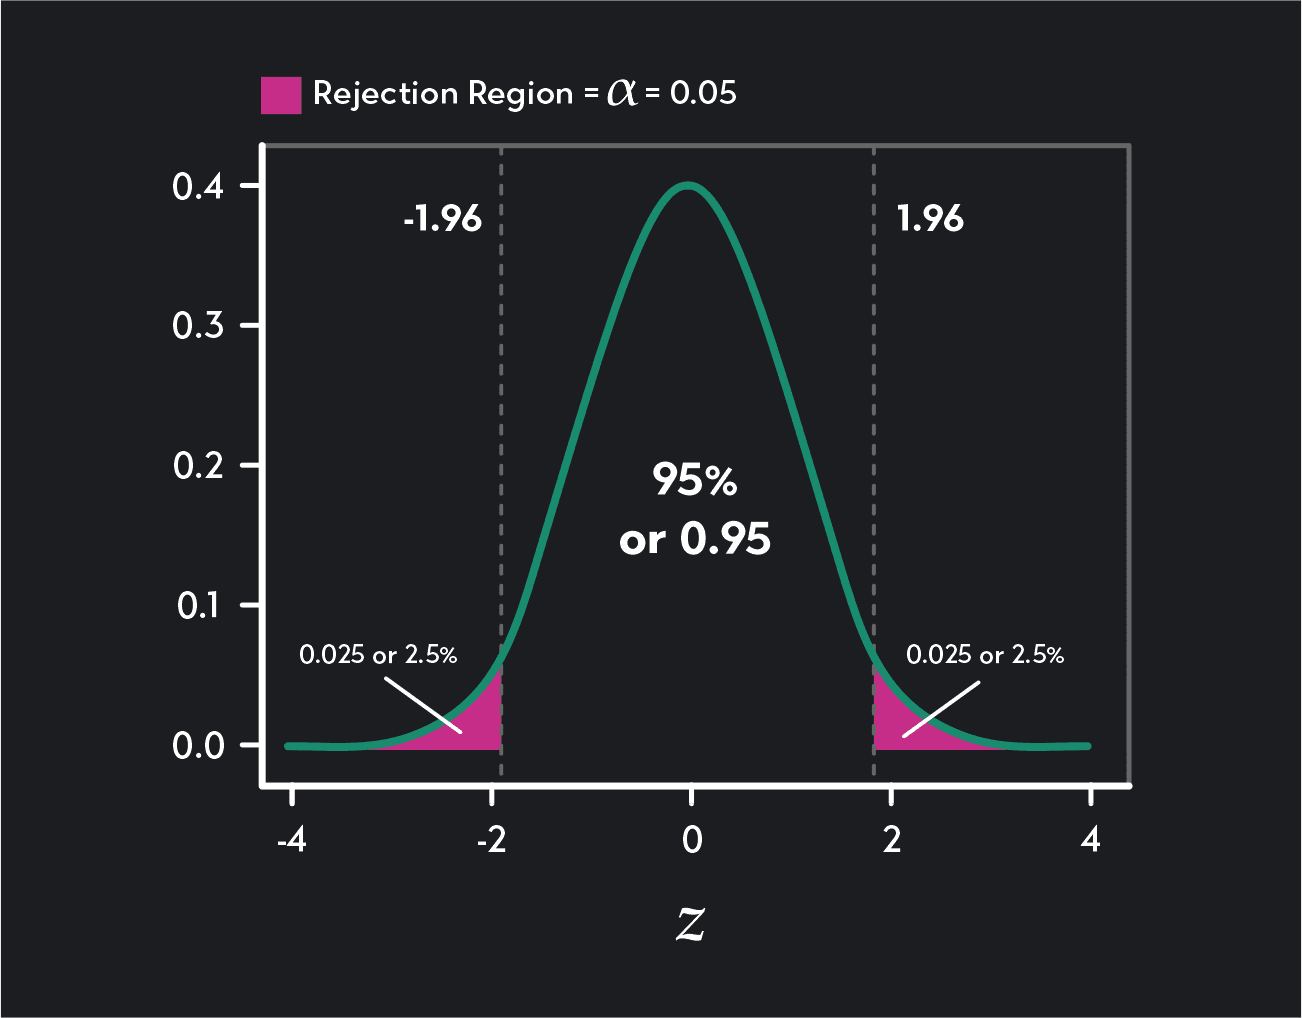
The figure below shows how the critical values mark the boundaries of two rejection regions (shaded in pink). Any test result greater than 1.96 falls into the rejection region in the distribution’s right tail, and any test result below -1.96 falls into the rejection region in the left tail of the distribution.
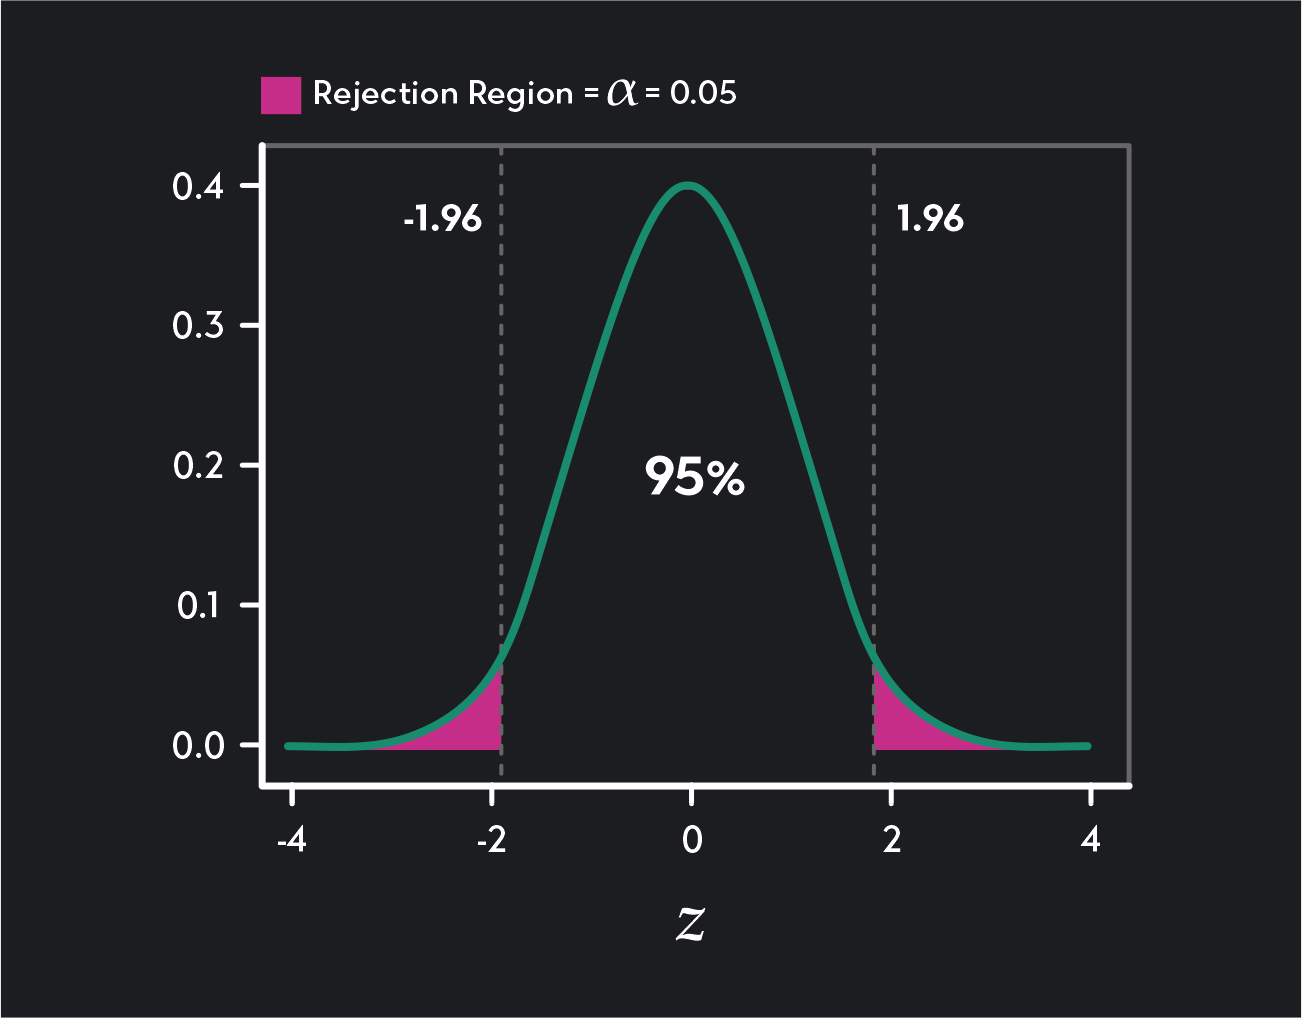
A two-tailed Z-test with a 95% confidence level (or a significance level of ɑ = 0.05) has two critical values 1.96 and -1.96.
Before we dive deeper, let’s do a quick refresher on hypothesis testing. In statistics, a hypothesis test is a statistical test where you test an “alternative” hypothesis against a “null” hypothesis. The null hypothesis represents the default hypothesis or the status quo. It typically represents what the academic community or the general public believes to be true. The alternative hypothesis represents what you suspect could be true in place of the null hypothesis.
For example, I may hypothesize that as times have changed, the average age of first-time mothers in the U.S. has increased and that first-time mothers, on average, are now older than 25. Meanwhile, conventional wisdom or existing research may say that the average age of first-time mothers in the U.S. is 25 years old.
In this example, my hypothesis is the alternative hypothesis, and the conventional wisdom is the null hypothesis.
Alternative Hypothesis = Average age of first-time mothers in the U.S. > 25
Null Hypothesis = Average age of first-time mothers in the U.S. = 25
In a hypothesis test, the goal is to draw inferences about a population parameter (such as the population mean of first-time mothers in the U.S.) from sample data randomly drawn from the population.
The basic intuition behind hypothesis testing is this. If we assume that the null hypothesis is true, data collected from a random sample of first-time mothers should have a sample average that’s close to 25 years old. We don’t expect the sample to have the same average as the population, but we expect it to be pretty close. If we find this to be the case, we have evidence favoring the null hypothesis. If our sample average is far enough above 25, we have evidence that favors the alternative hypothesis.
A major conundrum in hypothesis testing is deciding what counts as “close to 25” and what counts as being “far enough above 25”? If you randomly sample a thousand first-time mothers and the sample mean is 26 or 27 years old, should you favor the null hypothesis or the alternative?
To make this determination, you need to do the following:
1. First, you convert your sample statistic into a test statistic.
In our first-time mother example, the sample statistic we have is the average age of the first-time mothers in our sample. Depending on the data we have, we might map this average to a Z-test statistic or a T-test statistic.
A test statistic is just a number that maps a sample statistic to a value on a standardized distribution such as a normal distribution or a T-distribution. By converting our sample statistic to a test statistic, we can easily see how likely or unlikely it is to get our sample statistic under the assumption that the null hypothesis is true.
2. Next, you select a significance level (also known as an alpha (ɑ) level) for your test.
The significance level is a measure of how confident you want to be in your decision to reject the null hypothesis in favor of the alternative. A commonly used significance level in hypothesis testing is 5% (or ɑ=0.05). An alpha-level of 0.05 means that you’ll only reject the null hypothesis if there is less than a 5% chance of wrongly favoring the alternative over the null.
3. Third, you find the critical values that correspond to your test statistic and significance level.
The critical value(s) tell you how small or large your test statistic has to be in order to reject the null hypothesis at your chosen significance level.
4. You check to see if your test statistic falls into the rejection region.
Check the value of the test statistic. Any test statistic that falls above a critical value in the right tail of the distribution is in the rejection region. Any test statistic located below a critical value in the left tail of the distribution is also in the rejection region. If your test statistic falls into the rejection region, you reject the null hypothesis in favor of the alternative hypothesis. If your test statistic does not fall into the rejection region, you fail to reject the null hypothesis.
Notice that critical values play a crucial role in hypothesis testing. Without knowing what your critical values are, you cannot make the final determination of whether or not to reject the null hypothesis.
Critical values vary with the following traits of a hypothesis test.
This will depend on the type of research question you have and the type of data you are working with. In a first-year statistics course, you will often conduct hypothesis tests using Z-statistics (these correspond to a standard normal distribution), T-statistics (these correspond to a T-distribution), or chi-squared test statistics (these correspond to a chi-square distribution).
This is up to the person conducting the test. A significance level (or alpha level) is the probability of mistakenly rejecting the null hypothesis when it is actually true. By choosing a significance level, you are deciding how careful you want to be in avoiding such a mistake.
You might also hear a hypothesis test being described by a confidence level. Confidence levels are closely related to statistical significance. The confidence level of a test is equal to one minus the significance level or 1-ɑ.
Hypothesis tests can be one-tailed or two-tailed, depending on the alternative hypothesis. Null and alternative hypotheses are always mutually exclusive statements, but they can take different forms. If your alternative hypothesis is only concerned with positive effects or the right tail of the distribution, you will likely use a one-tailed upper-tail test.
If your alternative hypothesis is only concerned with negative effects or the left tail of the distribution, you will likely use a one-tailed lower-tail test. Finally, if your alternative hypothesis proposes a deviation in either direction from what the null hypothesis proposes, you’ll use a two-tailed test.
The number of critical values in a hypothesis test depends on whether the test is a one-tailed test or a two-tailed test.
In a two-tailed test, we divide the rejection region into two equal parts: one in the right tail of the distribution and one in the left tail of the distribution. Each of these rejection regions will contain an area of the distribution equal to ɑ/2. For example, in a two-tailed test with a significance level of 0.05, each rejection region will contain 0.05/2 = 0.025 = 2.5% of the area under the distribution. Because we split the rejection region, a two-tailed test has two critical values.
A one-tailed test has one rejection region (either in the right tail or the left tail of the distribution) and one critical value. In a lower tail (or left-tailed) test, the critical value and rejection region will be in the left tail of the distribution. In an upper tail (or right-tailed) test, the critical value and rejection region will be in the right tail of the distribution.
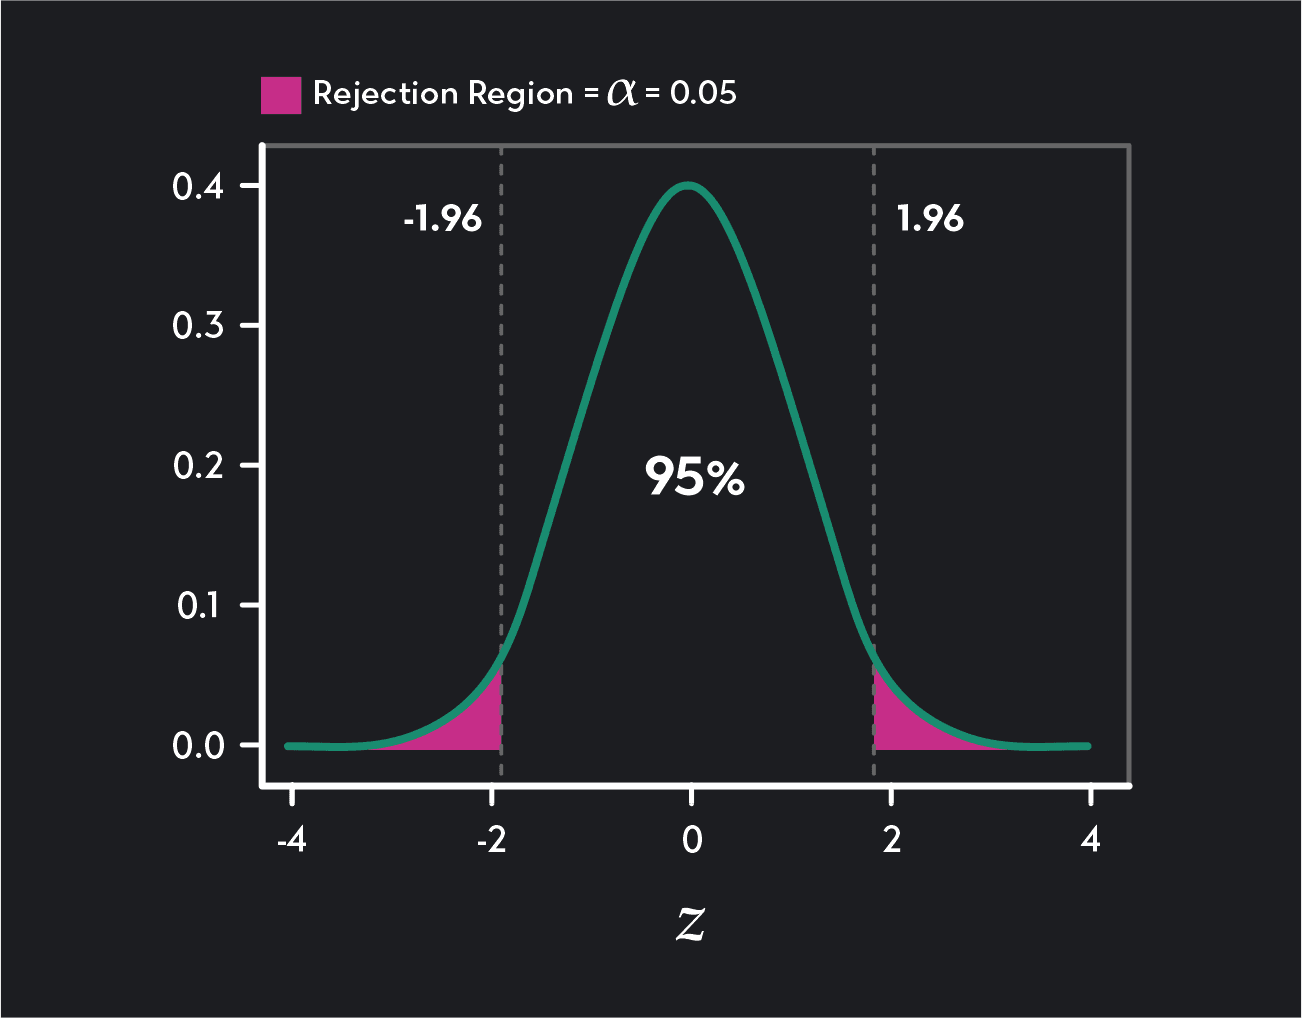
Two-tailed test
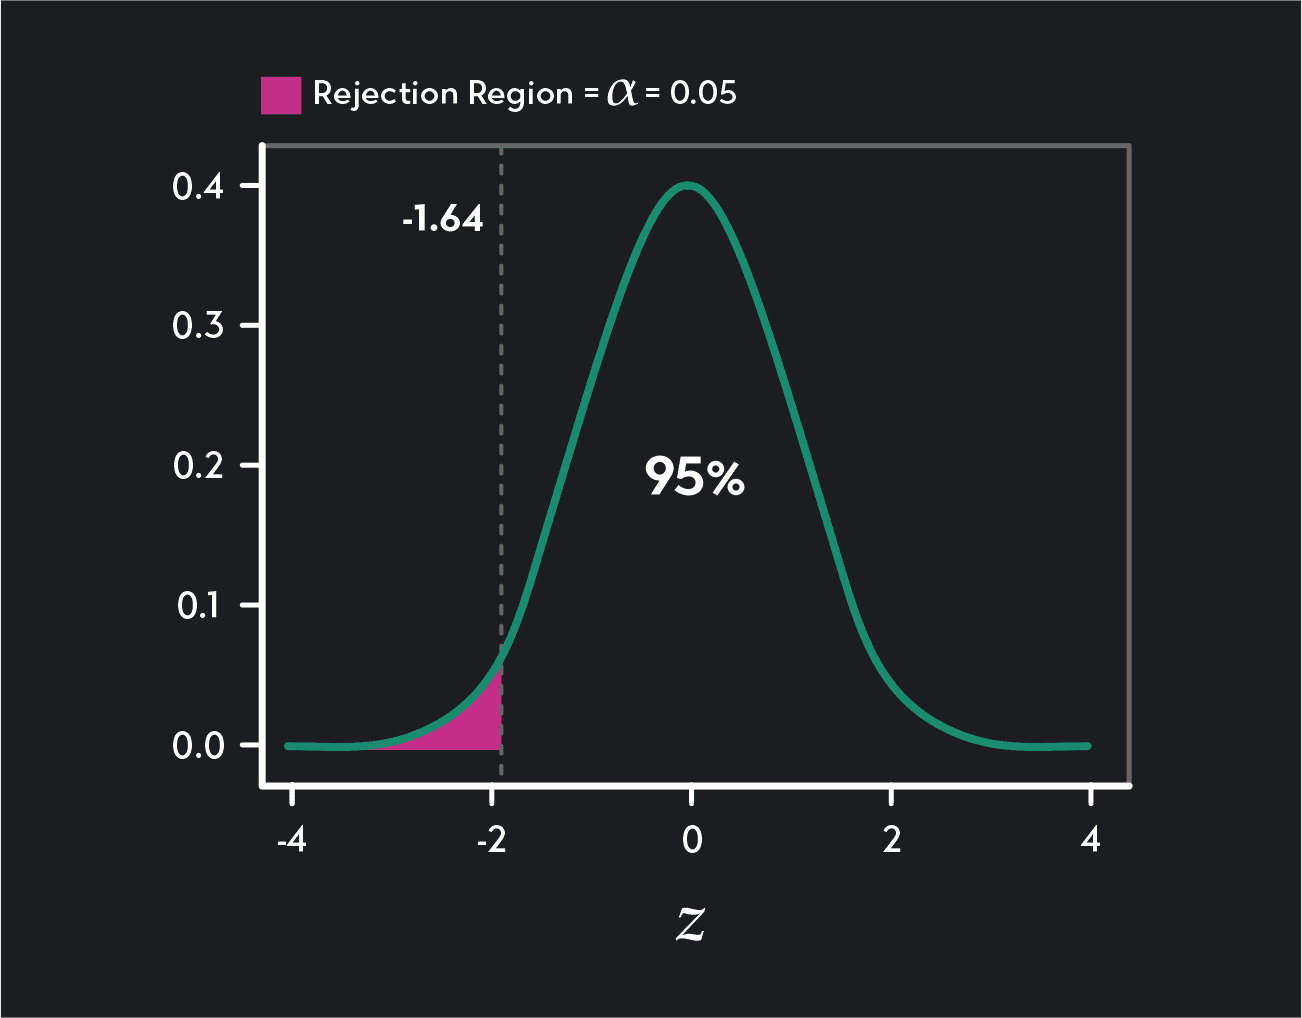
One-tailed lower tail test
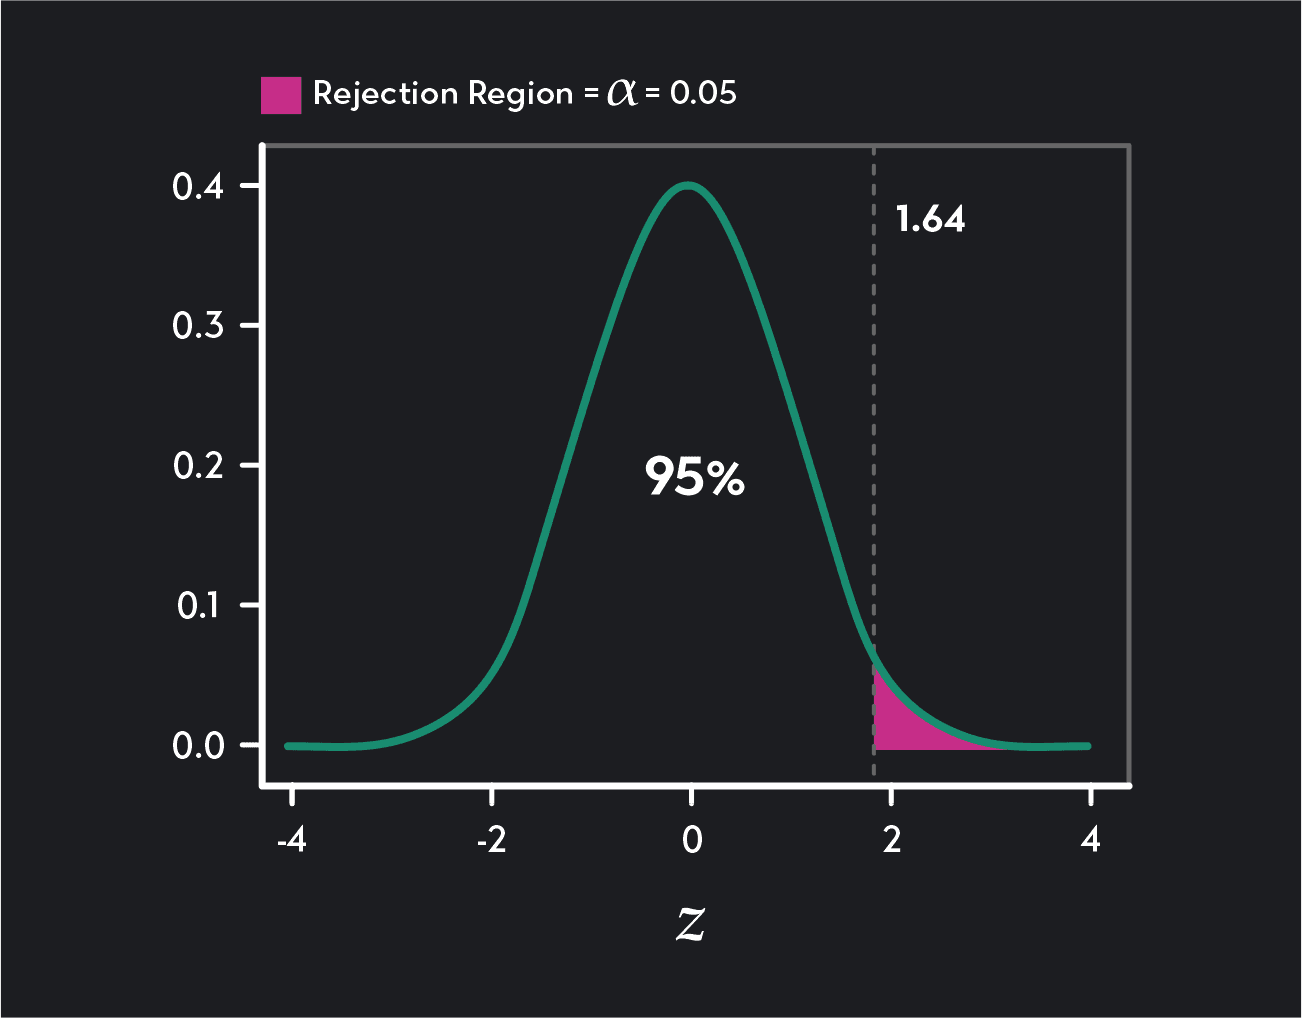
One-tailed upper tail test
The tables below provide a list of critical values that are commonly used in hypothesis testing.
| CONFIDENCE LEVEL | TAILS | ALPHA (𝛂) | CRITICAL VALUE(S) |
| 90% | Two-tailed | 0.1 | -1.64 and 1.64 |
| Right-tailed | 0.1 | 1.28 | |
| Left-tailed | 0.1 | -1.28 | |
| 95% | Two-tailed | 0.05 | -1.96 and 1.96 |
| Right-tailed | 0.05 | 1.65 | |
| Left-tailed | 0.05 | -1.65 | |
| 99% | Two-tailed | 0.01 | -2.58 and 2.58 |
| Right-tailed | 0.01 | 2.33 | |
| Left-tailed | 0.01 | -2.33 |
| One-tailed test 𝛂 =______ | 0.10 | 0.05 | 0.025 | 0.01 | 0.005 |
| Two-tailed test 𝛂 =______ | 0.20 | 0.10 | 0.05 | 0.02 | 0.01 |
| 1 | 3.078 | 6.314 | 12.71 | 31.82 | 63.66 |
| 2 | 1.886 | 2.920 | 4.303 | 6.965 | 9.925 |
| 3 | 1.638 | 2.353 | 3.182 | 4.541 | 5.841 |
| 4 | 1.533 | 2.132 | 2.776 | 3.747 | 4.604 |
| 5 | 1.476 | 2.015 | 2.571 | 3.365 | 4.032 |
| 6 | 1.440 | 1.943 | 2.447 | 3.143 | 3.707 |
| 7 | 1.415 | 1.895 | 2.365 | 2.998 | 3.499 |
| 8 | 1.397 | 1.860 | 2.306 | 2.896 | 3.355 |
| 9 | 1.383 | 1.833 | 2.262 | 2.821 | 3.250 |
| 10 | 1.372 | 1.812 | 2.228 | 2.764 | 3.169 |
| 11 | 1.363 | 1.796 | 2.201 | 2.718 | 3.106 |
| 12 | 1.356 | 1.782 | 2.179 | 2.681 | 3.055 |
| 13 | 1.350 | 1.771 | 2.160 | 2.650 | 3.012 |
| 14 | 1.345 | 1.761 | 2.145 | 2.624 | 2.977 |
| 15 | 1.341 | 1.753 | 2.131 | 2.602 | 2.947 |
| 16 | 1.337 | 1.746 | 2.120 | 2.583 | 2.921 |
| 17 | 1.333 | 1.740 | 2.110 | 2.567 | 2.898 |
| 18 | 1.330 | 1.734 | 2.101 | 2.552 | 2.878 |
| 19 | 1.328 | 1.729 | 2.093 | 2.539 | 2.861 |
| 20 | 1.325 | 1.725 | 2.086 | 2.528 | 2.845 |
| 21 | 1.323 | 1.721 | 2.080 | 2.518 | 2.831 |
| 22 | 1.321 | 1.717 | 2.074 | 2.508 | 2.819 |
| 23 | 1.319 | 1.714 | 2.069 | 2.500 | 2.807 |
| 24 | 1.318 | 1.711 | 2.064 | 2.492 | 2.797 |
| 25 | 1.316 | 1.708 | 2.060 | 2.485 | 2.787 |
| 26 | 1.315 | 1.706 | 2.056 | 2.479 | 2.779 |
| 27 | 1.314 | 1.703 | 2.052 | 2.473 | 2.771 |
| 28 | 1.313 | 1.701 | 2.048 | 2.467 | 2.763 |
| 29 | 1.311 | 1.699 | 2.045 | 2.462 | 2.756 |
| 30 | 1.310 | 1.697 | 2.042 | 2.457 | 2.750 |
Suppose you don’t remember what the critical values for a two-sided Z-test are. How would you go about finding them?
To find the critical value, you start with the significance level of your hypothesis test. Your significance level is equal to the total area of the rejection region. For example, with a 0.05 significance level, the entire rejection region will be equal to 5% of the area under the normal distribution.
In a two-tailed test Z-test, we split equally the rejection region into two parts. One rejection region is in the distribution’s right tail, and the other is in the left tail of the distribution. Each of these two parts will contain half of the total area of the rejection region. For a two-tailed Z-test with a significance level of ɑ=0.05, each rejection region will contain ɑ/2 = 0.025 or 2.5% of the distribution. This leaves a confidence interval of 0.95 (or 95%) between the two rejection regions.
To find the critical values, you need to find the corresponding values (or Z-scores) in the Z-distribution. Make sure the percentage lying to the left of the first critical value is equal to ɑ/2. Also, check that the percentage of the distribution lying to the right of the second critical value is equal to ɑ/2. You can use a Z-table to look up these figures.
For a two-tailed Z-test with a significance level of ɑ=0.05, we are looking for two critical values such that ɑ/2 or 2.5% of the normal distribution lies to the left of the first critical value and ɑ/2 or 0.025 of the normal distribution lies to the right of the second critical value.
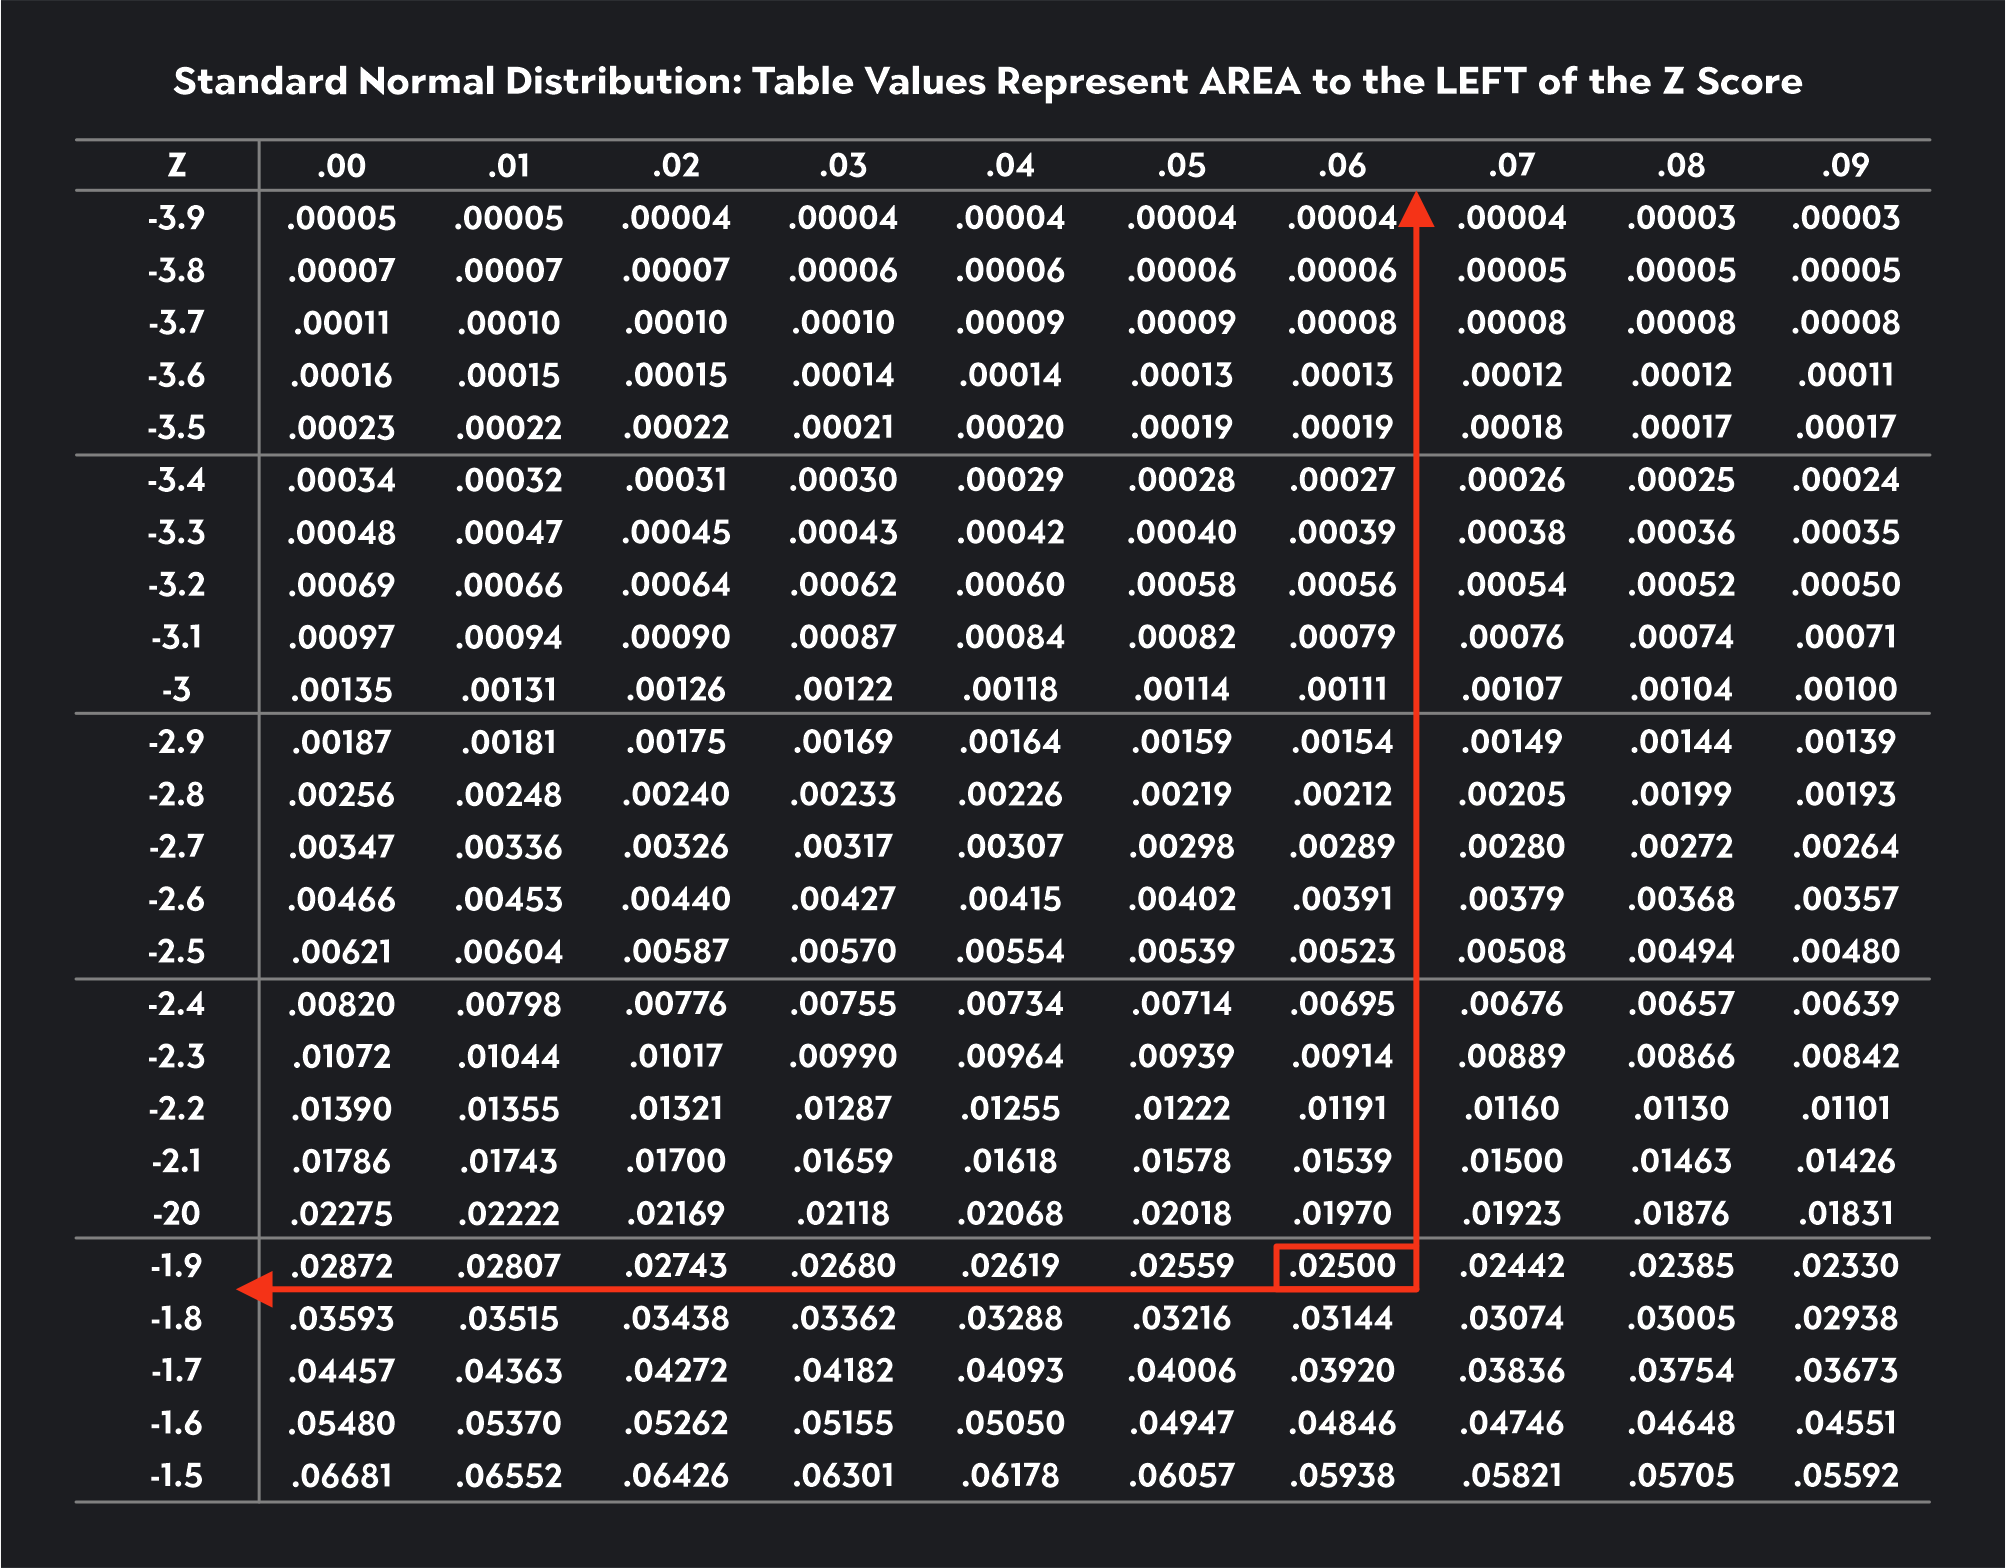
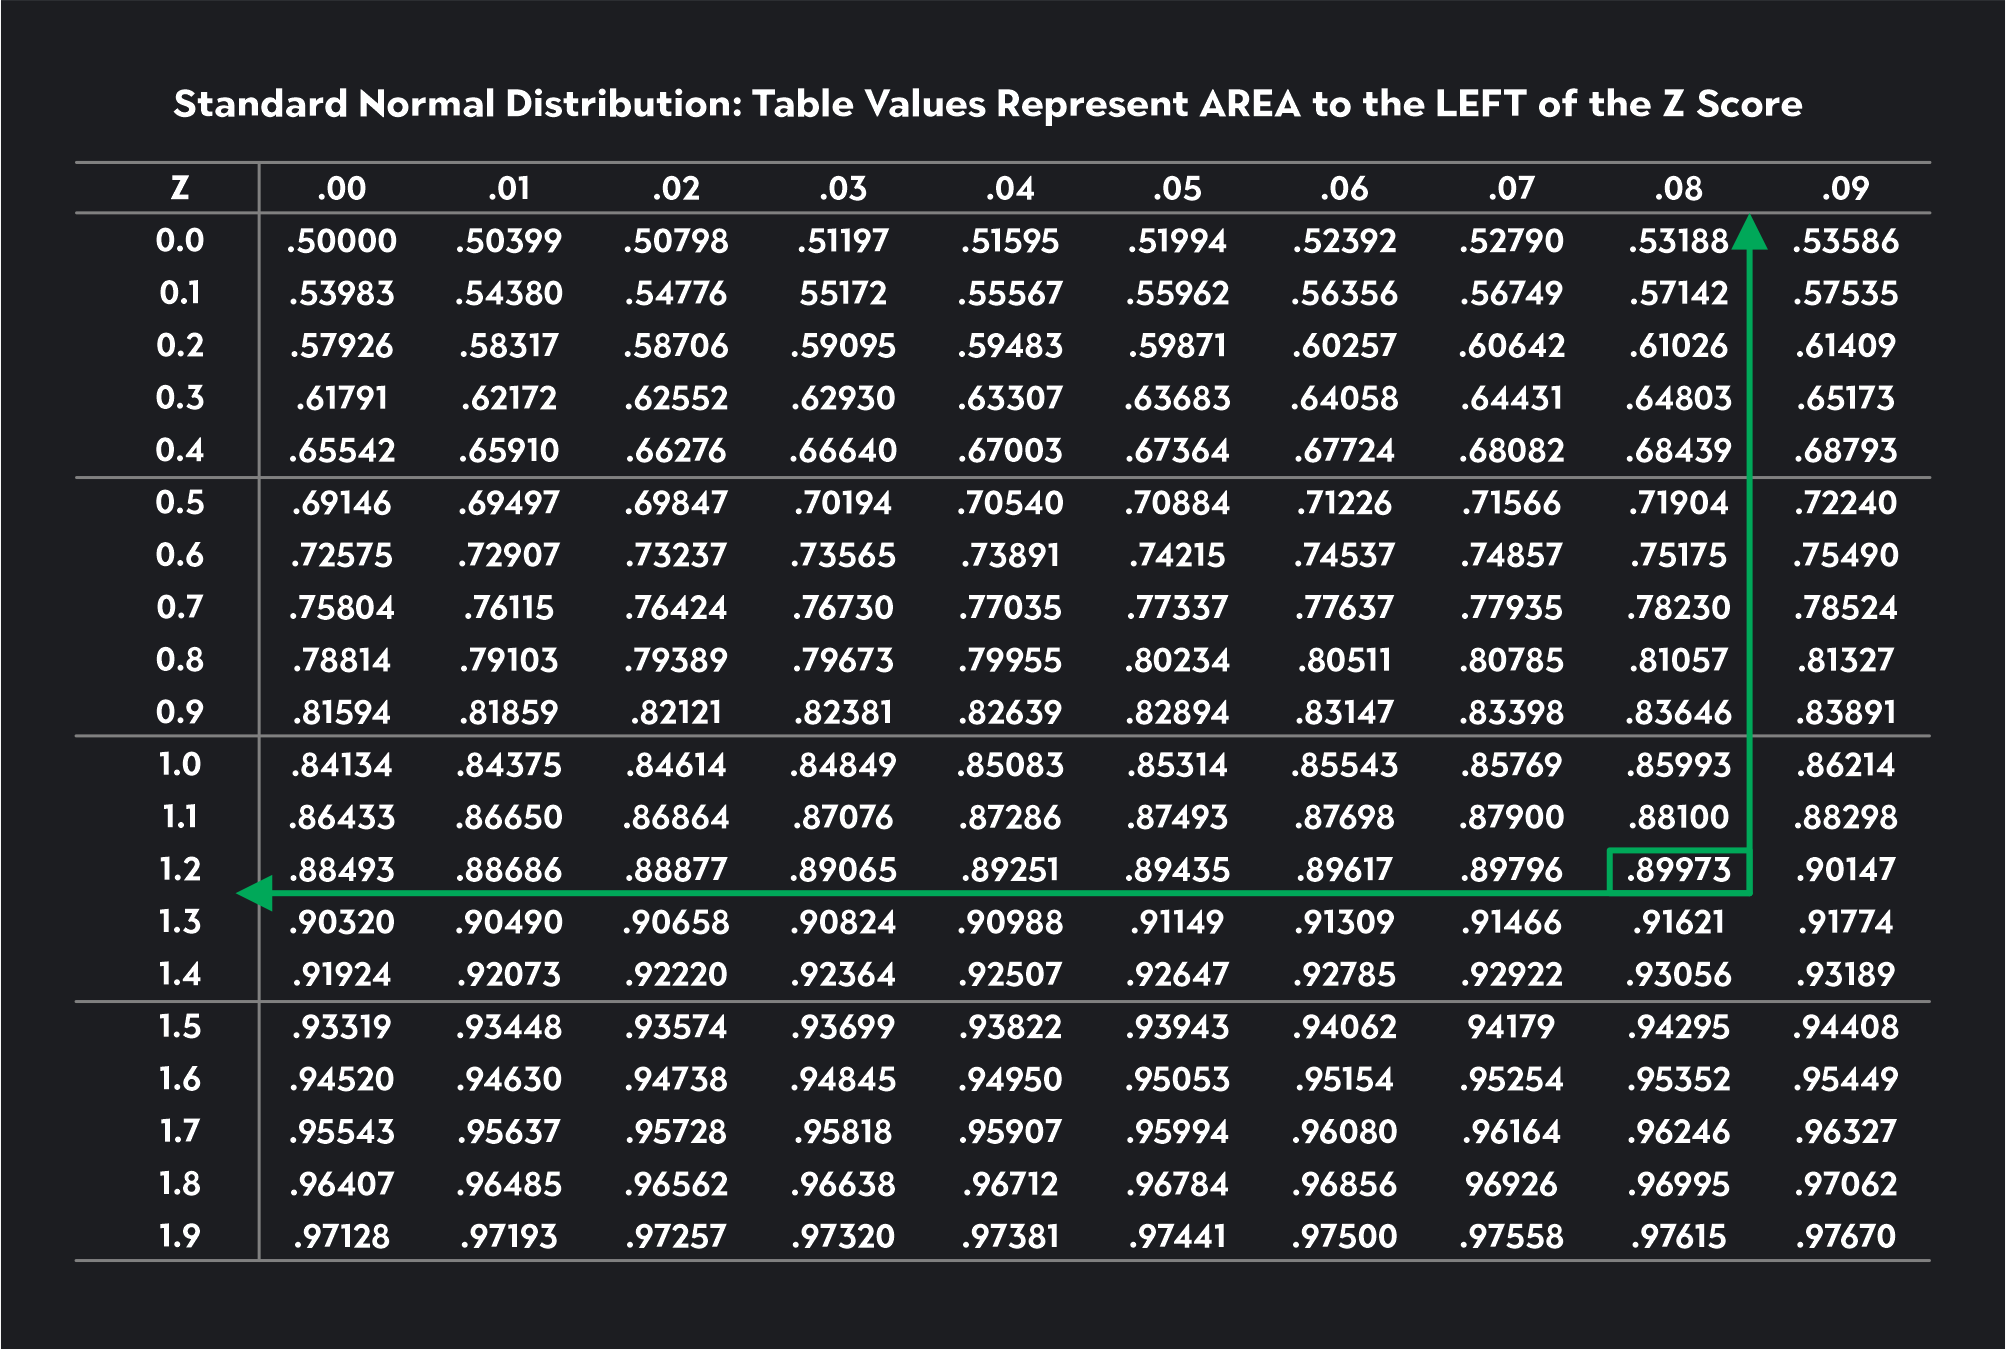
Z-tables will either show you probabilities to the LEFT or to the RIGHT of a particular value. We’ll stick to Z-tables showing probabilities to the LEFT.
For the first critical value, if the area to the left of the critical value is 0.025, we use the Z-table to find the number 0.025 in the table (we’ve shown this figure highlighted in an orange box). We then trace that value to the left to find the first two digits of the critical value (-1.9) and then up to the top to find the last digit (-0.06). If we put these together, we have the critical value -1.96. Z-tables provide Z-scores that are usually rounded to two decimal places.
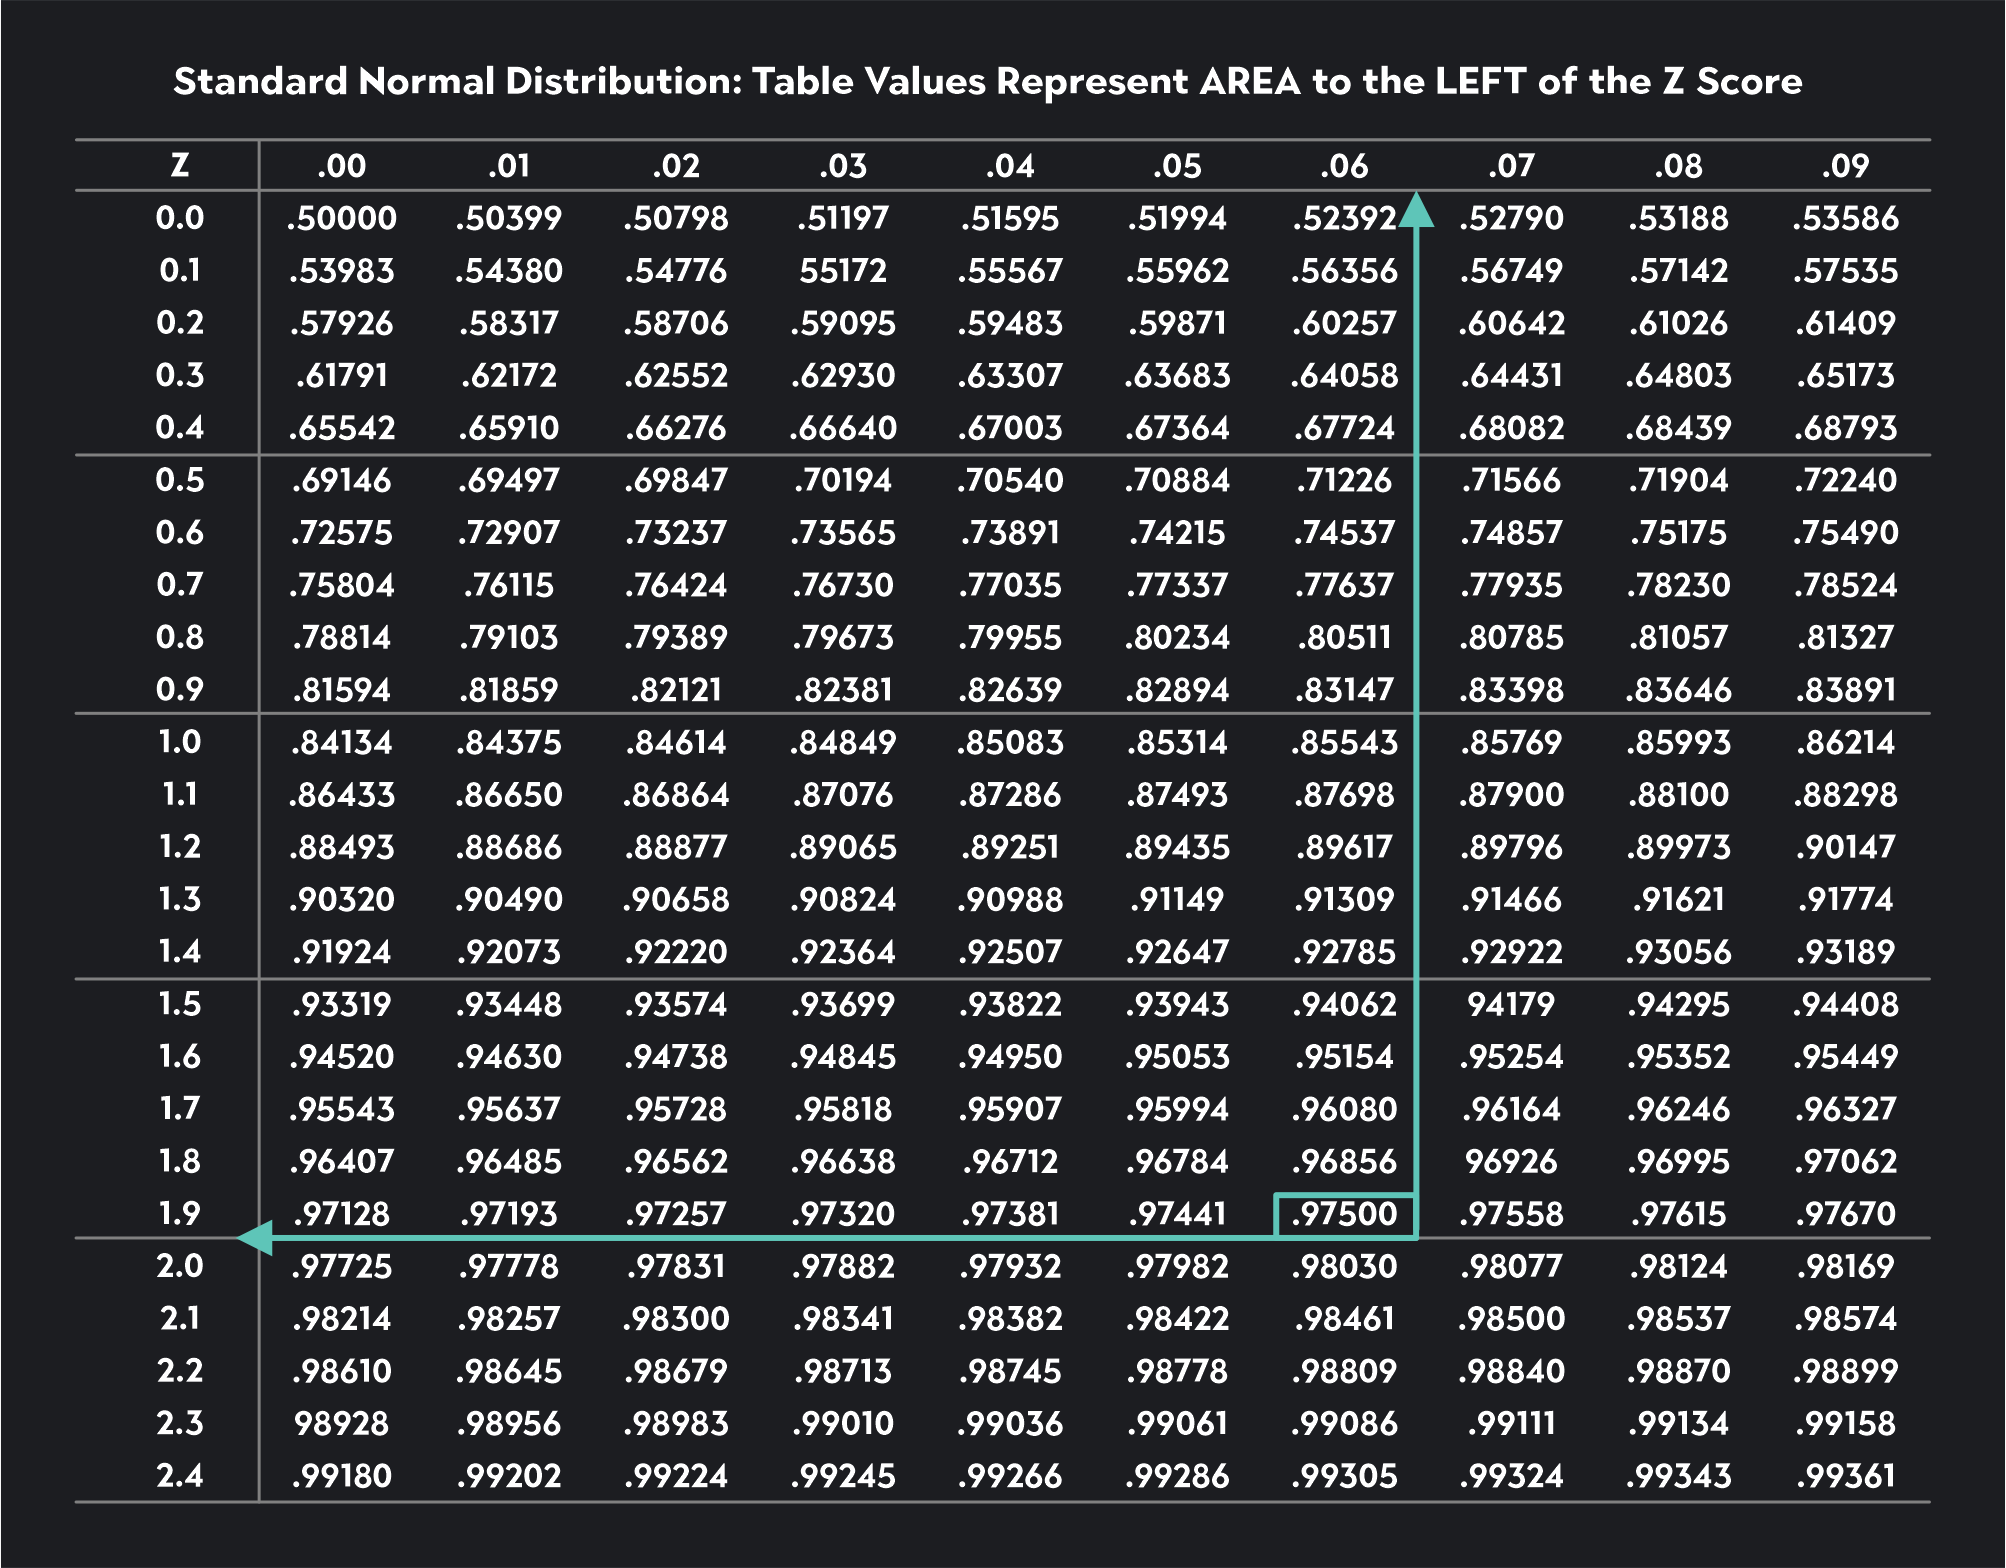
For the second critical value, 2.5% of the distribution will lie to the right, meaning 97.5% of the distribution will lie to the left of the critical value (1-0.025=0.0975). To find this critical value, we look for the number 0.0975 in the Z-table (we’ve shown this figure highlighted in a green box). We trace that value to the left to find the first two digits of the critical value (1.9) and then up to the top to find the last digit (0.06). Our second critical value is 1.96.
Following similar steps, see if you can find the critical values for a Z-test with a significance level of ɑ=0.10. The critical values you find should be equal to -1.64 and 1.64.
In a one-tailed test, there is just one rejection region, and the area of the rejection region is equal to the significance level.
For a one-tailed lower tail test, use the z-table to find a critical value where the total area to the left of the critical value is equal to alpha.
For a one-tailed upper tail test, use the z-table to find a critical value where the total area to the left of the critical value is equal to 1- alpha.
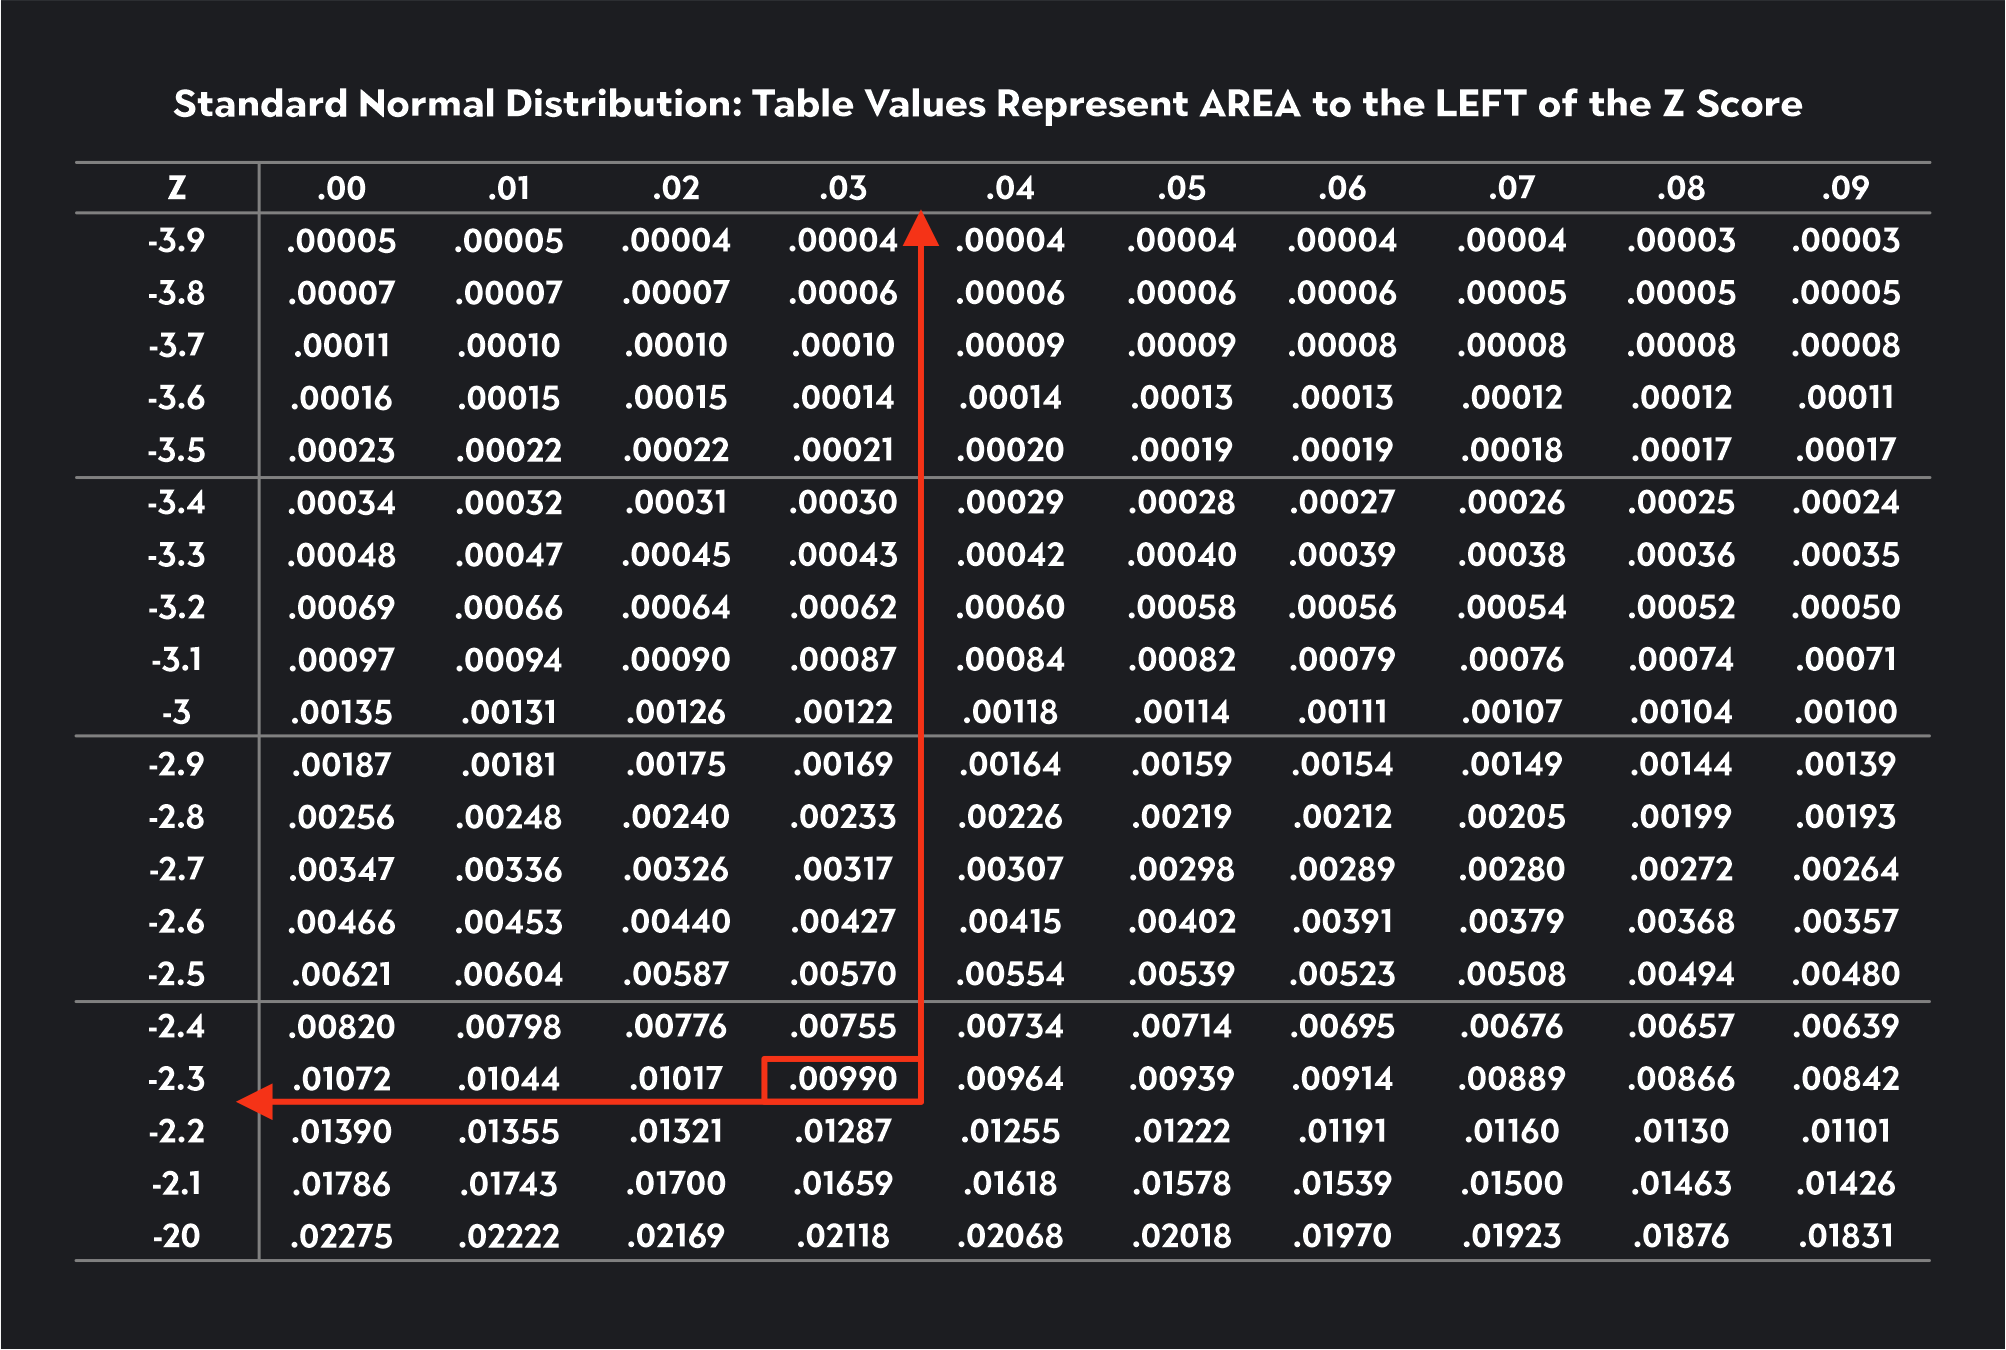
Let’s see if we can use the Z-table to find the critical value for a lower tail Z-test with a significance level of 0.01.
Since alpha equals 0.01, we are looking for this number in the Z-table. If you can’t find the exact number, you look for the closest number, which in this case is 0.0090. Once we’ve found this number, we trace the value to the first column to find the first two digits of the critical value and then up to the first row to find the last digit. The critical value is -2.33.
Now let’s see if we can use the Z-table to find the critical value for an upper tail Z-test with a significance level of 0.10.
Since this is an upper tail test, we need to use the Z-table to look for a critical value corresponding to 0.90 (1-ɑ = 1-0.10 = 0.90). The closest number to 0.90 we can find in the table is 0.89973. We trace this number to the left and then up to the top of the table to find a critical value of 1.28.
To find a critical value in R, you can use the qnorm() function for a Z-test or the qt() function for a T-test.
Here are some examples of how you could use these functions in your critical value approach.
For a two-tailed Z-test with a 0.05 significance level, you would type:
qnorm(p=0.05/2, lower.tail=FALSE)
This will give you one of your critical values. The second critical value is just the negative value of the first.
For a one-tailed lower tail Z-test with a 0.01 significance level, you would type:
qnorm(p=0.01, lower.tail=TRUE)
For a one-tailed upper tail Z-test with a 0.01 significance level, you would type:
qnorm(p=0.01, lower.tail=FALSE)
For a two-tailed T-test with 15 degrees of freedom and a 0.1 significance level, you would type:
qt(p=0.1/2, df=15, lower.tail=FALSE)
This will give you one of your critical values. The second critical value is just the negative value of the first.
For a one-tailed lower tail T-test with 10 degrees of freedom and a 0.05 significance level, you would type:
qt(p=0.05, df=10, lower.tail=TRUE)
For a one-tailed upper tail T-test with 20 degrees of freedom and a 0.01 significance level, you would type:
qt(p=0.01, df=20, lower.tail=FALSE)
Now that you know the ins and outs of critical values, you’re one step closer to conducting hypothesis tests with ease!
Outlier (from the co-founder of MasterClass) has brought together some of the world's best instructors, game designers, and filmmakers to create the future of online college.
Check out these related courses:


Statistics
Learn what binomial distribution is in probability. Read a list of the criteria that must be present to apply the formula and learn how to calculate it.
Subject Matter Expert

Statistics
This article is about what probability is, its definition, and the formula. You’ll also learn how to calculate it.
Subject Matter Expert

Statistics
This article gives a quick definition of what’s a residual equation, the best way to read it, and how to use it with proper statistical models.
Subject Matter Expert