
Statistics
What Do Subsets Mean in Statistics?
This article explains what subsets are in statistics and why they are important. You’ll learn about different types of subsets with formulas and examples for each.
Sarah Thomas
Subject Matter Expert

Statistics
03.17.2022 • 10 min read
Subject Matter Expert
This article explains what a test statistic is, how to complete one with formulas, and how to find the value for t-tests.
In This Article
Take Intro to Statistics Online with Outlier.org
From the co-founder of MasterClass, earn transferable college credits from the University of Pittsburgh (a top 50 global school). The world's best online college courses for 50% less than a traditional college.
Get started
A test statistic is a standardized score used in hypothesis testing. It tells you how likely the results obtained from your sample data are under the assumption that the null hypothesis is true. The more unlikely your results are under this assumption, the easier it becomes to reject the null hypothesis in favor of an alternative hypothesis. The more likely your results are, the harder it becomes to reject the null hypothesis.
There are different kinds of test statistics, but they all work the same way. A test statistic maps the value of a particular sample statistic (such as a sample mean or a sample proportion) to a value on a standardized distribution, such as the Standard Normal Distribution or the t-distribution. This allows you to determine how likely or unlikely it is to observe the particular value of the statistic you obtained.
Olanrewaju Michael Akande reviews normal distribution in the following lesson clip:
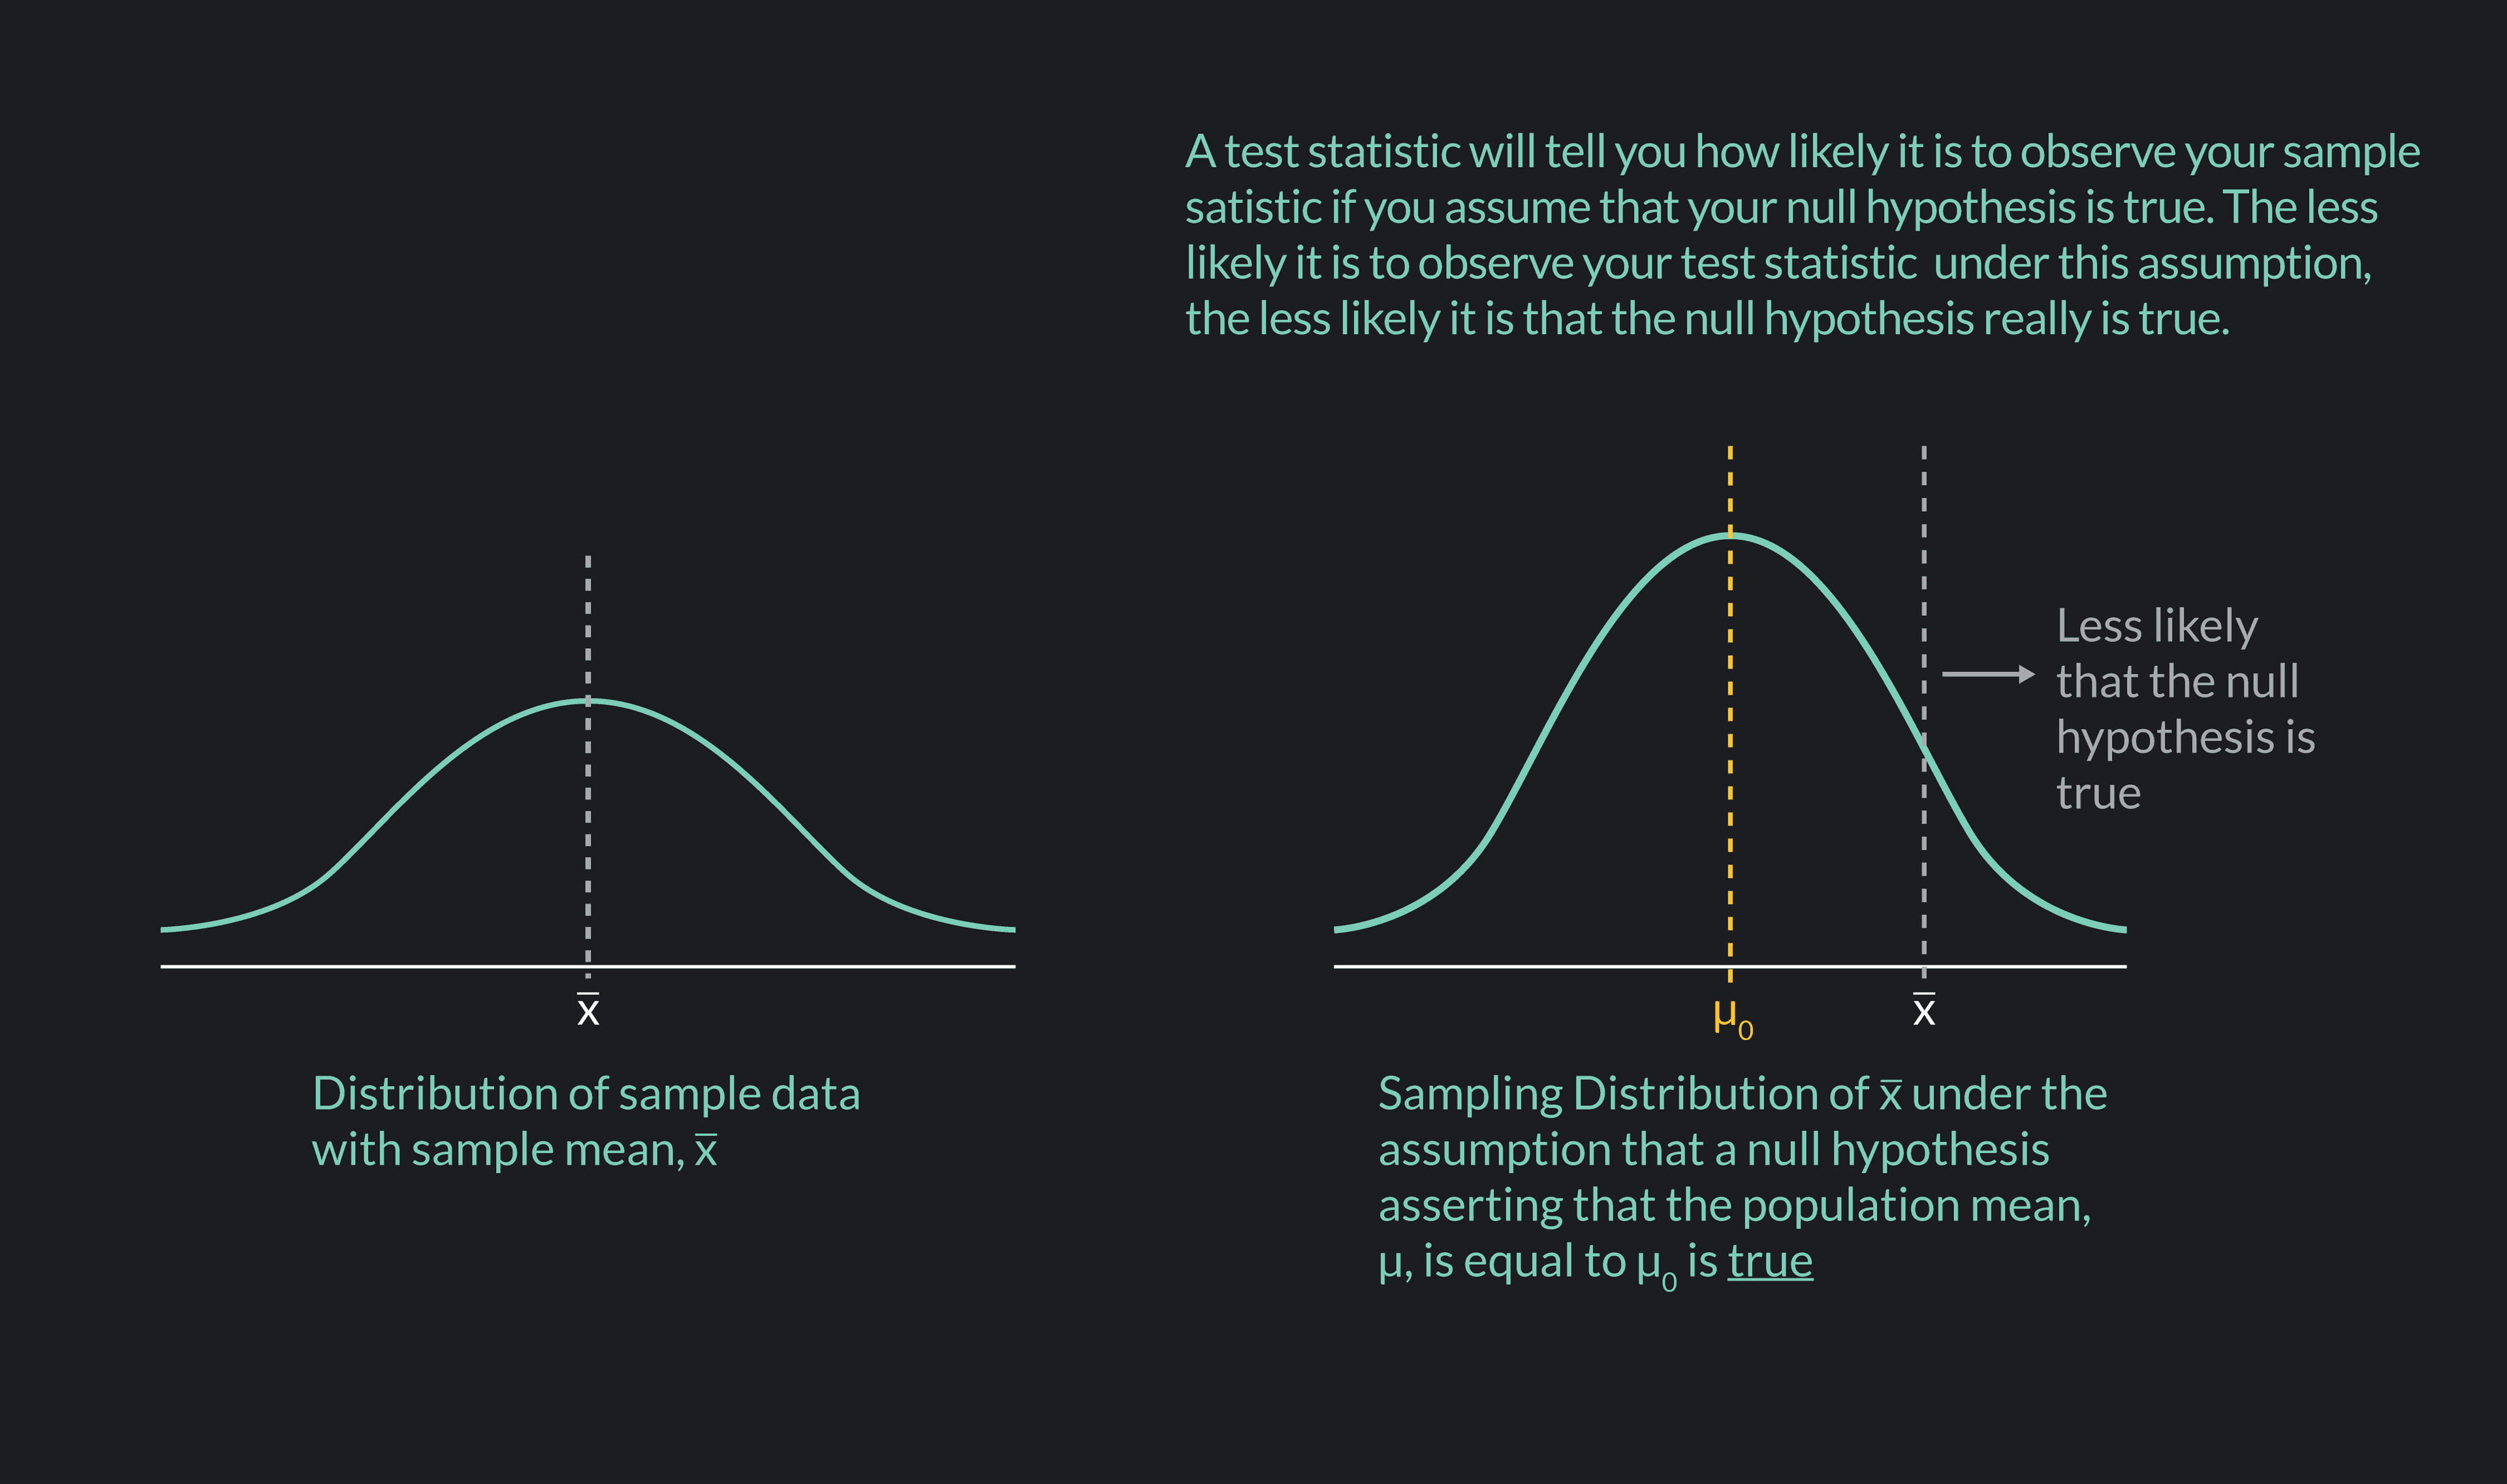
As a quick example, say you have a null hypothesis that the average wait time to get seated at your favorite restaurant—at a table for two without a reservation on a Friday night—is 45 minutes. You select a random sample of 100 parties that got seated under these conditions and ask them what their wait times were. You find that the average wait time for your sample is 55 minutes ( = 55 minutes). A test statistic will convert this sample statistic into a standardized number that helps you answer this question:
“Assuming that my null hypothesis is true—assuming that the average wait time at the restaurant actually is 45 minutes—what is the likelihood that I found an average wait time of 55 minutes for my randomly drawn sample?”
Remember, the lower the likelihood of observing your sample statistic, the more confident you can be rejecting the null hypothesis.
The type of test statistic you use in a hypothesis test depends on several factors including:
The type of statistic you are using in the test
The size of your sample
Assumptions you can make about the distribution of your data
Assumptions you can make about the distribution of the statistic used in the test
The formula for calculating test statistics takes the following general form:
Remember, a statistic is a measure calculated from a single sample or many samples. Examples include the sample mean , the difference between two sample means , or a sample proportion .
A parameter is a measure calculated from a single population or many populations. Examples include the population mean , the difference between two population means , or a population proportion .
In the denominator of the equation, you have the standard deviation—or the approximated standard deviation—of the statistic used in the numerator. If you use the sample mean , in the numerator, you should use the standard deviation of or an approximation of it in the denominator.
The test statistics you are most likely to encounter in an introductory statistics class are:
The Z-test statistic for a single sample mean
The Z-test statistic for population proportions
The t-test statistic for a single sample mean
The t-test statistic for two sample means
We use the Z-test statistic (or Z-statistic) for a sample mean in hypothesis tests involving a sample mean , calculated for a single sample.
You use this test statistic when:
Your sample size is greater than or equal to 30 (n30)
The sampling distribution of the sample mean is assumed to be normal
The standard deviation of the population parameter is known.
The formula for this type of Z-test statistic is:
is the symbol for the Z-test statistic
is the sample mean
is the hypothesized value of the population mean according to the null hypothesis
is the population standard deviation
is the sample size
is the standard error of . The standard error is just the standard deviation of the sampling distribution of the sample mean.
You may notice that a Z-test statistic is just a z-score for a particular value of a normally distributed statistic. There are many variations of the Z-test statistic. We can use these in hypothesis tests, where the sample statistic is being used in the test is approximately normally distributed. One such variation of the Z-test statistic is the Z-test for proportions.
We use the Z-test statistic for proportions in hypothesis tests where a sample proportion is being tested against the hypothesized value of the population proportion, . We use the Z-test for proportions when your sample size is greater than or equal to 30 (n30), and the distribution of the sample statistic is assumed to be normal. The formula for the Z-test statistic for population proportions is:
Z is the symbol for the Z-test statistic for population proportions
is the sample proportion
is the hypothesized value of the population proportion according to the null hypothesis
is the sample size
When your sample size is smaller than 30 (n<30)—or when you cannot assume that the distribution of your sample statistic is normally distributed—you’ll often use a t-test statistic rather than a Z-test.
We use the t-test statistic (or t-statistic) for a sample mean in hypothesis tests involving a sample mean calculated for a single sample drawn from a population. Unlike the Z-test for a single sample mean, you use the t-test when:
Your sample size is less than 30 (n<30)
The distribution of the sample statistic is not approximated by a normal distribution
The standard deviation of the population parameter is unknown
A t-test statistic maps your statistics to a t-distribution as opposed to the normal distribution with a Z-test. A t-distribution is like a standard normal distribution, but it has thicker tails and changes depending on your sample size . When is large, the t-distribution is closer to the normal distribution; and as the sample size gets larger and larger, a t-distribution will converge to the normal distribution. As gets smaller, the t-distribution gets flatter with thicker tails.
The formula for the t-test statistic for a sample mean is:
is the symbol for the t-test statistic
is the sample mean
is the value of the population mean according to the null hypothesis
is the sample standard deviation
is the sample size
is an approximation of the standard error of . In a t-test, because you do not know the value of the population standard deviation, you need to approximate the standard error of using the sample standard deviation .
We can also use t-test statistics in hypothesis tests where the values of two sample means ( and ) are being compared. You do this to test the null hypothesis that the two samples are drawn from the same underlying population. If the null hypothesis is true, then any difference between the sample means is due to random variations in the data. Rejecting the null hypothesis suggests that the samples were drawn from two distinct populations and that the difference in the sample means reflects actual differences in the characteristics of subjects in one population compared to the other.
Like the t-test for a single sample mean, you use the t-test for two sample means when:
Your sample sizes are less than 30 (n<30)
The distribution of the sample statistics are not approximated by a normal distribution
The standard deviation of the population parameter is unknown
The formula for the t-test statistic for two sample means is:
is the symbol for the t-test statistic
is the sample mean of sample 1
is the sample mean of sample 2
is the mean of the population from which sample 1 was drawn
is the mean of the population from which sample 2 was drawn
is the variance of sample 1
is the variance of sample 2
is the sample size for sample 1
is the sample size for sample 2
T-tests are generally used in place of Z-tests when one or more of the following conditions hold:
The sample size is less than 30 (n<30)
The statistic you use in the hypothesis test is not approximated by a normal distribution
The population standard deviation
If you know the population standard deviation and you are confident that the statistic used in your hypothesis test is normally distributed, then you can use a Z-test.
As with all test statistics, you should only use a Z-test or a t-test when your data is from a randomly and independently drawn sample.
We use test statistics together with critical values, p-values, and significance levels to determine whether to reject or not a null hypothesis.
A critical value is a value of a test statistic that marks a cutoff point. If a test statistic is more extreme than the critical value—greater than the critical value in the right tail of a distribution or less than the critical value in the left tail of a distribution—the null hypothesis is rejected.
Critical values are determined by the significance level (or alpha level) of a hypothesis test. The significance level you use is up to you, but the most commonly used significance level is 0.05 (=0.05).
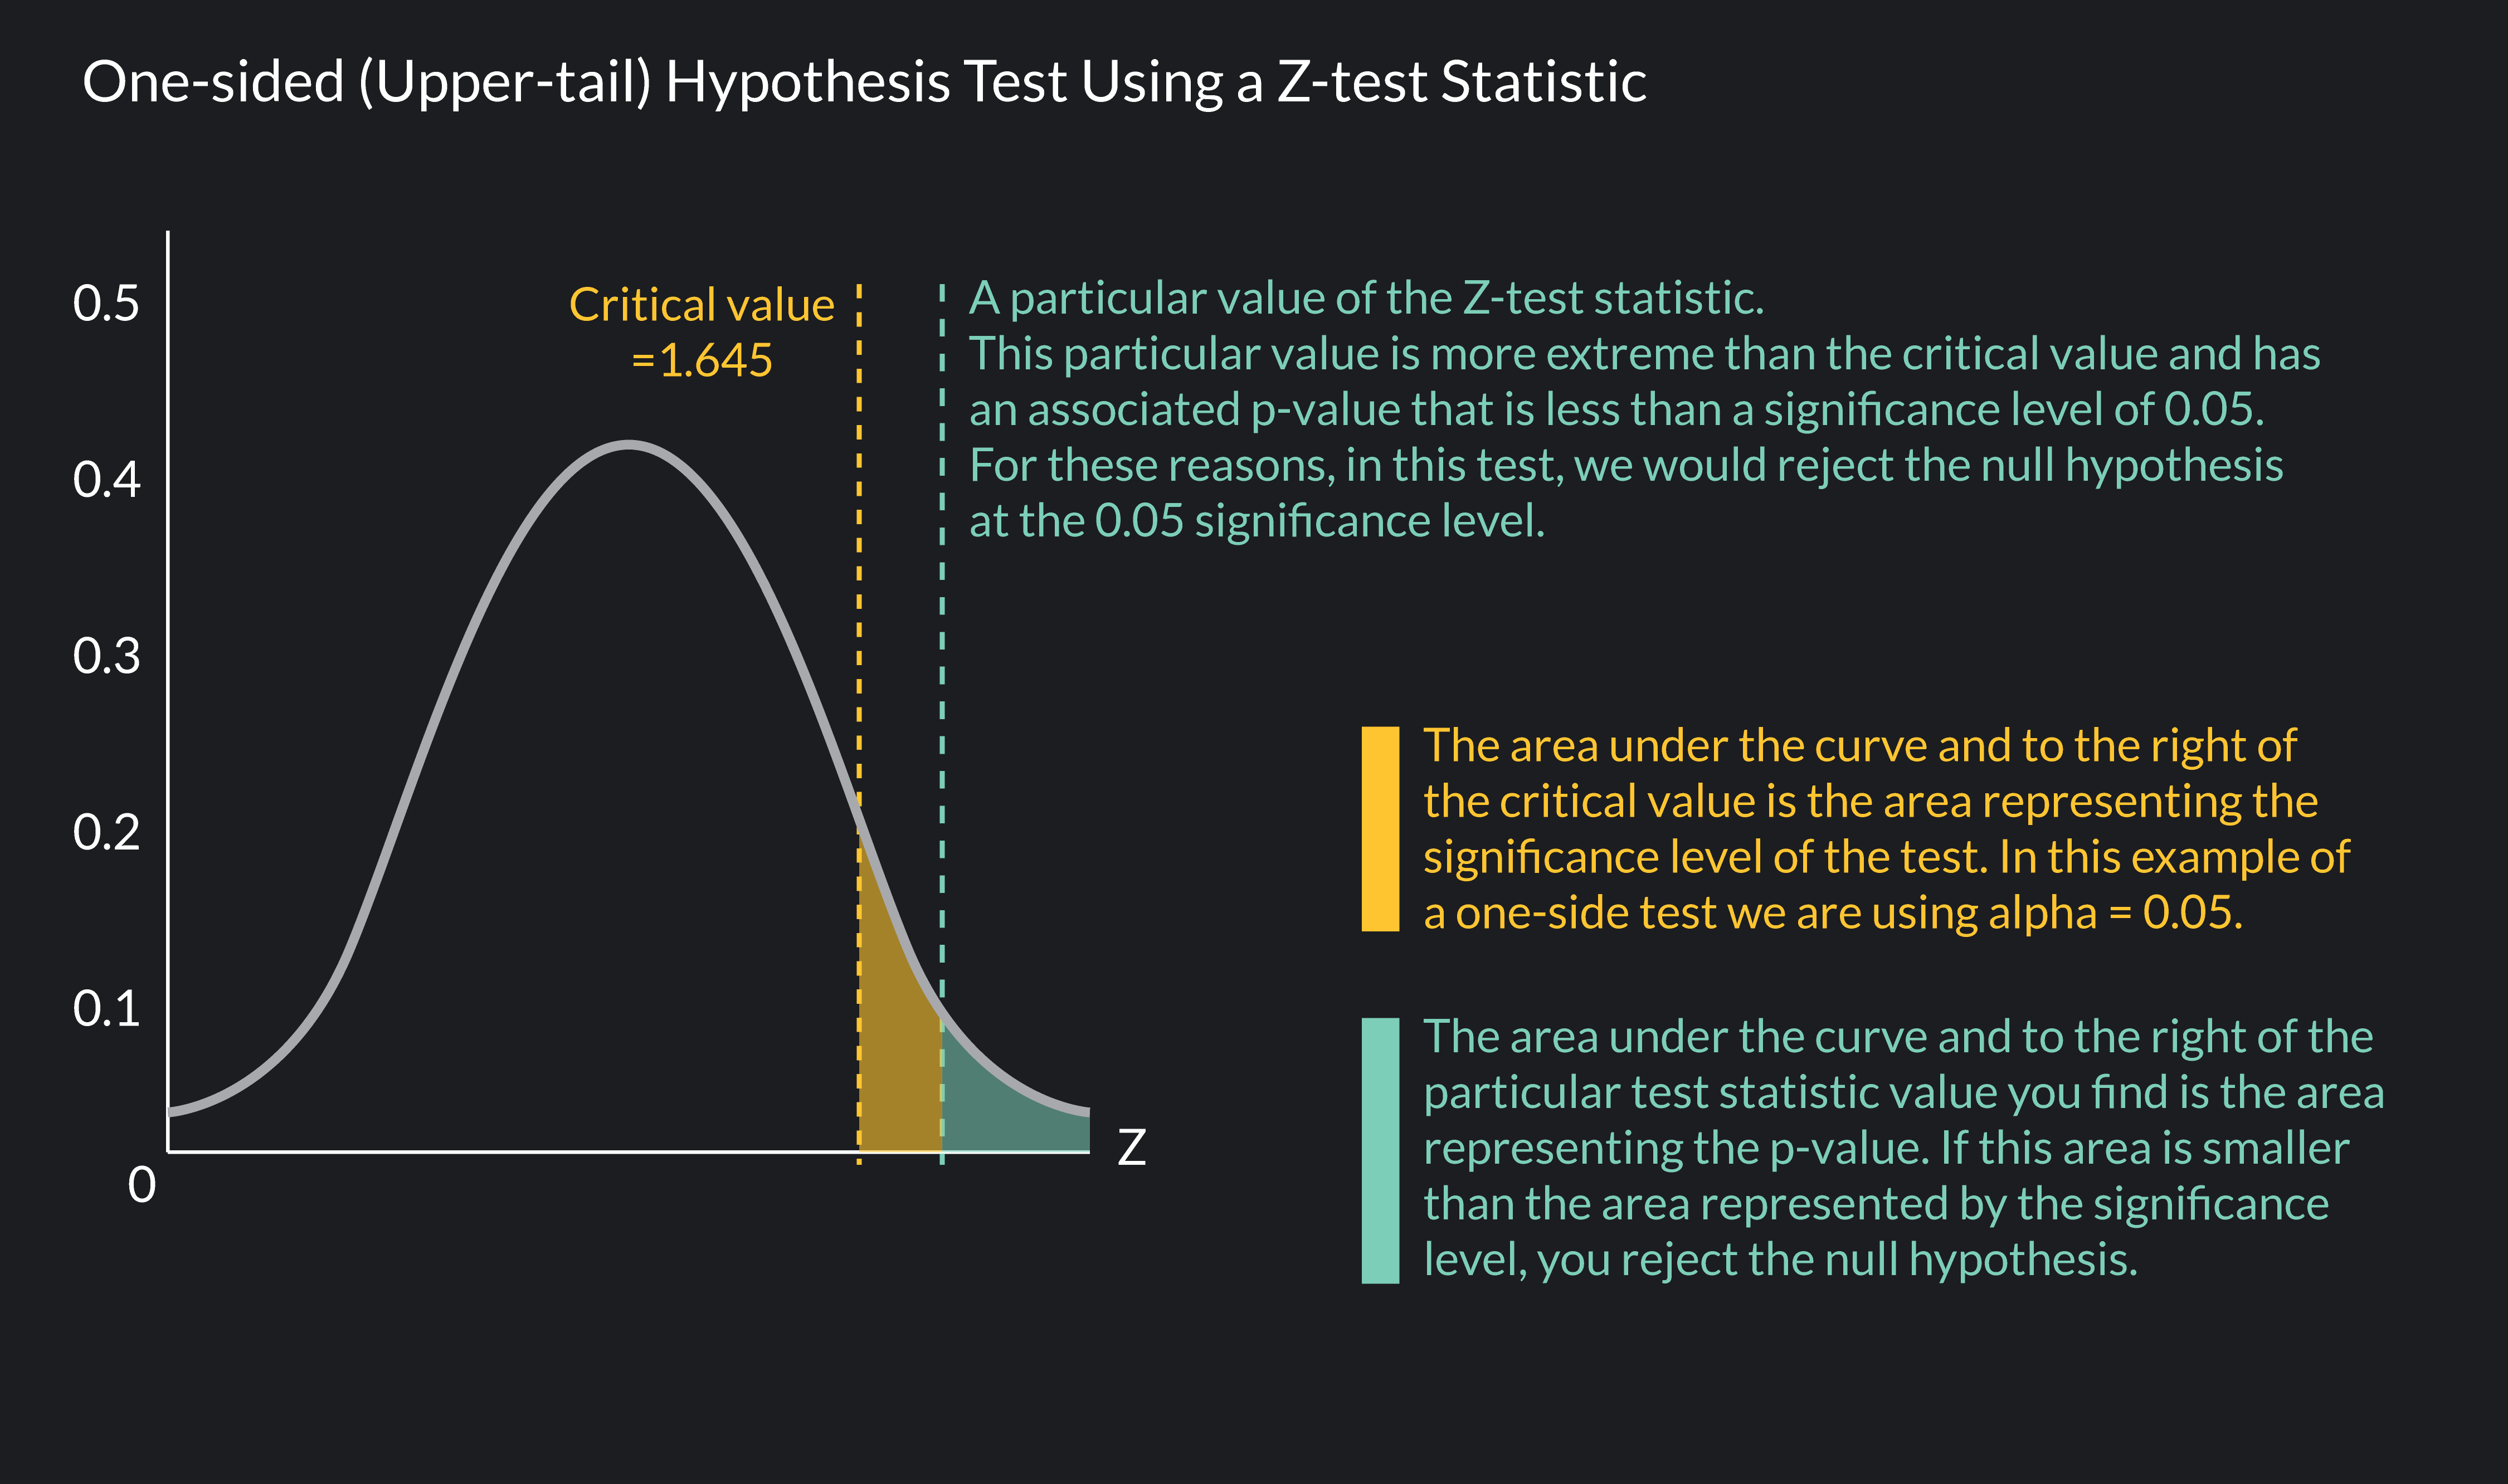
A significance level of 0.05 means that if the probability of observing a sample statistic at least as extreme as the one you observed is less than 0.05 (or 5%), you should reject your null hypothesis. In a one-sided hypothesis test that uses a Z-test statistic, a significance level of 0.05 is associated with a critical value of 1.645 when you conduct the test in the right tail and a value of -1.645 when you conduct the test in the left tail.
A p-value is the probability associated with your test statistic’s value. Let’s say you calculate a Z-test statistic that maps to the standard normal distribution. You find that the test statistic is equal to 1.75. For this value of a Z-test statistic, the associated p-value is 0.04 or 4%—you can find p-values using tables or statistical software.
A p-value of 0.04 means that the probability of observing a sample statistic at least as extreme as the one you found from your sample data is 4%. If you choose a significance level of 0.05 for your test, we would reject the null hypothesis, since the p-value of 0.04 is less than the significance level of 0.05.
It can be easy to confuse test statistics, critical values, significance levels, and p-values. Remember, these are all different measures involved in determining whether to reject or fail to reject a null hypothesis.
Critical values and significance levels provide cut-offs for your test. The difference between a critical value and a significance level is that the critical value is a point on the distribution, and the significance level is a probability represented by an area under the distribution.
You can compare the test statistic and the p-value against the critical value and the significance level.
If the test statistic is more extreme than the critical value, you reject the null hypothesis.
If the p-value is less than the significance level, you reject the null hypothesis.
If the test statistic is less extreme than the critical value, you fail to reject the null hypothesis.
If the p-value is greater than the significance level, you reject the null hypothesis.
Outlier (from the co-founder of MasterClass) has brought together some of the world's best instructors, game designers, and filmmakers to create the future of online college.
Check out these related courses:


Statistics
This article explains what subsets are in statistics and why they are important. You’ll learn about different types of subsets with formulas and examples for each.
Subject Matter Expert

Statistics
Here is an overview of set operations, what they are, properties, examples, and exercises.
Subject Matter Expert

Calculus
Knowing how to find definite integrals is an essential skill in calculus. In this article, we’ll learn the definition of definite integrals, how to evaluate definite integrals, and practice with some examples.
Subject Matter Expert