
Statistics
What Do Subsets Mean in Statistics?
This article explains what subsets are in statistics and why they are important. You’ll learn about different types of subsets with formulas and examples for each.
Sarah Thomas
Subject Matter Expert

Statistics
01.24.2022 • 8 min read
Subject Matter Expert
This article is an overview of the outlier formula and how to calculate it step by step. It’s also packed with examples and FAQs to help you understand it.
In This Article
Take Intro to Statistics Online with Outlier.org
From the co-founder of MasterClass, earn transferable college credits from the University of Pittsburgh (a top 50 global school). The world's best online college courses for 50% less than a traditional college.
Get started
The outlier formula — also known as the 1.5 IQR rule — is a rule of thumb used for identifying outliers. Outliers are extreme values that lie far from the other values in your data set.
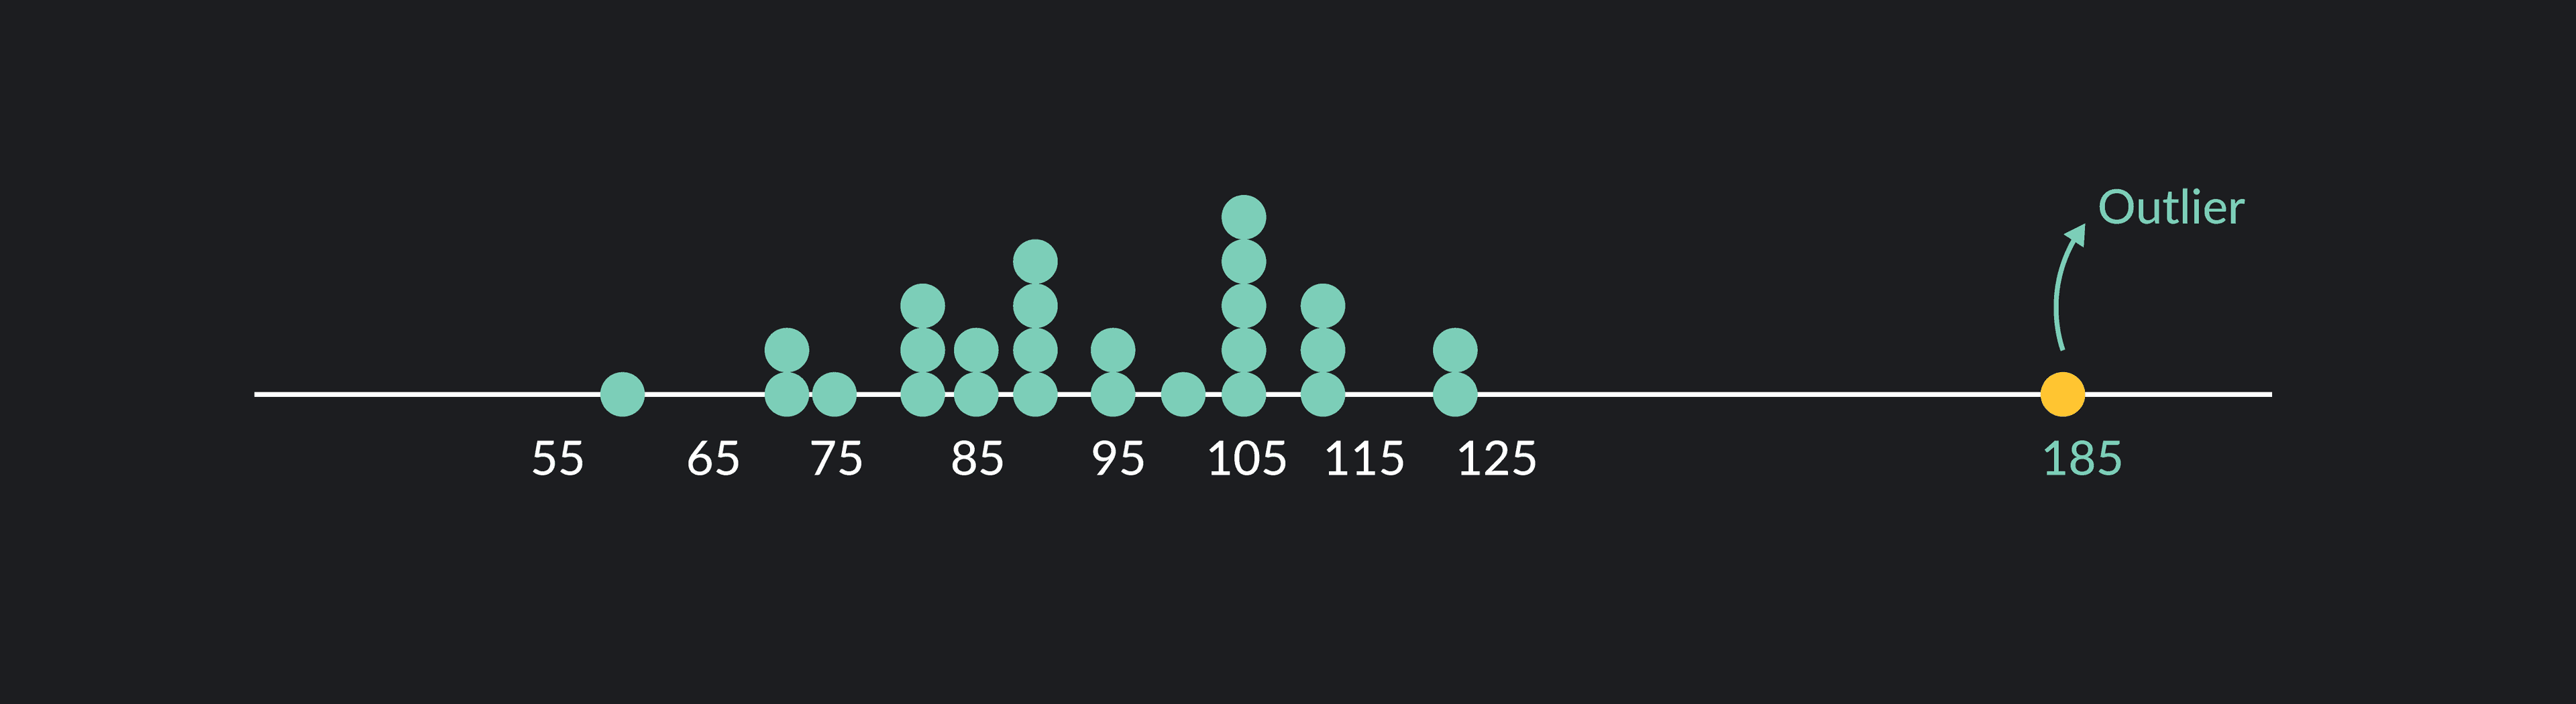
The outlier formula designates outliers based on an upper and lower boundary (you can think of these as cutoff points). Any value that is 1.5 x IQR greater than the third quartile is designated as an outlier and any value that is 1.5 x IQR less than the first quartile is also designated as an outlier.

To use the outlier formula, you need to know what quartiles (Q1, Q2, and Q3) and the interquartile range (IQR) are.
Quartiles (Q1, Q2, Q3) divide a data set into four groups, each containing about 25% (or a quarter) of the data points. There are three quartiles: Q1, Q2, and Q3. Q1 (also known as the first quartile or lower quartile) is the 25th percentile of the data. Q2 (the second quartile) is the 50th percentile or median of the data. Q3 (the third or upper quartile) is the 75th percentile of the data.
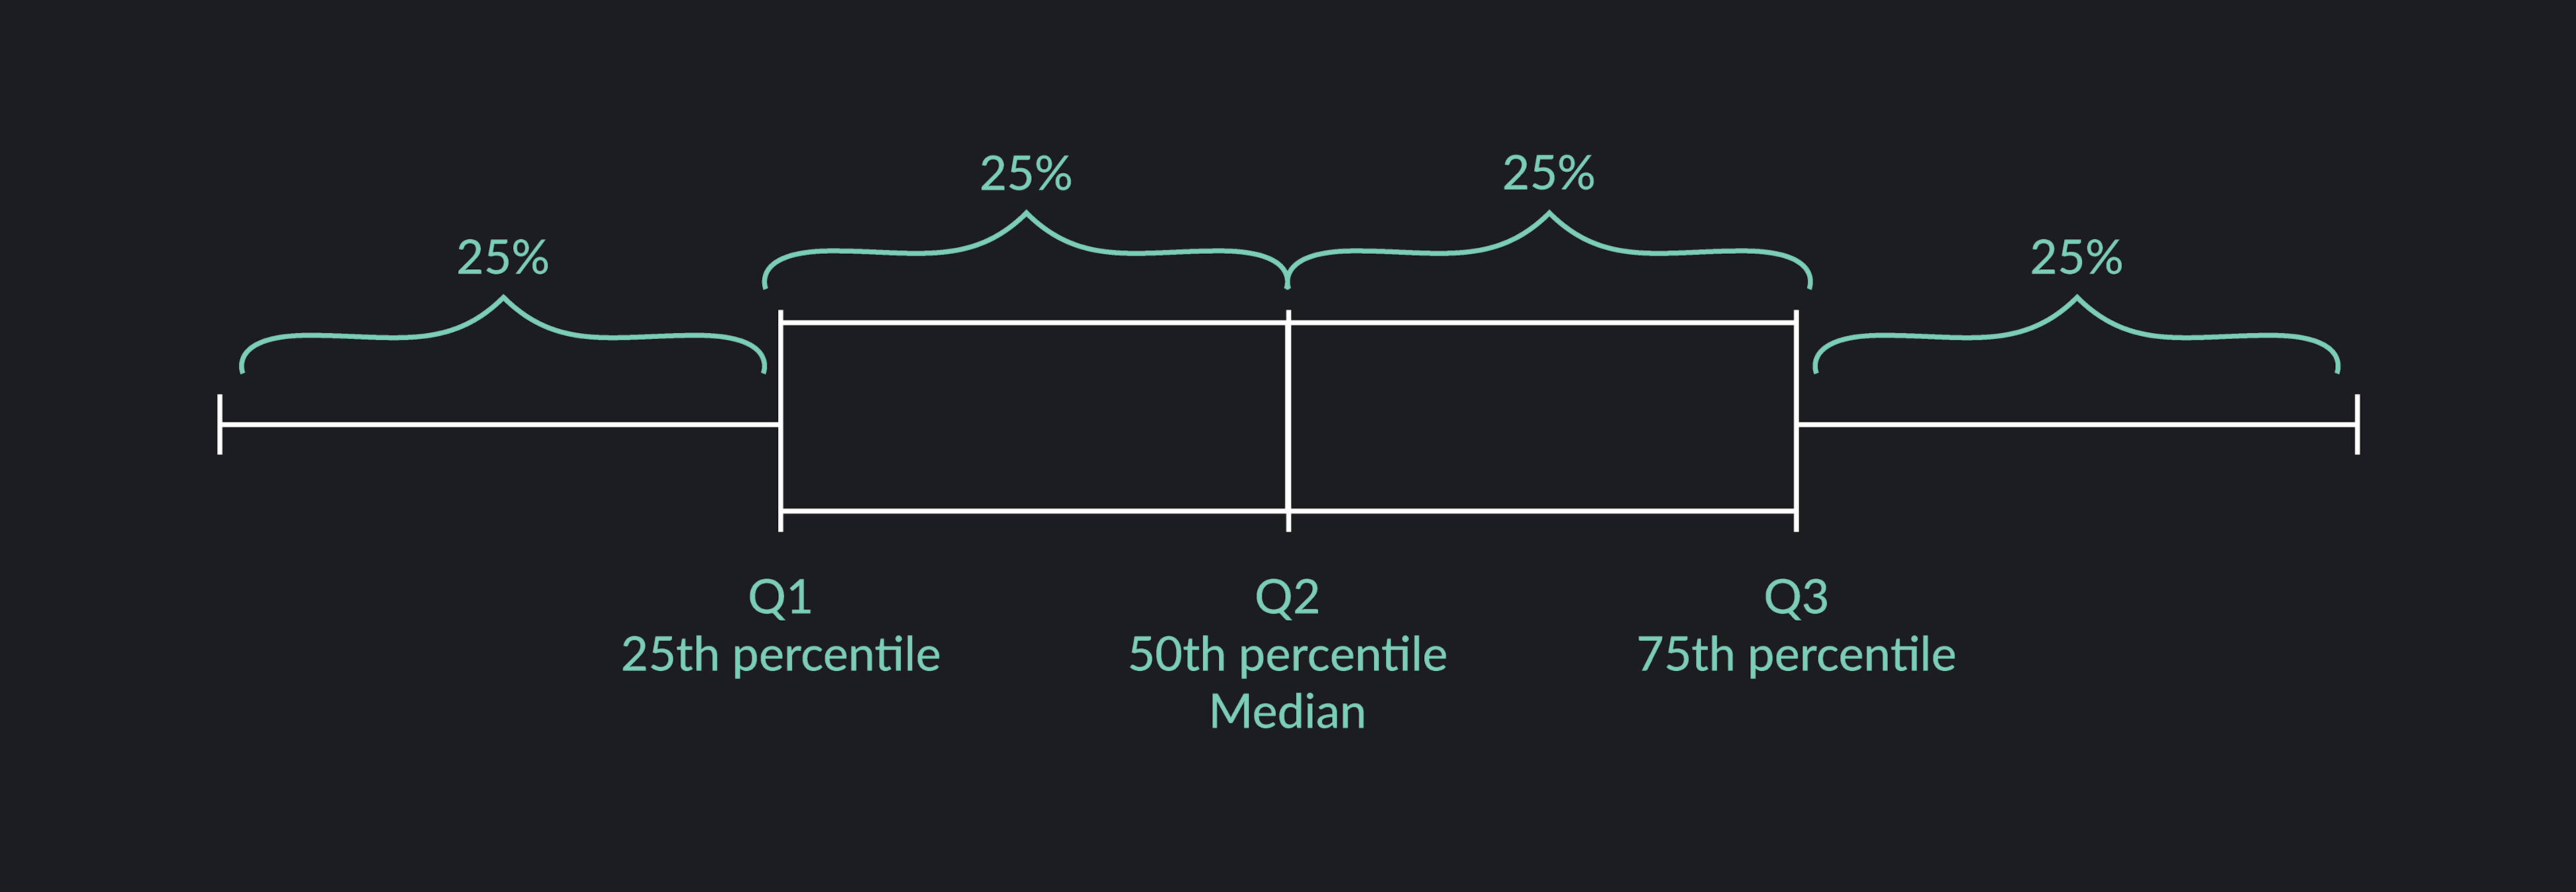
The Interquartile Range (IQR) is the distance between the first and third quartile. Subtract the first quartile from the third quartile to find the interquartile range.
Now that you know what quartiles and the interquartile range are, let’s go through a step-by-step example of using the outlier equation. We’ll use a sample data set containing just 10 data points for this example.
Arrange the data in order from smallest to largest.
Find the first quartile, Q1.
To find Q1, multiply 25/100 by the total number of data points (n). This will give you a locator value, L. If L is a whole number, take the average of the Lth value of the data set and the value. The average will be the first quartile. If L is not a whole number, round L up to the nearest whole number and find the corresponding value in the data set. That will be the first quartile.
2.5 is not a whole number, so round up the nearest whole number to get 3. The 3rd value in the data set is 22. Q1 = 22
Find the third quartile, Q3.
To find Q3, use the same method used to find Q1, except this time, multiply 75/100 by n to get the locator value, L.
7.5 is not a whole number, so round up the nearest whole number to get 8. The 8th value in the data set is 35. Q3 = 35
Find the interquartile range, IQR.
Remember, the interquartile range is the difference between Q3 and Q1.
Find the upper boundary.
Find the lower boundary.
Identify the outliers.
The outliers are any data points that lie above the upper boundary or below the lower boundary. In this case, the outliers are 2 and 59.

Here are three more examples. See if you can identify outliers using the outlier formula.
The data below shows a high school basketball player’s points per game in 10 consecutive games. Use the outlier formula and the given data to identify potential outliers.
The data below shows the number of daily visitors to a museum. Use the given data and outlier formula to identify potential outliers.
The data below shows the annual rainfall in a tropical rainforest. For ease, the data are already arranged from least to greatest. Use the given data and outlier formula to identify potential outliers.
Outliers: 51. Q1 = 22, Q3 = 33, IQR = 11, lower boundary = 5.5, upper boundary = 49.5
Outliers: 503. Q1 = 675, Q3 = 736, IQR = 61, lower boundary = 583.5, upper boundary = 827.5.
Note that there are only 8 data points (n=8). When calculating Q1 and Q3, the locator value L is a whole number.
To find Q1, you need to take the average of the 2nd and 3rd values of the data set. To find Q3, you need to take the average of the 6th and 7th values.
There are no outliers in this data set. Q1 = 220, Q3 = 320, IQR = 100, lower boundary = 70, upper boundary = 470
While it’s important to know what the outlier formula is and how to find outliers by hand, more often than not, you will use statistical software to identify outliers.
Follow these steps to use the outlier formula in Excel, Google Sheets, Desmos, or R.
Note that there are several accepted ways to calculate quartiles. Some of the software below uses different approaches to calculating quartiles than what we used in the examples above. Don’t worry. The difference in the calculations won’t be enough to alter your results significantly.
You can use the Outlier formula in Excel or Google sheets using the following steps.
To find the first quartile use the formula =QUARTILE(Data Range; 1)
For example, if your data is in cells A2 through A11, you would type =QUARTLE(A2:A11, 1)
To find the third quartile use the formula =QUARTILE(Range; 3)
For example, if your data is in cells A1 through A10, you would type =QUARTLE(A2:A11, 3)
Subtract Q3 from Q1
Calculate the upper boundary: Q3 + (1.5)(IQR)
Calculate the lower boundary: Q1 - (1.5)(IQR)

You can use the Outlier formula in Desmos using the following steps.
Create a table and input your data in the x1 column.
Use the function stats(x1) to find Q1 and Q3 for your data.
Subtract Q1 from Q3 to get the interquartile range.
Calculate the upper boundary: Q3 + (1.5)(IQR)
Calculate the lower boundary: Q1 - (1.5)(IQR)
You can use the Outlier formula in R using the following steps.
Save your data using the assign operator, < -, and the combine function c(). Give the data a name like mydata.
For example, say your data consists of the following values (15, 21, 25, 29, 32, 33, 40, 41, 49, 72).
Type: mydata <-c(15, 21, 25, 29, 32, 33, 40, 41, 49, 72)
Use the summary function to find Q1 and Q3. Type: summary(mydata)
Use the IQR function to find the interquartile range. Type: IQR(mydata)
Calculate the upper boundary: Q3 + (1.5)(IQR)
Calculate the lower boundary: Q1 - (1.5)(IQR)
For practice, try using one or more of these programs to find the outliers from the examples we covered in the previous section.
Here are some frequently asked questions about the outlier formula.
There isn’t a clear and fast rule about when you should (or shouldn’t) remove outliers from your data. Outliers can occur for different reasons. Sometimes, outliers result from an error that occurred during the data collection process. If it’s obvious that an outlier results from a data collection error, it’s safe to remove it. You might also choose to re-measure the data point if you can.
If you’re not sure if an outlier results from an error, your first instinct shouldn’t be to remove it. The outlier may provide some important insights about your data, and if you remove it, those insights will be lost. A better solution would be to adjust your method of analysis and to think carefully about why the outlier exists. You might also choose to run your analysis with and without the outlier and present both sets of results for the sake of transparency.
Yes. If your data contains negative values, outliers can be negative numbers.
The mean of the data set is sensitive to outliers, so removing an outlier can dramatically change the value of the mean. If you remove a positive outlier, the mean will decrease. If you remove a negative outlier, the mean will increase.
The median of the data set is resistant to outliers, so removing an outlier shouldn’t dramatically change the value of the median. After removing an outlier, the value of the median can change slightly, but the new median shouldn’t be too far from its original value.
Yes. Values that lie in a normal distribution’s extreme right and left tails can be considered outliers. You can use Z-scores to identify outliers in a normal distribution. If you apply the outlier formula, any value in a normal distribution with a Z-score above 2.68 or below -2.68 should be considered an outlier.
For more on normal distribution, Duke University's Dr. Olanrewaju Michael Akande gives an overview.
Yes. It’s possible to have more than one outlier in your data.
No. The outlier formula is a commonly used and straightforward method, but there are other ways to identify outliers. Statisticians will often plot their data on graphs such as box plots and scatterplots to identify outliers. They may also use regression, hypothesis testing, and Z-scores to identify outliers.
Outlier (from the co-founder of MasterClass) has brought together some of the world's best instructors, game designers, and filmmakers to create the future of online college.
Check out these related courses:


Statistics
This article explains what subsets are in statistics and why they are important. You’ll learn about different types of subsets with formulas and examples for each.
Subject Matter Expert

Statistics
Here is an overview of set operations, what they are, properties, examples, and exercises.
Subject Matter Expert

Calculus
Knowing how to find definite integrals is an essential skill in calculus. In this article, we’ll learn the definition of definite integrals, how to evaluate definite integrals, and practice with some examples.
Subject Matter Expert