
Economics
Understanding the Supply Curve & How It Works
Learn about what a supply curve is, how a supply curve works, examples, and a quick overview of the law of demand and supply.
Alejandro Diaz Herrera
Subject Matter Expert

Economics
05.26.2022 • 11 min read
Subject Matter Expert
Learn what a labor market is, the factors that produce a shift in the labor market supply curve and demand curve, and their relationship to price floors.
In This Article
Equilibrium in Perfectly Competitive and Monopsonistic Labor Markets
US Labor Market: Labor Force Participation and the Unemployment Rate
A labor market is a market where individuals provide their labor to businesses in exchange for a wage or a salary. The term “labor market” can refer broadly to the entire workforce of an economy (such as the US labor market), but it can also refer to labor markets in a given industry or for a particular geographic region (such as the labor market for retail workers or the labor market in Dallas, Texas).
Just like you can use supply and demand diagrams to model markets for goods and services, you can use supply and demand diagrams to model labor markets.
In a labor market, firms and employers who want to hire workers are on the demand side of the market, and workers who are willing to provide their labor to firms in exchange for a wage or salary are on the supply side of the market. The vertical axis in the supply and demand diagram measures the wage rate or salary in the market and the horizontal axis measures the quantity of labor—often in terms of the number of workers employed or the number of hours of work that employers pay for.
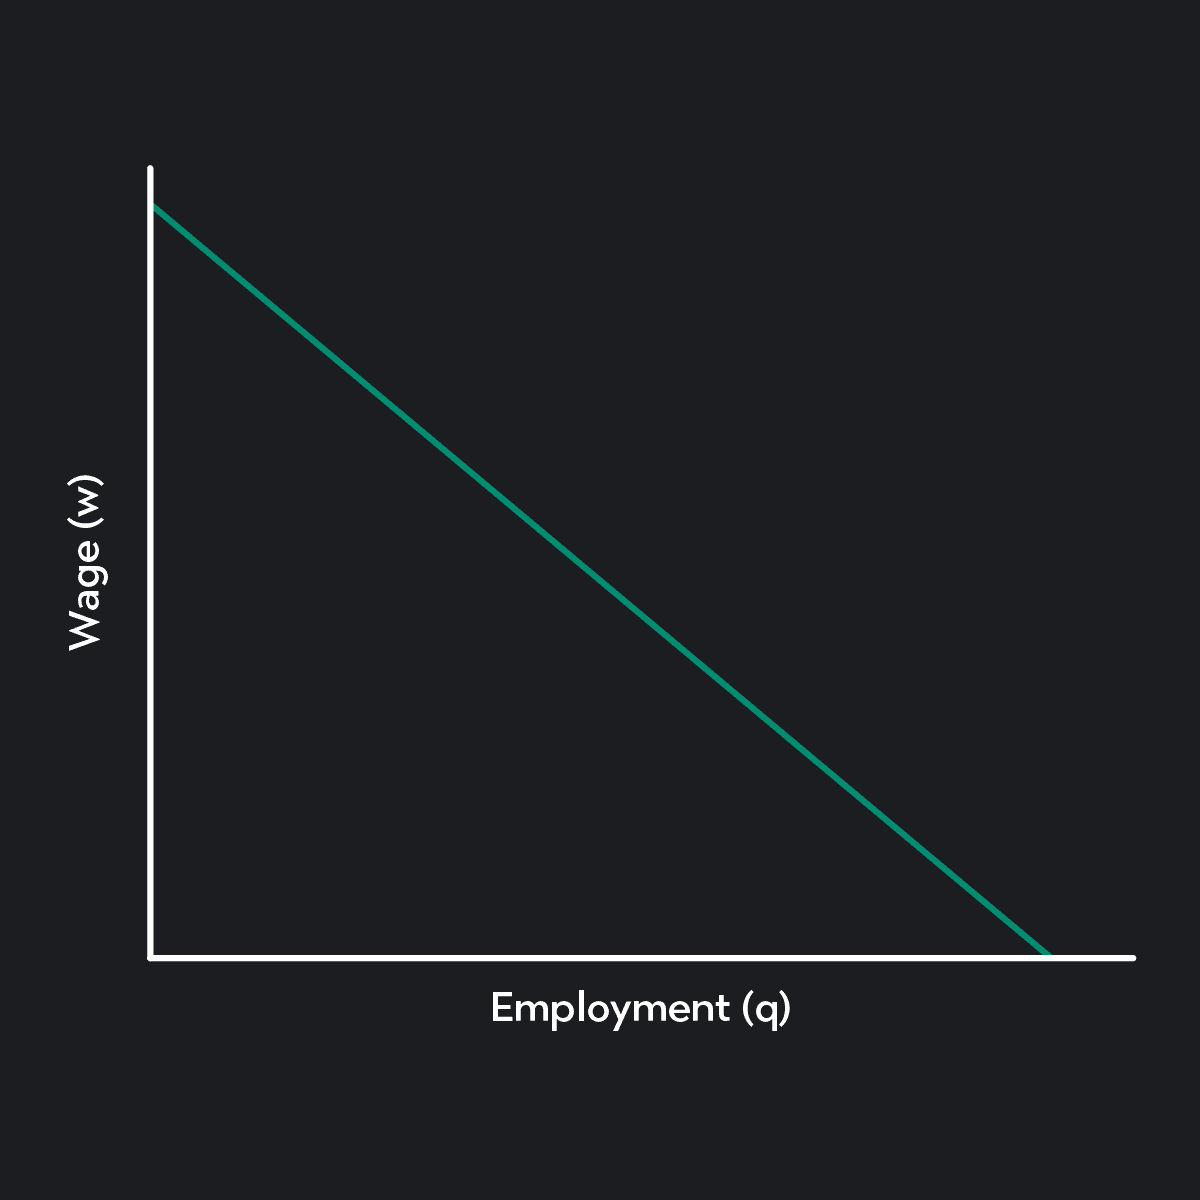
The labor demand curve is downward sloping. This reflects the law of demand—the idea that ceteris paribus, employers are willing to hire more workers at lower wages and fewer workers at higher wages.
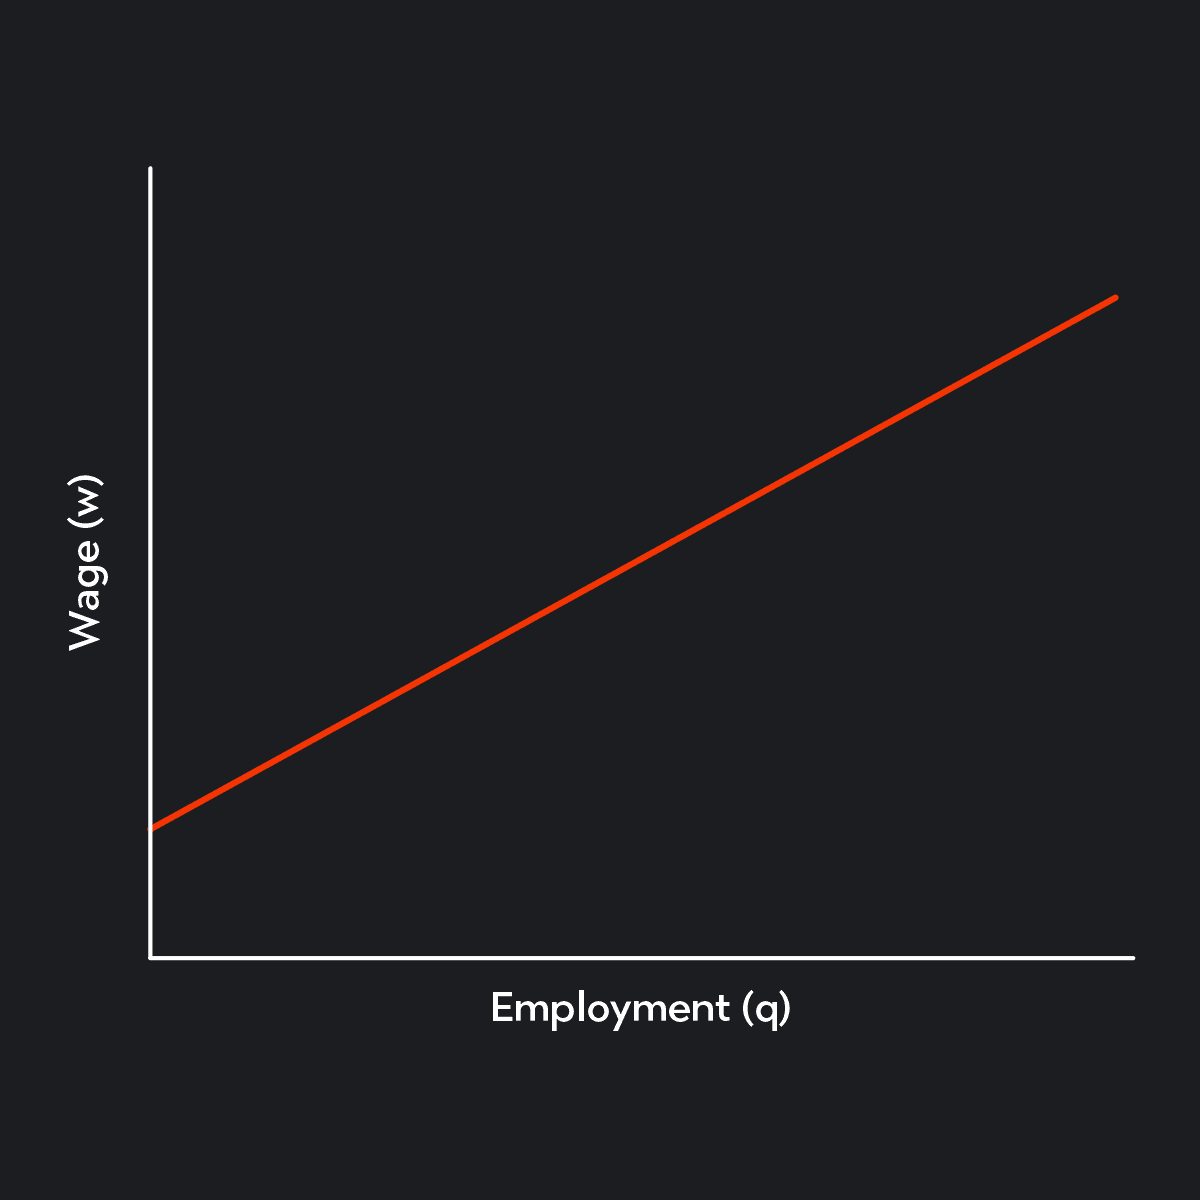
The labor supply curve is upward sloping. This reflects the law of supply—the idea that ceteris paribus, the number of workers who are willing to work will be greater at a high wage and lower at a low wage.
We can model labor markets in different ways depending on what you assume to be true about a particular labor market. Two common models of labor markets are perfect competition and monopsony.
In a perfectly competitive labor market, there are many employers and many workers who are competing for the same type of job. No single employer or worker exercises market power, and all employers and workers must accept the wage set by the market. This model is analogous to the model of perfect competition in the market for goods and services.
Monopsony is a model of labor markets where there is only one employer, but many workers looking for a job. Being the sole employer on the demand side of the market, the employer in a monopsony has a great deal of market power and can set wages at their discretion. The profit-maximizing wage in a monopsonistic labor market will always be a lower wage than what the employer would have been forced to offer if the labor market was competitive. This model is somewhat analogous to the model of monopoly in the market for goods and services.
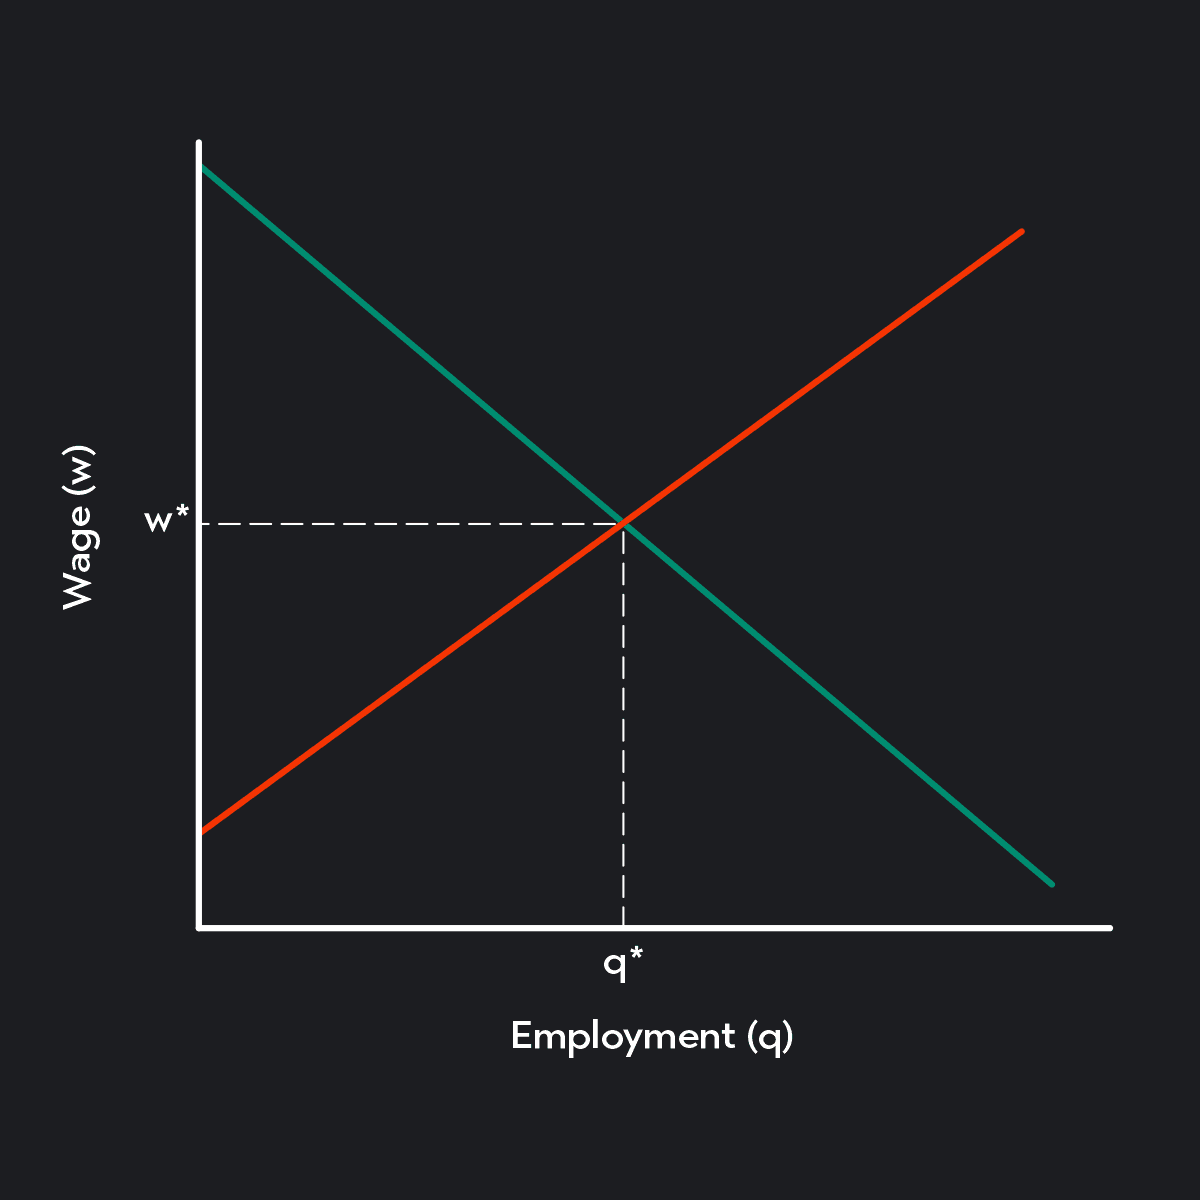
In a perfectly competitive labor market, the interaction of supply and demand sets wages. The equilibrium wage or the market wage is w*, and it’ll be set where the supply of labor equals the demand for labor. The equilibrium also determines the level of employment in the market, q*.
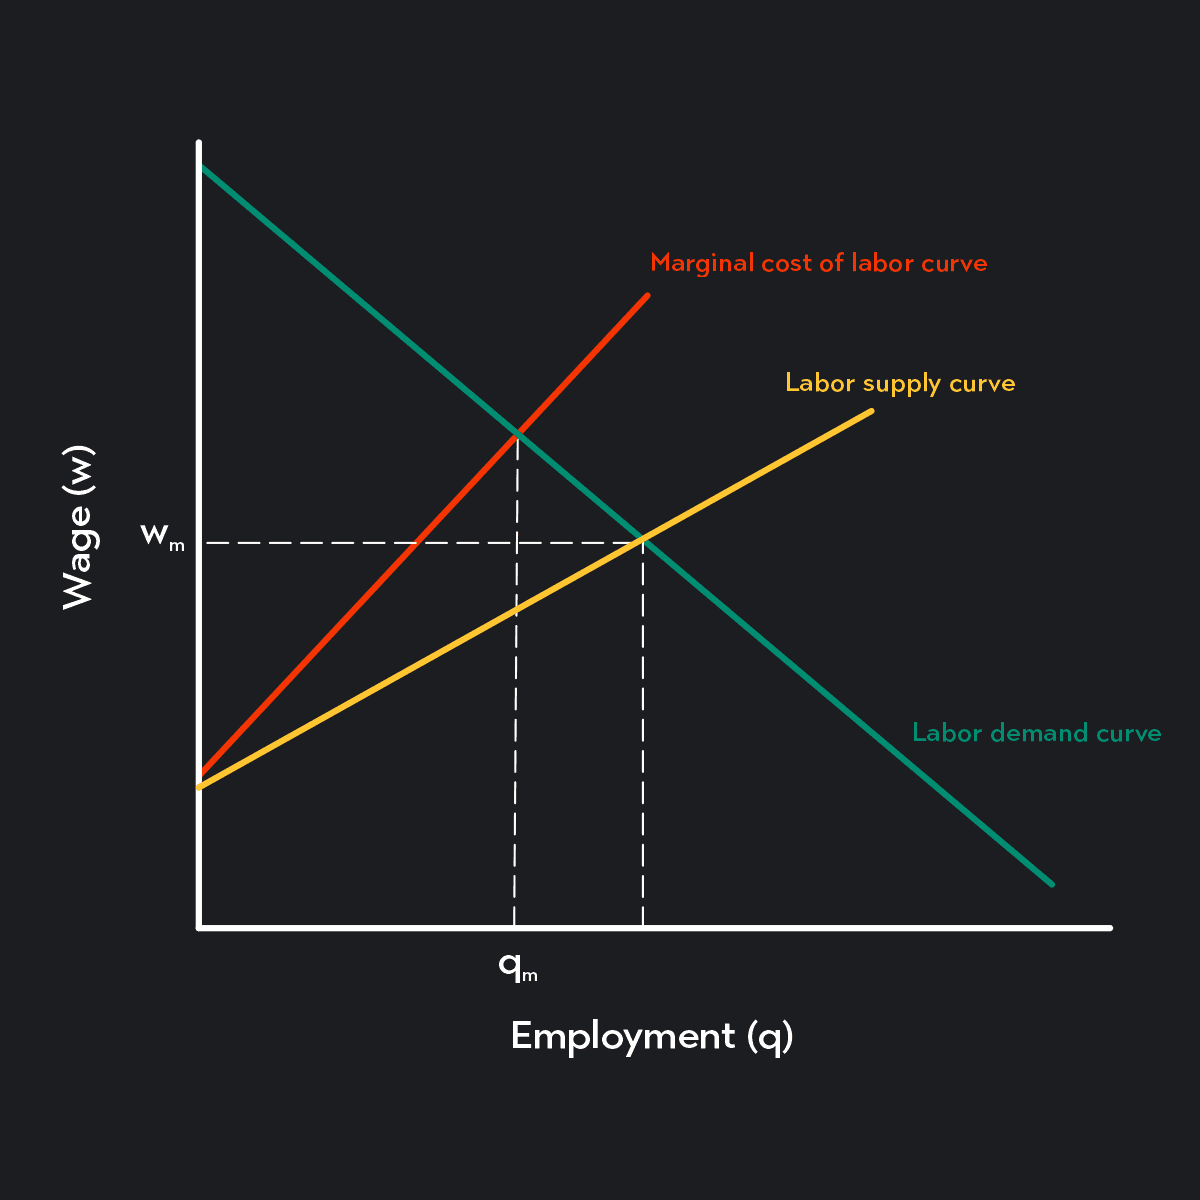
In a monopsonistic labor market, the one employer in the market sets the wage.
To maximize profits, the employer sets the level of employment, , where the marginal cost of labor intersects the demand curve.
The wage that the employer offers, , is found by tracing the quantity of workers up to the labor supply curve and across and to the left to the vertical “wage” axis.
Several factors can cause the labor demand curve to shift inward to the left or outward to the right. These are factors that increase the overall level of demand for workers (in the case of an outward shift) or factors that reduce the overall level of demand for workers (in the case of an inward shift).
A decrease in the price of the good or service being produced.
Example: All else being equal, if the price of a cup of coffee goes down, the demand for baristas will decrease and shift inward to the left.
A decrease in the demand for the good or service being produced.
Example: All else being equal, if demand for bus rides declines, the demand for bus drivers will decrease.
A decrease in the productivity of labor.
Example: All else being equal, if a certain type of office worker becomes less productive, demand for those workers would decrease.
A new technology that serves as a substitute for labor.
Example: All else being equal, the introduction of cashier-less cash registers will decrease demand for cashiers.
An increase in the price of a complementary factor of production (a complementary factor of production is another input in the production process that complements the work of labor).
Example: All else being equal, if the price of lumber increases, demand for contractors and construction workers will decrease.
A decrease in the price of another factor of production that substitutes the work of labor.
Example: All else being equal, if the price of robotic vacuums decreases, demand for cleaners will decrease.
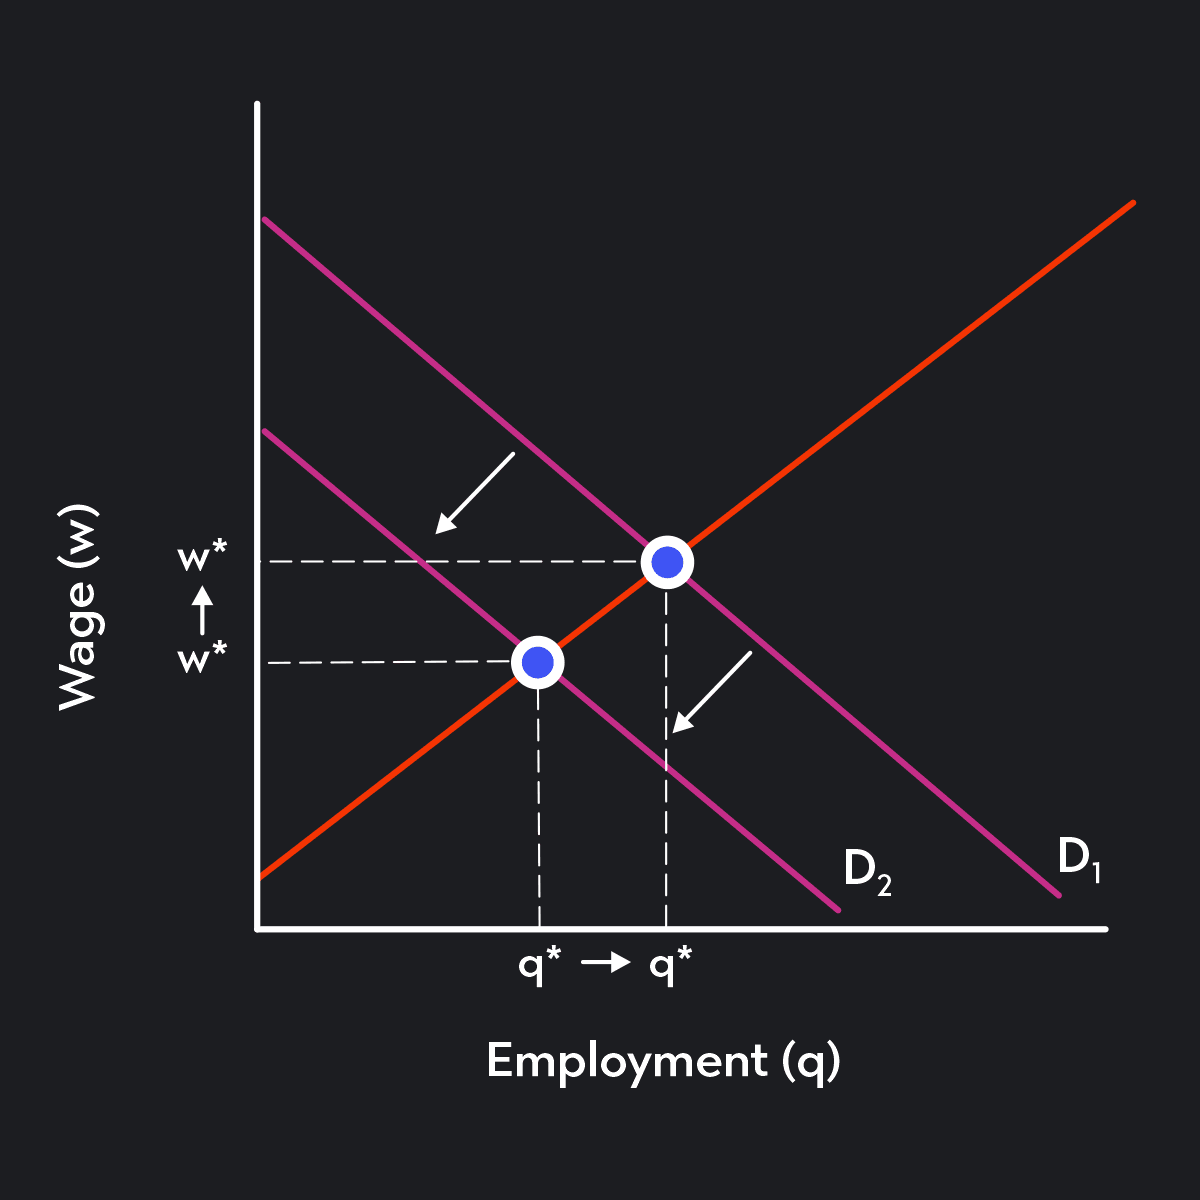
All else being equal, an inward shift of the labor demand curve will cause both the equilibrium wage (w*) and the equilibrium level of employment (q*) to fall.
An increase in the price of the good or service being produced.
Example: All else being equal, if the price of coffee sold in cafes increases, demand for baristas will increase (shift outward to the right).
An increase in demand for the good or service being produced.
Example: All else being equal, if demand for bus rides increases, the demand for bus drivers will increase.
An increase in the productivity of labor.
Example: All else being equal, if a particular type of office worker becomes more productive, demand for those workers will increase.
A new technology that serves as a complement for labor.
Example: All else being equal, the introduction of ride-hailing apps will increase the demand for drivers for hire.
A decrease in the price of another factor of production that complements the work of labor.
Example: All else being equal, if the price of lumber decreases, demand for contractors and construction workers will increase.
An increase in the price of another factor of production that substitutes the work of labor.
Example: All else being equal, if the price of robotic vacuums increases, demand for cleaners will increase.
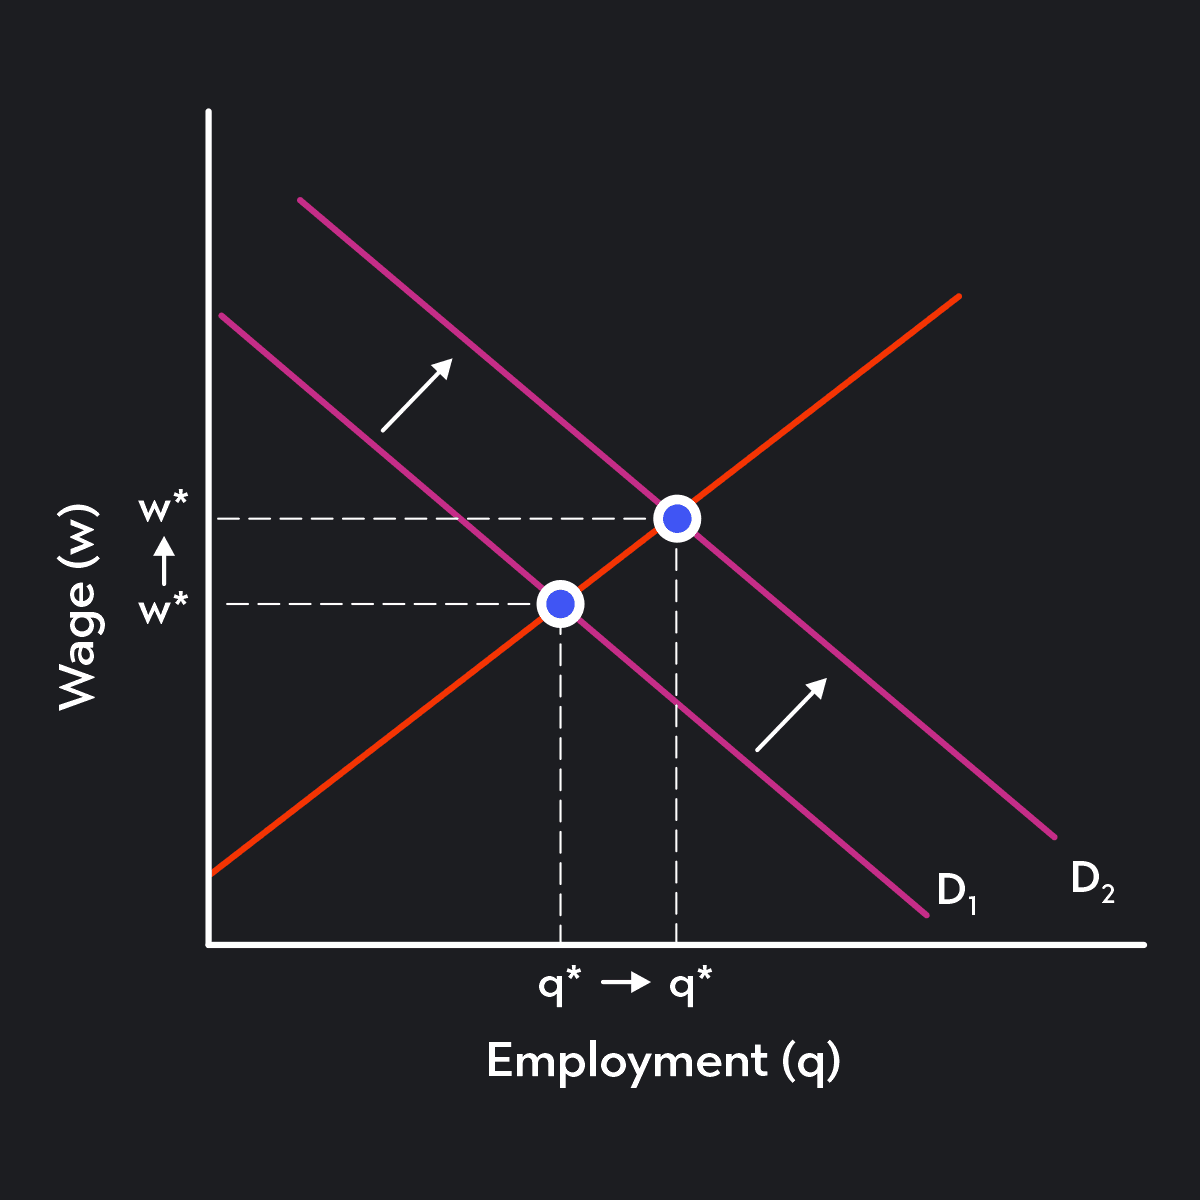
All else being equal, an outward shift of the labor demand curve will cause both the equilibrium wage (w*) and the equilibrium level of employment (q*) to rise.
Several factors can cause the labor supply curve to shift inward to the left or outward to the right. These are factors that either encourage more workers to join the market (in the case of an outward shift) or factors that encourage more workers to leave the market (in the case of an inward shift).
An increase in the wages offered by a substitutable job.
Example: All else being equal, if the wage offered at restaurants increases, the supply of baristas could decrease.
A decrease in the population of people who qualify for the job.
Example: All else being equal, if a large swath of young working-age people leaves a small town, the supply of labor in the town will decrease.
New or higher barriers to entry (such as additional requirements needed to qualify for the job).
Example: All else being equal, if a law is passed that requires all florists to take a course and get certified before being hired, the supply of florists will decrease.
A reduction in worker benefits or other non-monetary rewards received from being employed.
Example: All else being equal, if employers decide to eliminate their paid-leave policies, the supply of labor will decrease.
Changes in the preferences of workers towards leisure or other activities.
Example: All else being equal, a pandemic that shifts workers' attention towards their health or to the care and well-being of those around them, could shift the supply of labor to the left.
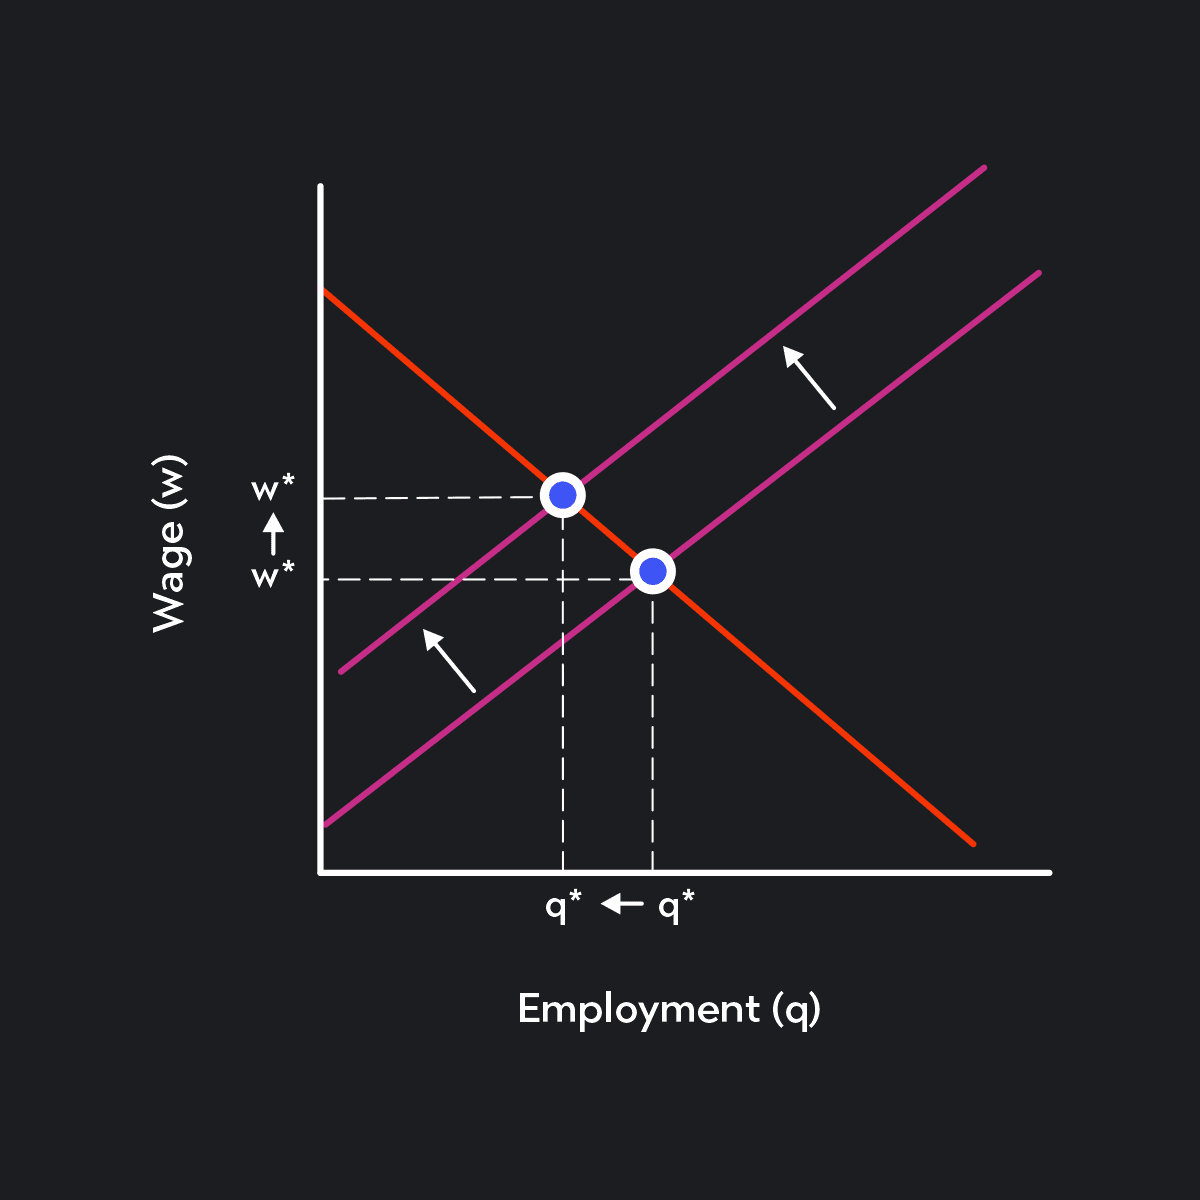
All else being equal, an inward shift of the labor supply curve will increase the equilibrium wage (w*) and reduce the equilibrium level of employment or the equilibrium number of hours worked (q*) in the market.
A decrease in the wages offered by a substitutable job.
Example: All else being equal, if the wage offered at restaurants decreases, the supply of baristas could increase.
A decrease in the population of people who qualify for the job.
Example: All else being equal, if the number of working-age immigrants to a small town increases, the supply of labor in the town will increase.
Reduced barriers to entry (such as the removal of requirements to qualify for the job).
Example: All else being equal, if school teachers no longer need to be certified to teach at a public school, the supply of school teachers would increase.
An improvement in worker benefits or other non-monetary rewards received from being employed.
Example: All else being equal if employers decide to extend their paid-leave policies, the supply of labor will increase.
Changes in the preferences of workers towards work.
Example: All else being equal, if workers' preferences shift away from leisure time, child care, and other non-work activities the supply of labor could increase.
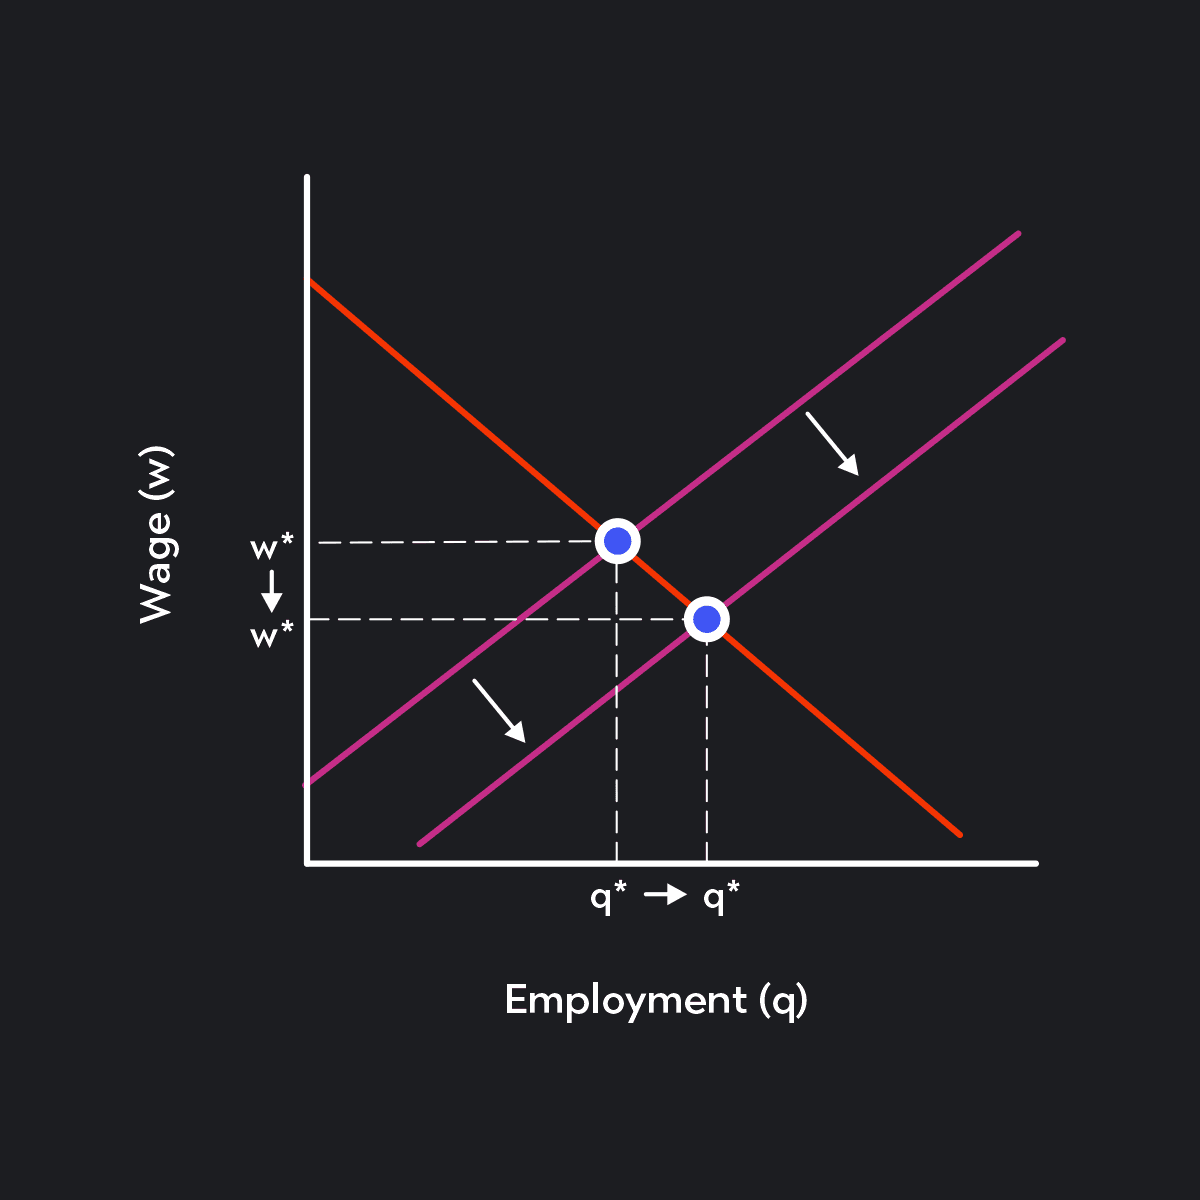
All else being equal, an outward shift of the labor supply curve will reduce the equilibrium wage (w*) and increase the equilibrium level of employment or the equilibrium number of hours worked (q*) in the market.
The US labor market consists of roughly half of the US population. In 2021, there were approximately 330 million Americans, and of them, 260 million were of working age (working age being over 16 years old). Of these 260 million, roughly 160 million were employed or looking for work.
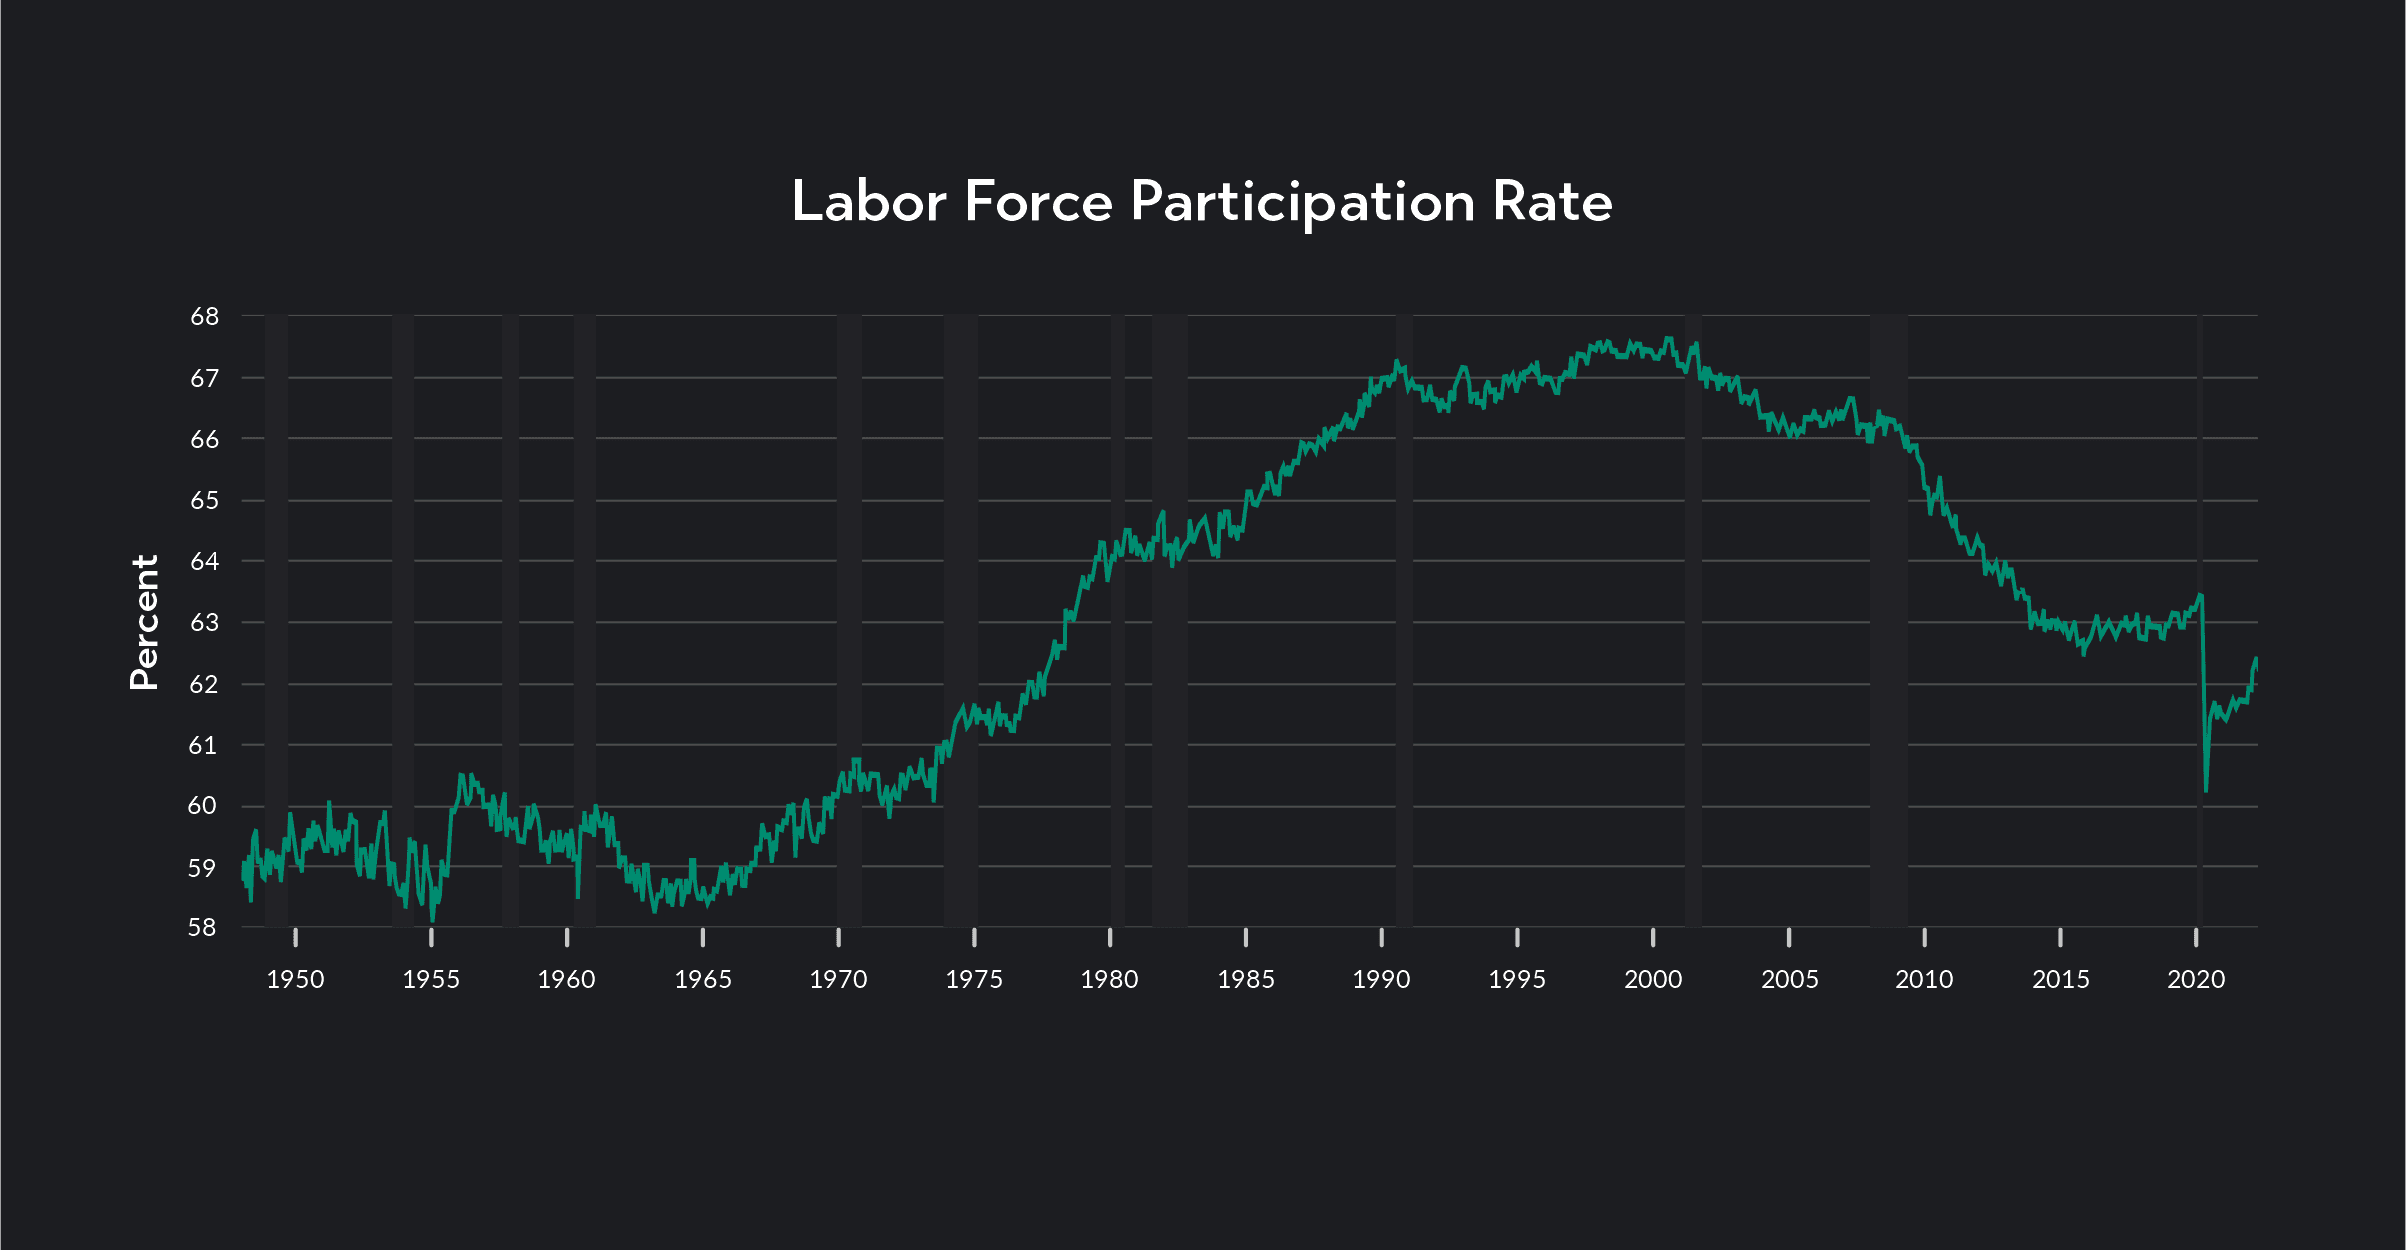
The population of working-age individuals in the United States who are either employed or looking for work is called the labor force. The number of individuals in the labor force as a percentage of the total working-age population is called the labor force participation rate.
For the last 50 years, the labor force participation rate in the United States has been between 60% and 67%.
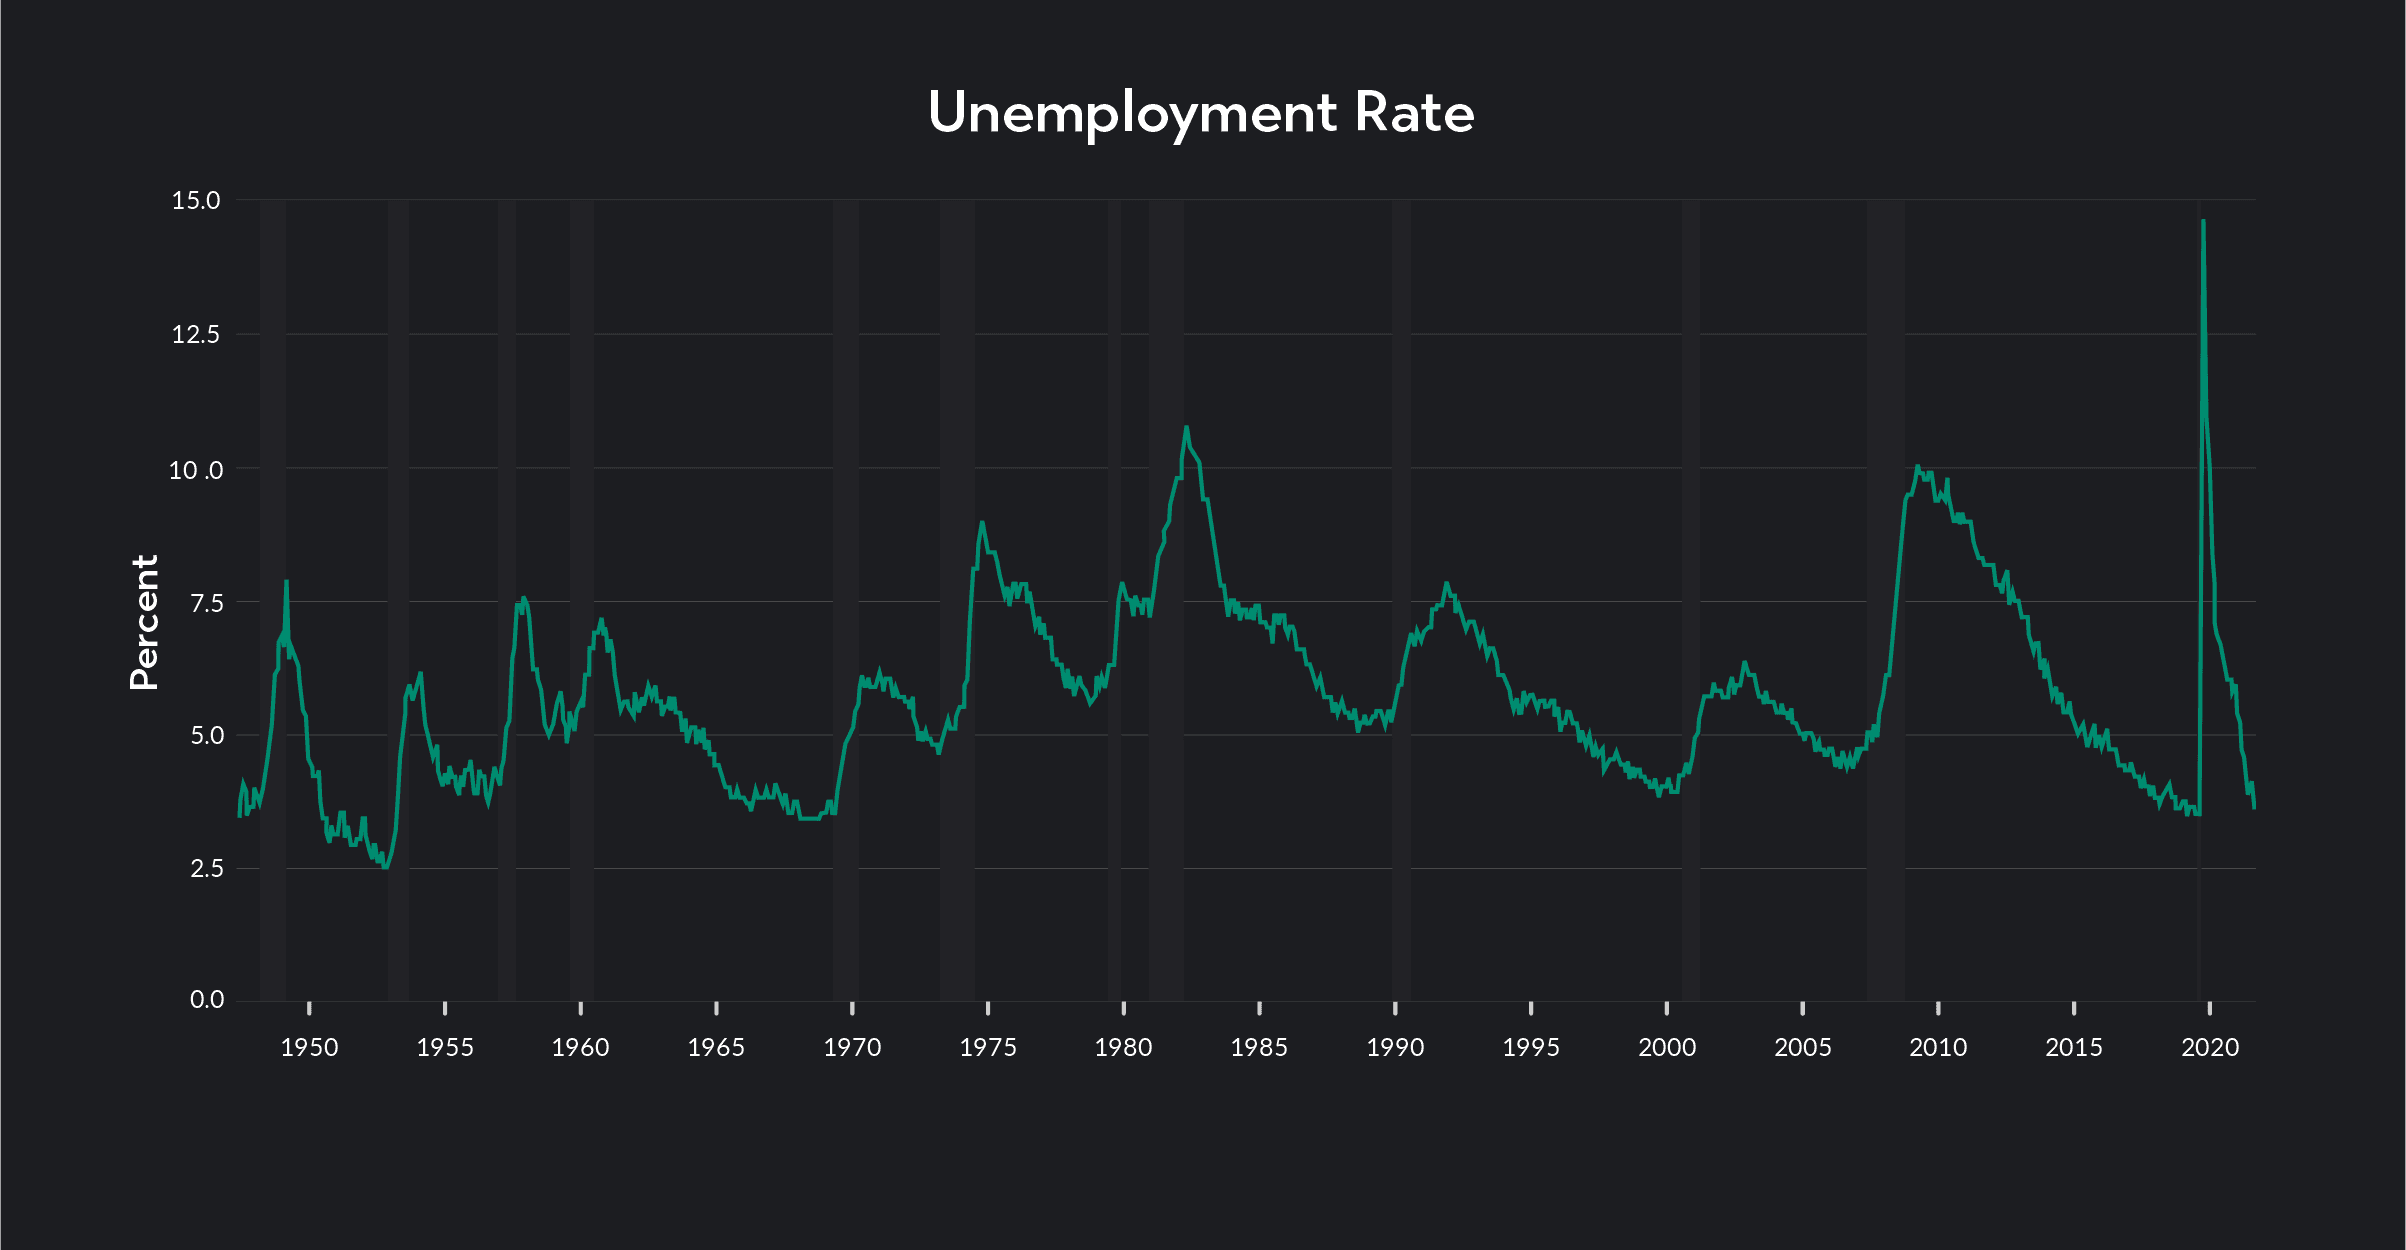
Within the labor force, those who are looking for work but are unable to find jobs are considered unemployed. The number of unemployed workers as a percentage of the overall labor force is called the unemployment rate.
Over the last 50 years, the unemployment rate in the United States has fluctuated from as low as 3% to as high as 14.7%. The unemployment rate hit 14.7% in April 2020 at the start of the COVID-19 pandemic.
In economics, a price floor is a restriction that prevents prices from falling below a certain level.
In a labor market, a price floor is called a minimum wage, and it prevents employers from hiring workers below a specified level. In the United States, federal, state, and local governments have the power to set a minimum wage. In 2022, the Federal minimum wage was $7.25 per hour, but state minimum wages ranged from $7.25 per hour to $14 per hour.
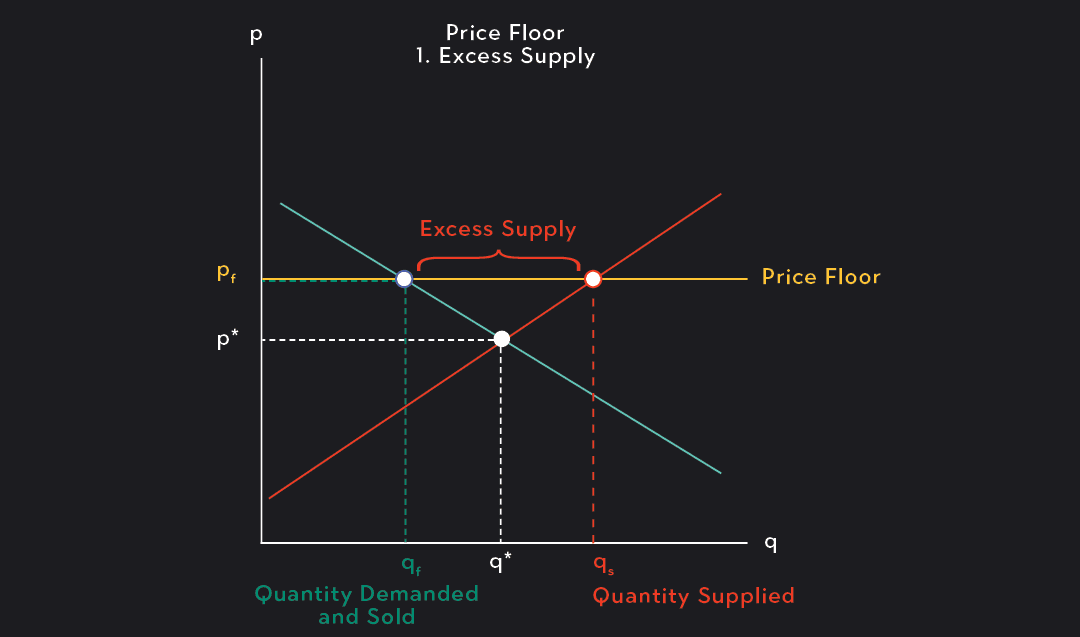
The graph above shows the effects of a price floor in a perfectly competitive market.
The effects of implementing (or raising) minimum wages are a matter of considerable debate. If you assume that the market for low-wage labor is competitive, a price floor on wages can create unemployment due to a reduction in the quantity of labor demanded and an increase in the quantity of labor supplied. Workers who remain employed benefit from the wage increase, but there will also be workers who could have been employed at the equilibrium wage that will lose work.
In markets with less competition such as a monopsonistic market, the effects of a minimum wage are more ambiguous. Because a monopsonist sets wages below the competitive equilibrium, a minimum wage hike could increase both wages and the level of employment. If the minimum wage hike is too large, however, the level of employment could still fall.
For a long time, economists cautioned against minimum wage hikes believing that labor markets were competitive and that a minimum wage hike, in all cases, would lead to more unemployment. More recently, however, the position of many economists has changed. Today, many economists believe that the market for low-wage labor is not competitive and that employers who hire low-wage workers exercise a fair amount of market power. Economists who believe in a more monopsonistic model of the labor market will disagree about how large minimum wage hikes should be rather than whether or not they should be implemented.
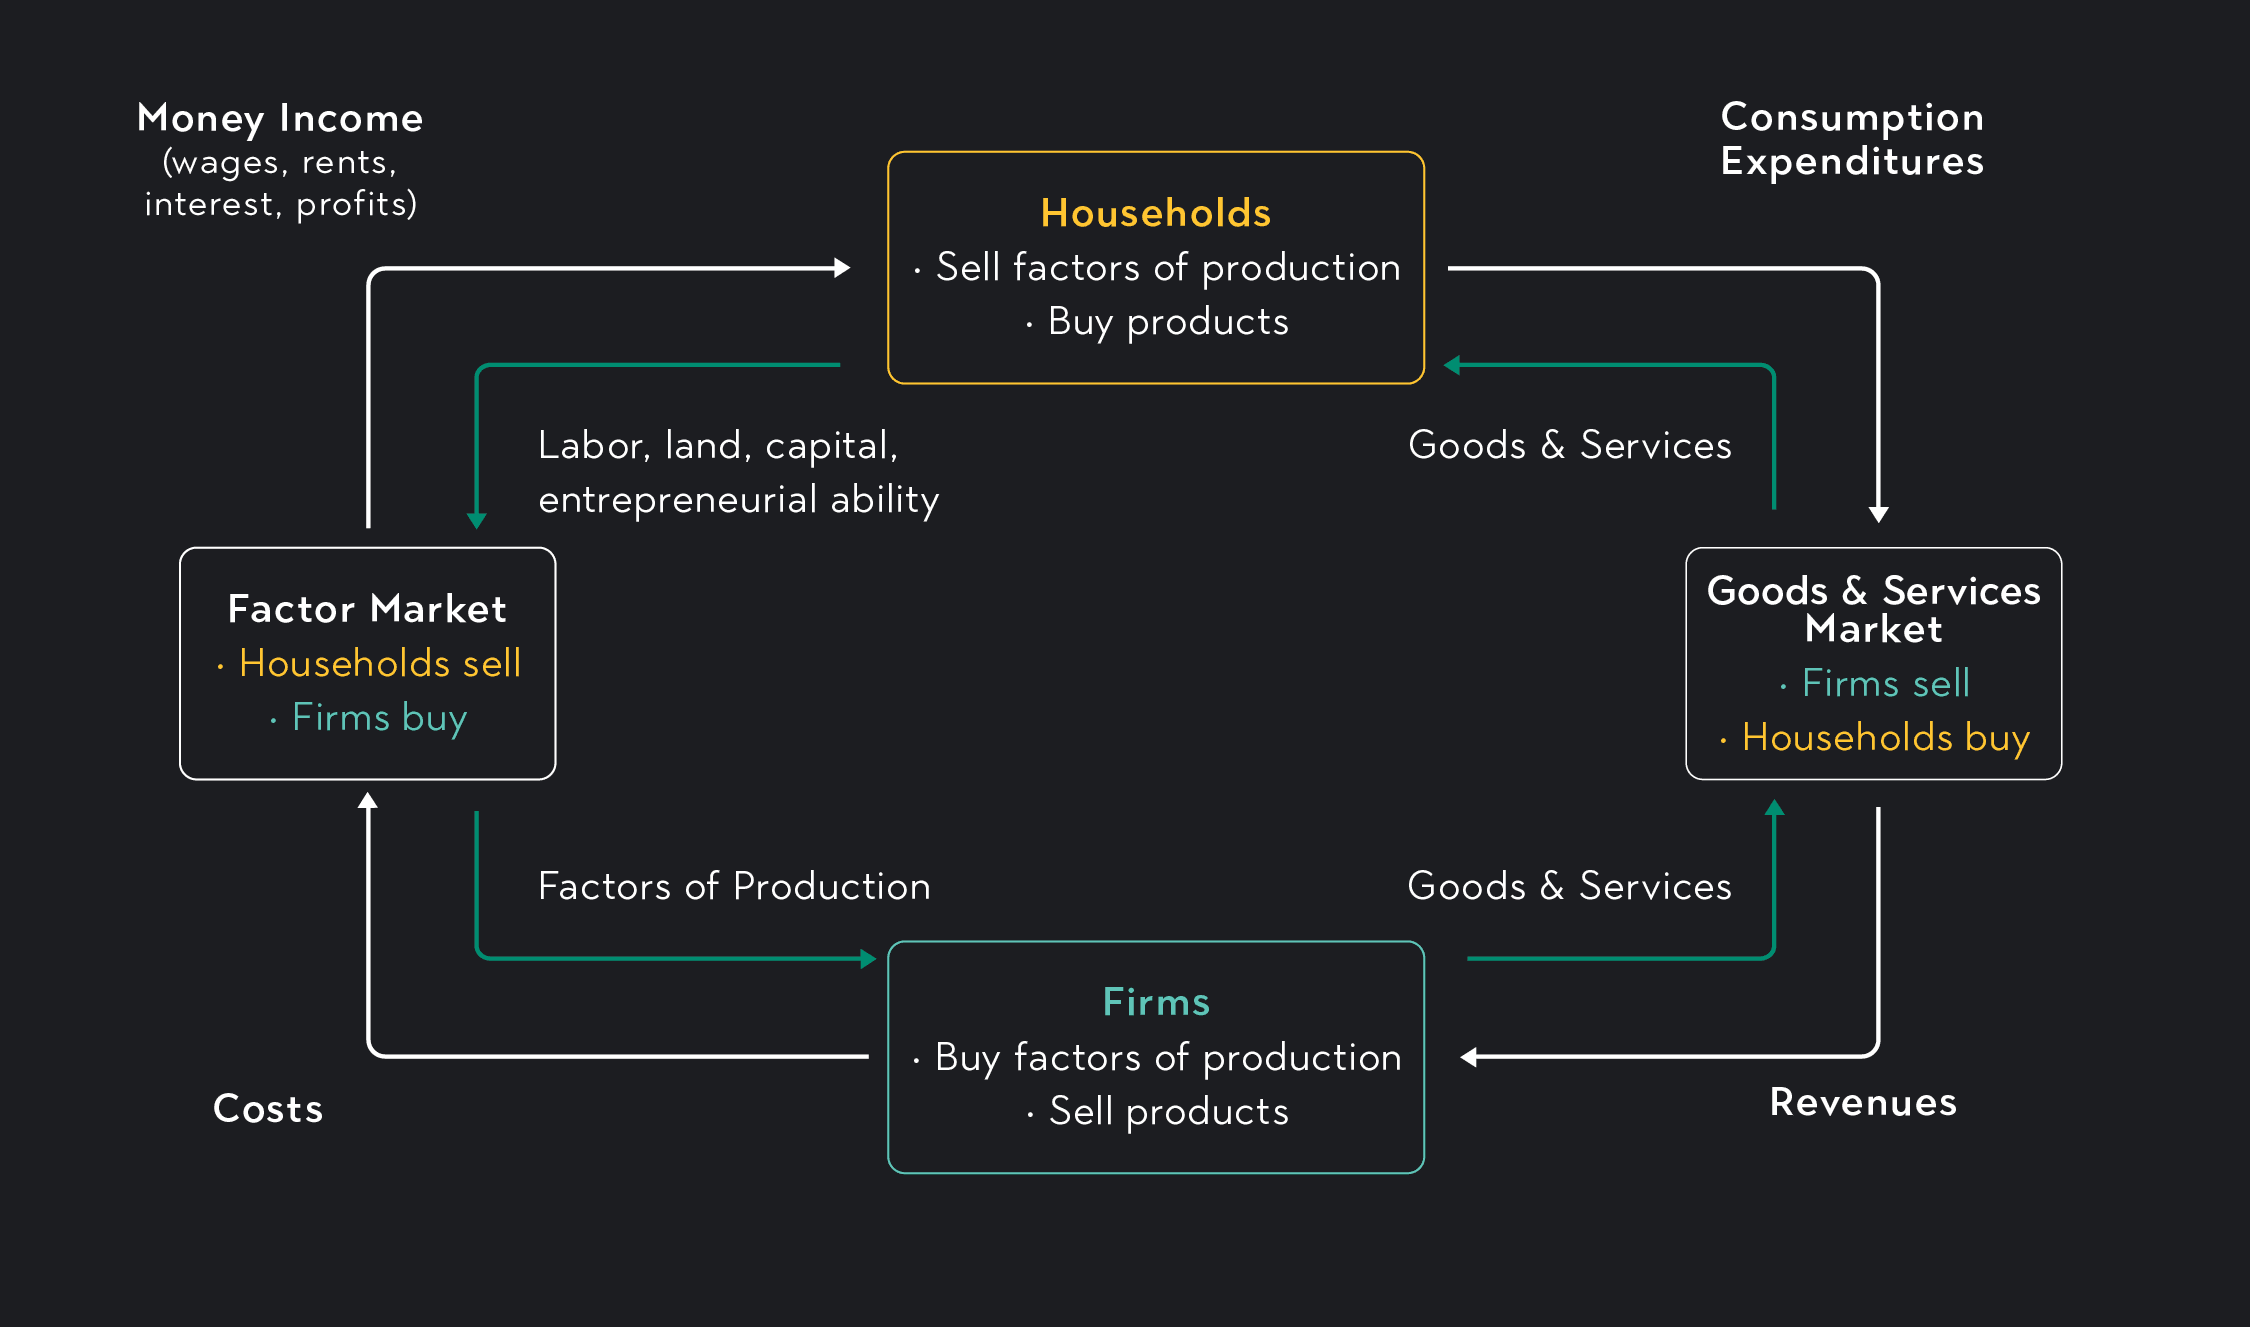
Economists distinguish between two main types of markets in the economy: markets for goods and services and factor markets. You can see these markets in the circular flow diagram below.
In markets for goods and services, businesses sell their finished products to customers. In factor markets, inputs in the production of goods and services such as land, labor, and capital are exchanged for payment in the form of income.
A labor market is a type of factor market where individuals “sell” their labor to businesses in exchange for income in the form of a wage or salary.
Outlier (from the co-founder of MasterClass) has brought together some of the world's best instructors, game designers, and filmmakers to create the future of online college.
Check out these related courses:


Economics
Learn about what a supply curve is, how a supply curve works, examples, and a quick overview of the law of demand and supply.
Subject Matter Expert

Economics
This article gives a quick overview of perfect competition in microeconomics with examples.
Subject Matter Expert

Economics
This article is a comprehensive guide on the causes for a demand curve to change. Included are five common demand shifter examples.
Subject Matter Expert