Interpreting a PPF
PPFs, Scarcity, and Tradeoffs
The Slope of a PPF: Marginal Rate of Transformation (MRT)
Why Is the PPF a Curve?
PPFs in Microeconomics, Macroeconomics, and Business
PPFs and Preferences: Productive Efficiency vs. Allocative Efficiency
Shifts in the Production Possibilities Frontier
A production possibilities frontier (PPF)—also known as a production possibilities curve (PPC)—is a graph showing combinations of two outputs that can be produced when both are made using the same finite, or scarce, resources.
Interpreting a PPF
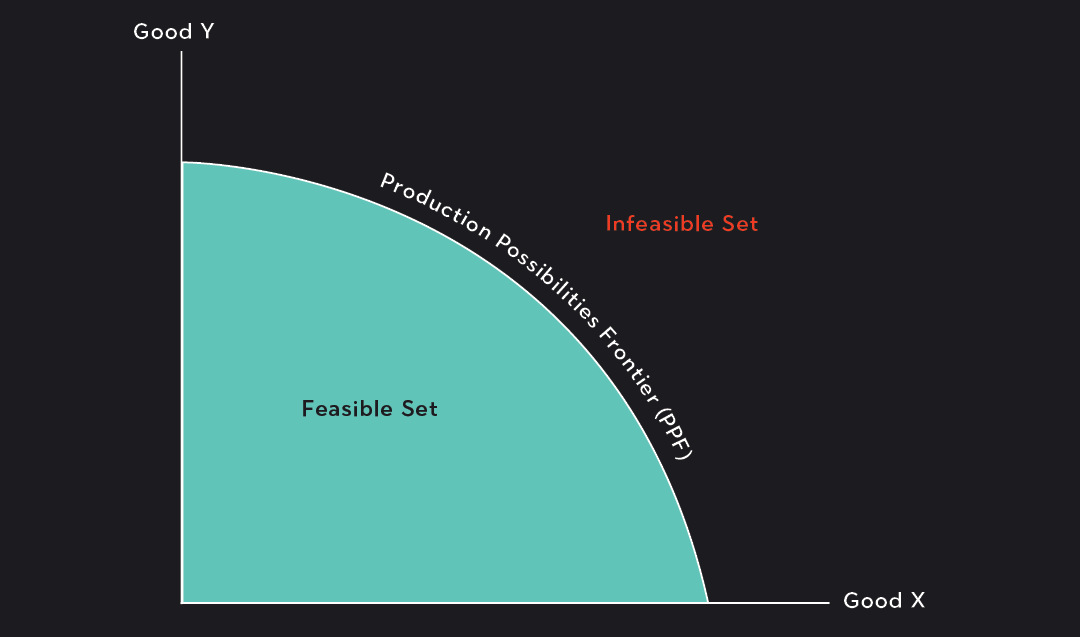
A PPF maps the quantity of one good along the x-axis and the quantity of a second good along the y-axis. We’ll call these goods: Good X and Good Y.
The point where the PPF intersects the y-axis represents an allocation of resources where all of the available resources are devoted to the production of Good Y. This point represents the maximum amount of Good Y that can be produced given the resource constraints. At this point, 0 units of Good X would be produced.
Conversely, the PPF intersects the x-axis at a point where all available resources are dedicated to producing Good X. This tells you the maximum amount of Good X that can be produced given the resource constraints. At this point, 0 units of Good Y would be produced.
Any combination of goods that lies along the PPF represents a productively efficient combination of goods. These combinations are feasible and maximize output. By “productively efficient,” we mean that all of the resources are utilized. Notice that the points along the PPF include many different combinations of Good X and Y, including those where only one good is produced.
The area within the PPF is called the feasible set. Any combination within the feasible set that doesn’t lie directly on the PPF can be produced, but it isn’t productively efficient to do so. If you choose a combination inside the feasible set, there will always be a combination of goods on the PPF that will increase output, and this combination will include more of both or one of the goods.
The area beyond the PPF is called the infeasible set. Any combination in the infeasible set is not attainable. There are not enough resources to produce combinations in the infeasible set.
Let’s take a look at an example:
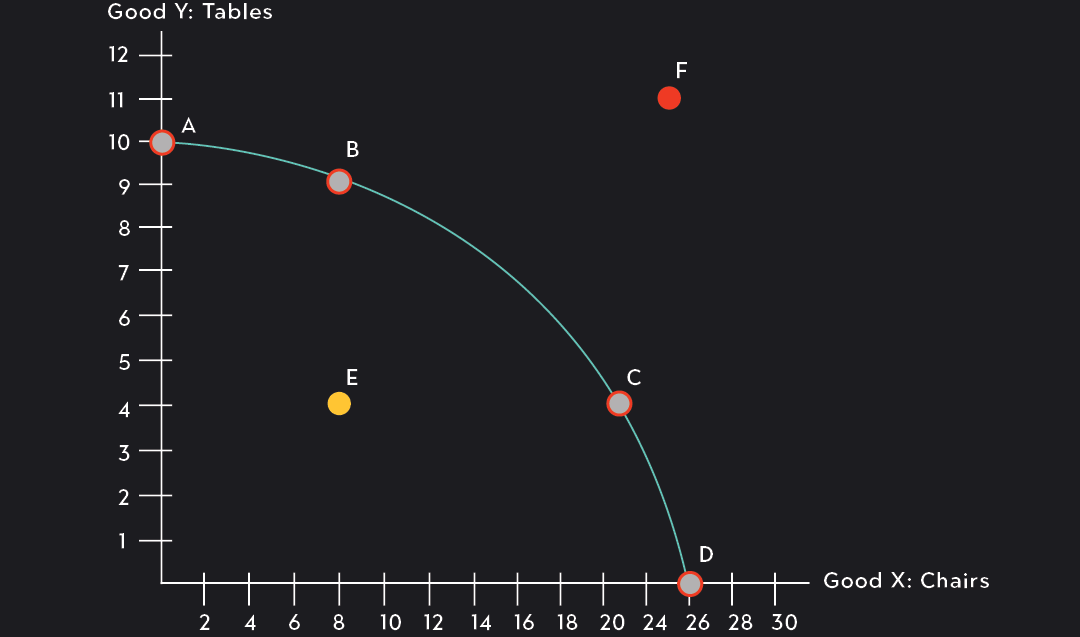
The figure below models the production possibilities for a carpenter who wants to build tables and chairs with a fixed amount of lumber and time.
If the carpenter devotes all of her resources to building tables, she can build 10 tables but no chairs. This is represented by Point A. If she devotes all of her resources to building chairs, she can build 26 chairs but no tables (Point D). She can also choose to build any combination of chairs and tables, so long as the combination is on the PPF or within the feasible set.
Any point along the PPF (such as Points B and C) represents a productively efficient combination of goods, a combination that fully utilizes the available resources.
The carpenter can choose a point such as Point E, which is not on the PPF but lies within the feasible set. However, doing so wouldn’t maximize her output, so she would be better off choosing a point that lies directly on the PPF instead. By switching to a point on the PPF, she would increase her production. You can quickly check this by comparing her output at Point E to her output at Point B or C!
Point F, on the other hand, is not feasible: it lies beyond the PPF. The carpenter doesn’t have sufficient resources to produce 11 tables and 25 chairs.
PPFs, Scarcity, and Tradeoffs
PPFs help demonstrate two fundamental concepts in economics: scarcity and tradeoffs. Scarcity is the simple fact that there are never enough of the things we need or want. Time is scarce, money is scarce, and inputs in production are scarce. We don’t have an unlimited amount of these things, so decisions need to be made about how to prioritize and allocate them.
Tradeoffs are the result of scarcity. Since resources are scarce, devoting them towards one thing often comes at the cost of not achieving or acquiring something else. There are only 24 hours in a day, so you will have less time with your family if you spend time working. If the dollars in your bank account are limited, more money spent on groceries means less spending on other necessities, such as clothing. If an entrepreneur spends most of her budget producing one good, she must spend less producing another. These types of tradeoffs are mapped and modeled using a production possibilities frontier, and the slope of the PPF can be used to quantify these tradeoffs.
The Slope of a PPF: Marginal Rate of Transformation (MRT)
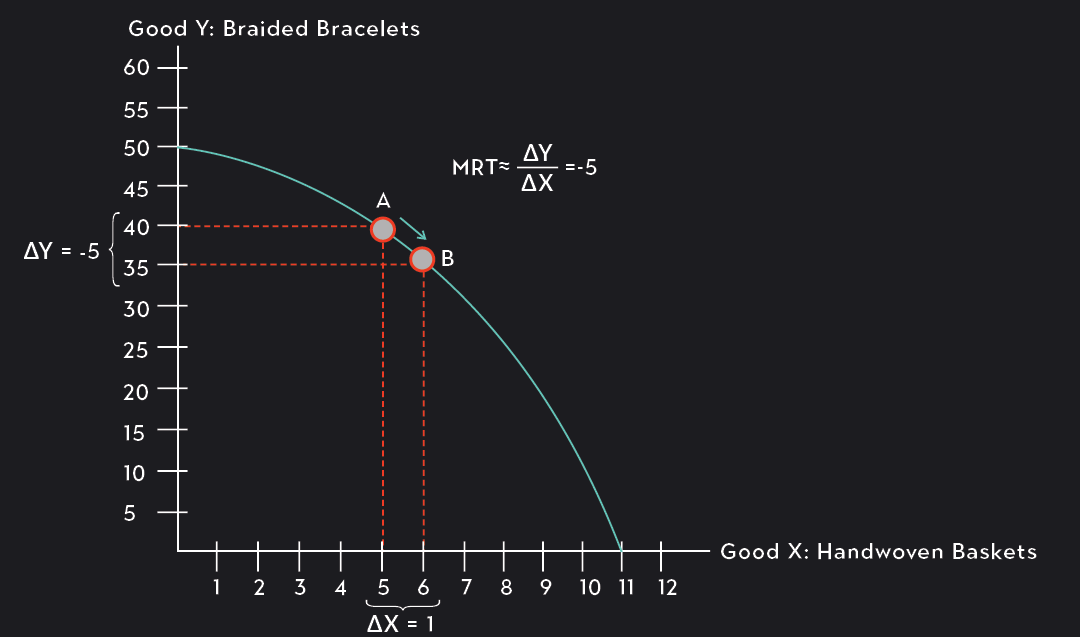
The slope of a PPF curve is known as the marginal rate of transformation (MRT). The MRT measures the opportunity cost of producing one additional unit of Good X. It tells you how many units of Good Y you need to give up to produce an extra unit of Good X.
Note that we can approximate the MRT by dividing the change in Good Y by the change in Good X. To get the true value of the MRT, you would need to take a derivative.
The PPF in the figure above maps the production possibilities for a merchant who sells her crafts on an e-commerce website. She produces and sells two goods: handwoven baskets and braided bracelets.
The marginal rate of transformation at Point A is approximately -5 (MRT ≈ -5). At this point, the merchant could choose to produce one additional basket, but she must reduce her production of bracelets by 5 in order to do so.
Why Is the PPF a Curve?
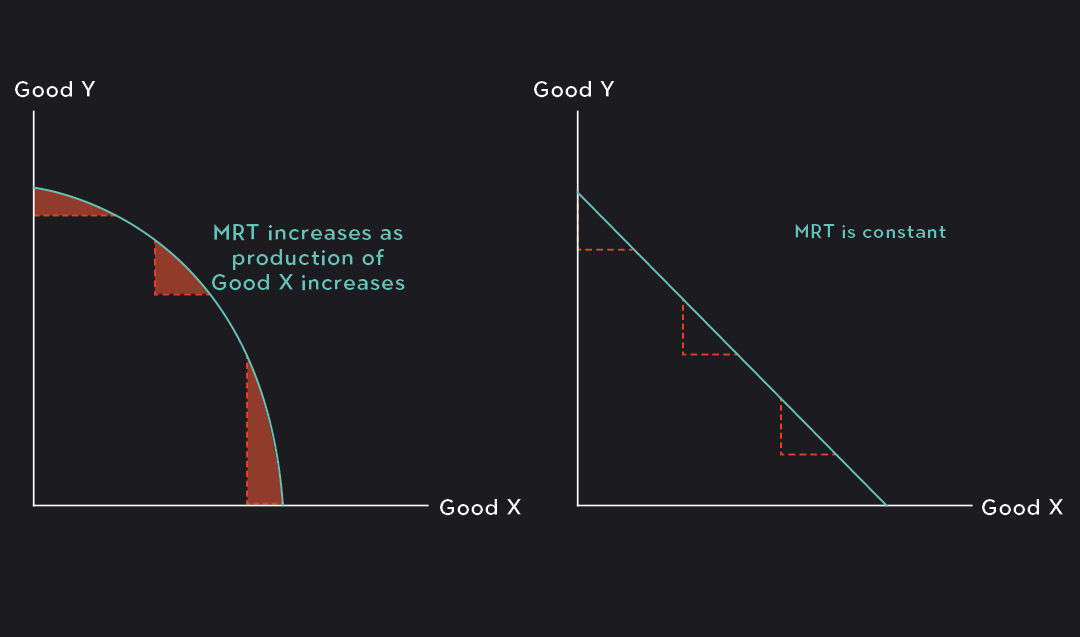
If you look at enough production possibilities frontiers, you’ll notice that most PPFs are concave, that is, they curve outward from the origin.
A concave PPF implies that the MRT (the opportunity cost of producing an additional unit of Good X) is not constant. It gets larger and larger as the production of Good X increases and as the production of Good Y decreases. This is due to diminishing marginal productivity. Diminishing marginal productivity means that the output of a good increases by smaller and smaller increments with each additional amount of resources put towards producing it. Therefore, as production of Good X increases, the producer needs to give up larger and larger amounts of Good Y to get the same 1-unit increase in Good X.
A straight PPF is much rarer and implies that opportunity costs and marginal productivity are constant. With a straight production possibilities frontier, the trade-offs between Good X and Good Y are always the same regardless of the level of output for each good.
PPFs in Microeconomics, Macroeconomics, and Business
Production possibility frontiers are used in microeconomics, macroeconomics, and business.
In microeconomics, production possibility frontiers are used to model the constraints and trade-offs of individuals, households, and firms.
In macroeconomics, PPFs are typically used to illustrate the most efficient levels of output for an entire economy. PPFs can also be used to model the trade-offs between different government programs and expenditures.
In business, you will see production possibility frontiers used to model the output decisions faced by a particular firm. Similar to their use in microeconomics, PPFs in business are used to model the output decisions of a firm that produces multiple goods or services.
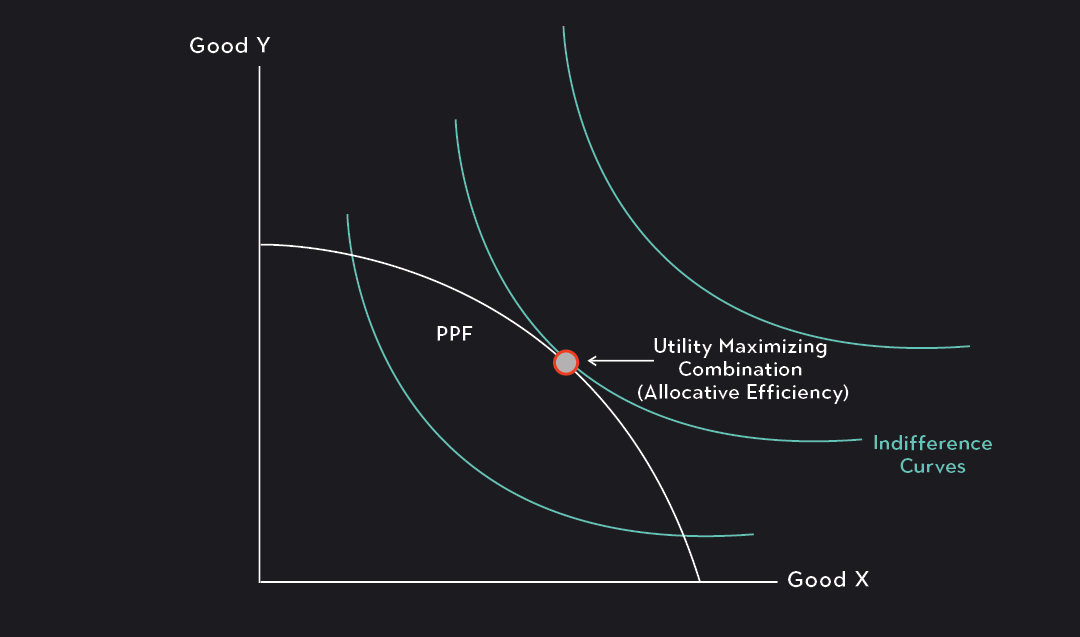
PPFs and Preferences: Productive Efficiency vs. Allocative Efficiency
Production possibility frontiers demonstrate what is possible, but they don’t tell us which particular combination of outputs an individual, household, or business will choose. Output decisions depend not just on what is possible, but also on what is preferred.
To model which combination of outputs will be chosen, PPFs need to be used in conjunction with indifference curves. Indifference curves map a decision-maker’s preferences and willingness to make certain tradeoffs.
PPFs and indifference curves can be used together to model a utility-maximizing choice. This optimal choice is found at the point where the PPF is tangent to an indifference curve. While all points along the PPF are productively efficient, only one combination on the PPF will be utility-maximizing. The utility-maximizing point is considered allocatively efficient and not just productively efficient.
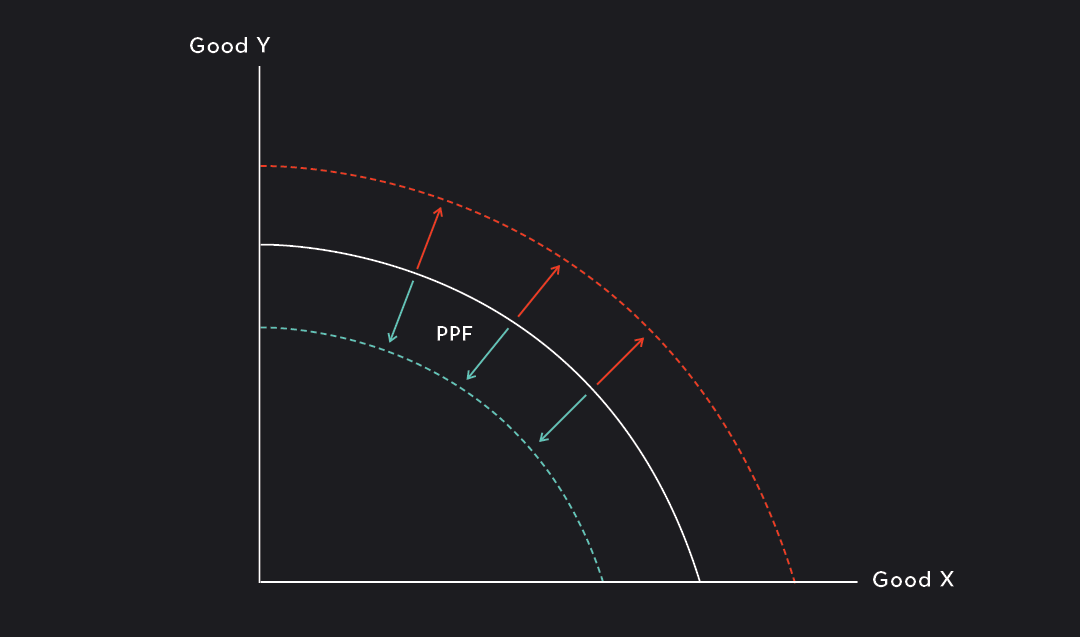
Shifts in the Production Possibilities Frontier
In a dynamic production possibilities model — a model that considers changes over time — the PPF can shift outwards or inwards.
An outward shift of the PPF represents an improvement in technology or growth in the resources needed to produce Goods X and Y. When the PPF shifts outward, the feasible set grows and the number of goods that can be produced increases.
An inward shift of a PPF represents a decline in technology or a negative shock to the resources needed to produce Goods X and Y. When the PPF shifts inwards, the feasible set shrinks and the number of goods that can be produced falls.
Explore Outlier's Award-Winning For-Credit Courses
Outlier (from the co-founder of MasterClass) has brought together some of the world's best instructors, game designers, and filmmakers to create the future of online college.
Check out these related courses: