
Economics
Understanding the Supply Curve & How It Works
Learn about what a supply curve is, how a supply curve works, examples, and a quick overview of the law of demand and supply.
Alejandro Diaz Herrera
Subject Matter Expert

Economics
05.11.2022 • 6 min read
Subject Matter Expert
Learn what the production possibilities curve is, how it works and how the model affects the economy and its relationship with comparative and absolute advantage.
In This Article
Since economic resources are scarce, it is impossible to produce unlimited goods and services. A Production Possibilities Curve (PPC) is an economic model illustrating the tradeoff in producing one good over another. The PPC—sometimes called the Production Possibilities Frontier (PPF)—is an economic model that informs us about a country or firm's opportunity cost when producing more than one good or service.
In macroeconomics, the PPC demonstrates the allocation of a country's available resources to produce all possible outputs. To understand the underlying intuition of the PPC, let us assume that a country produces just two specific goods: apples and wine. The more economic resources—such as land, labor force, and capital—the country uses in making apples, the fewer resources it will have for producing wine. Economists refer to this type of tradeoff as the opportunity cost. This means that for each additional barrel of wine produced, fewer apples can be produced and vice versa.
This same intuition will apply to microeconomics. If a business provides two different goods or services, the PPC illustrates the opportunity cost. Knowing the precise opportunity cost at each junction helps managers achieve productive efficiency. Through the correct allocation of its limited resources, a firm can maximize output and produce the most financial profit.
As shown in the graph below, any spot inside the curve (X) reflects inefficient production, since not all the country's resources are utilized. On the other hand, any area beyond the curve (Y) is impossible to achieve because of its resource constraints. In contrast, all along the actual curve (A, B, C) is the possibility frontier of production, where each point demonstrates the opportunity cost. Every additional unit of one good decreases the output of the other good.
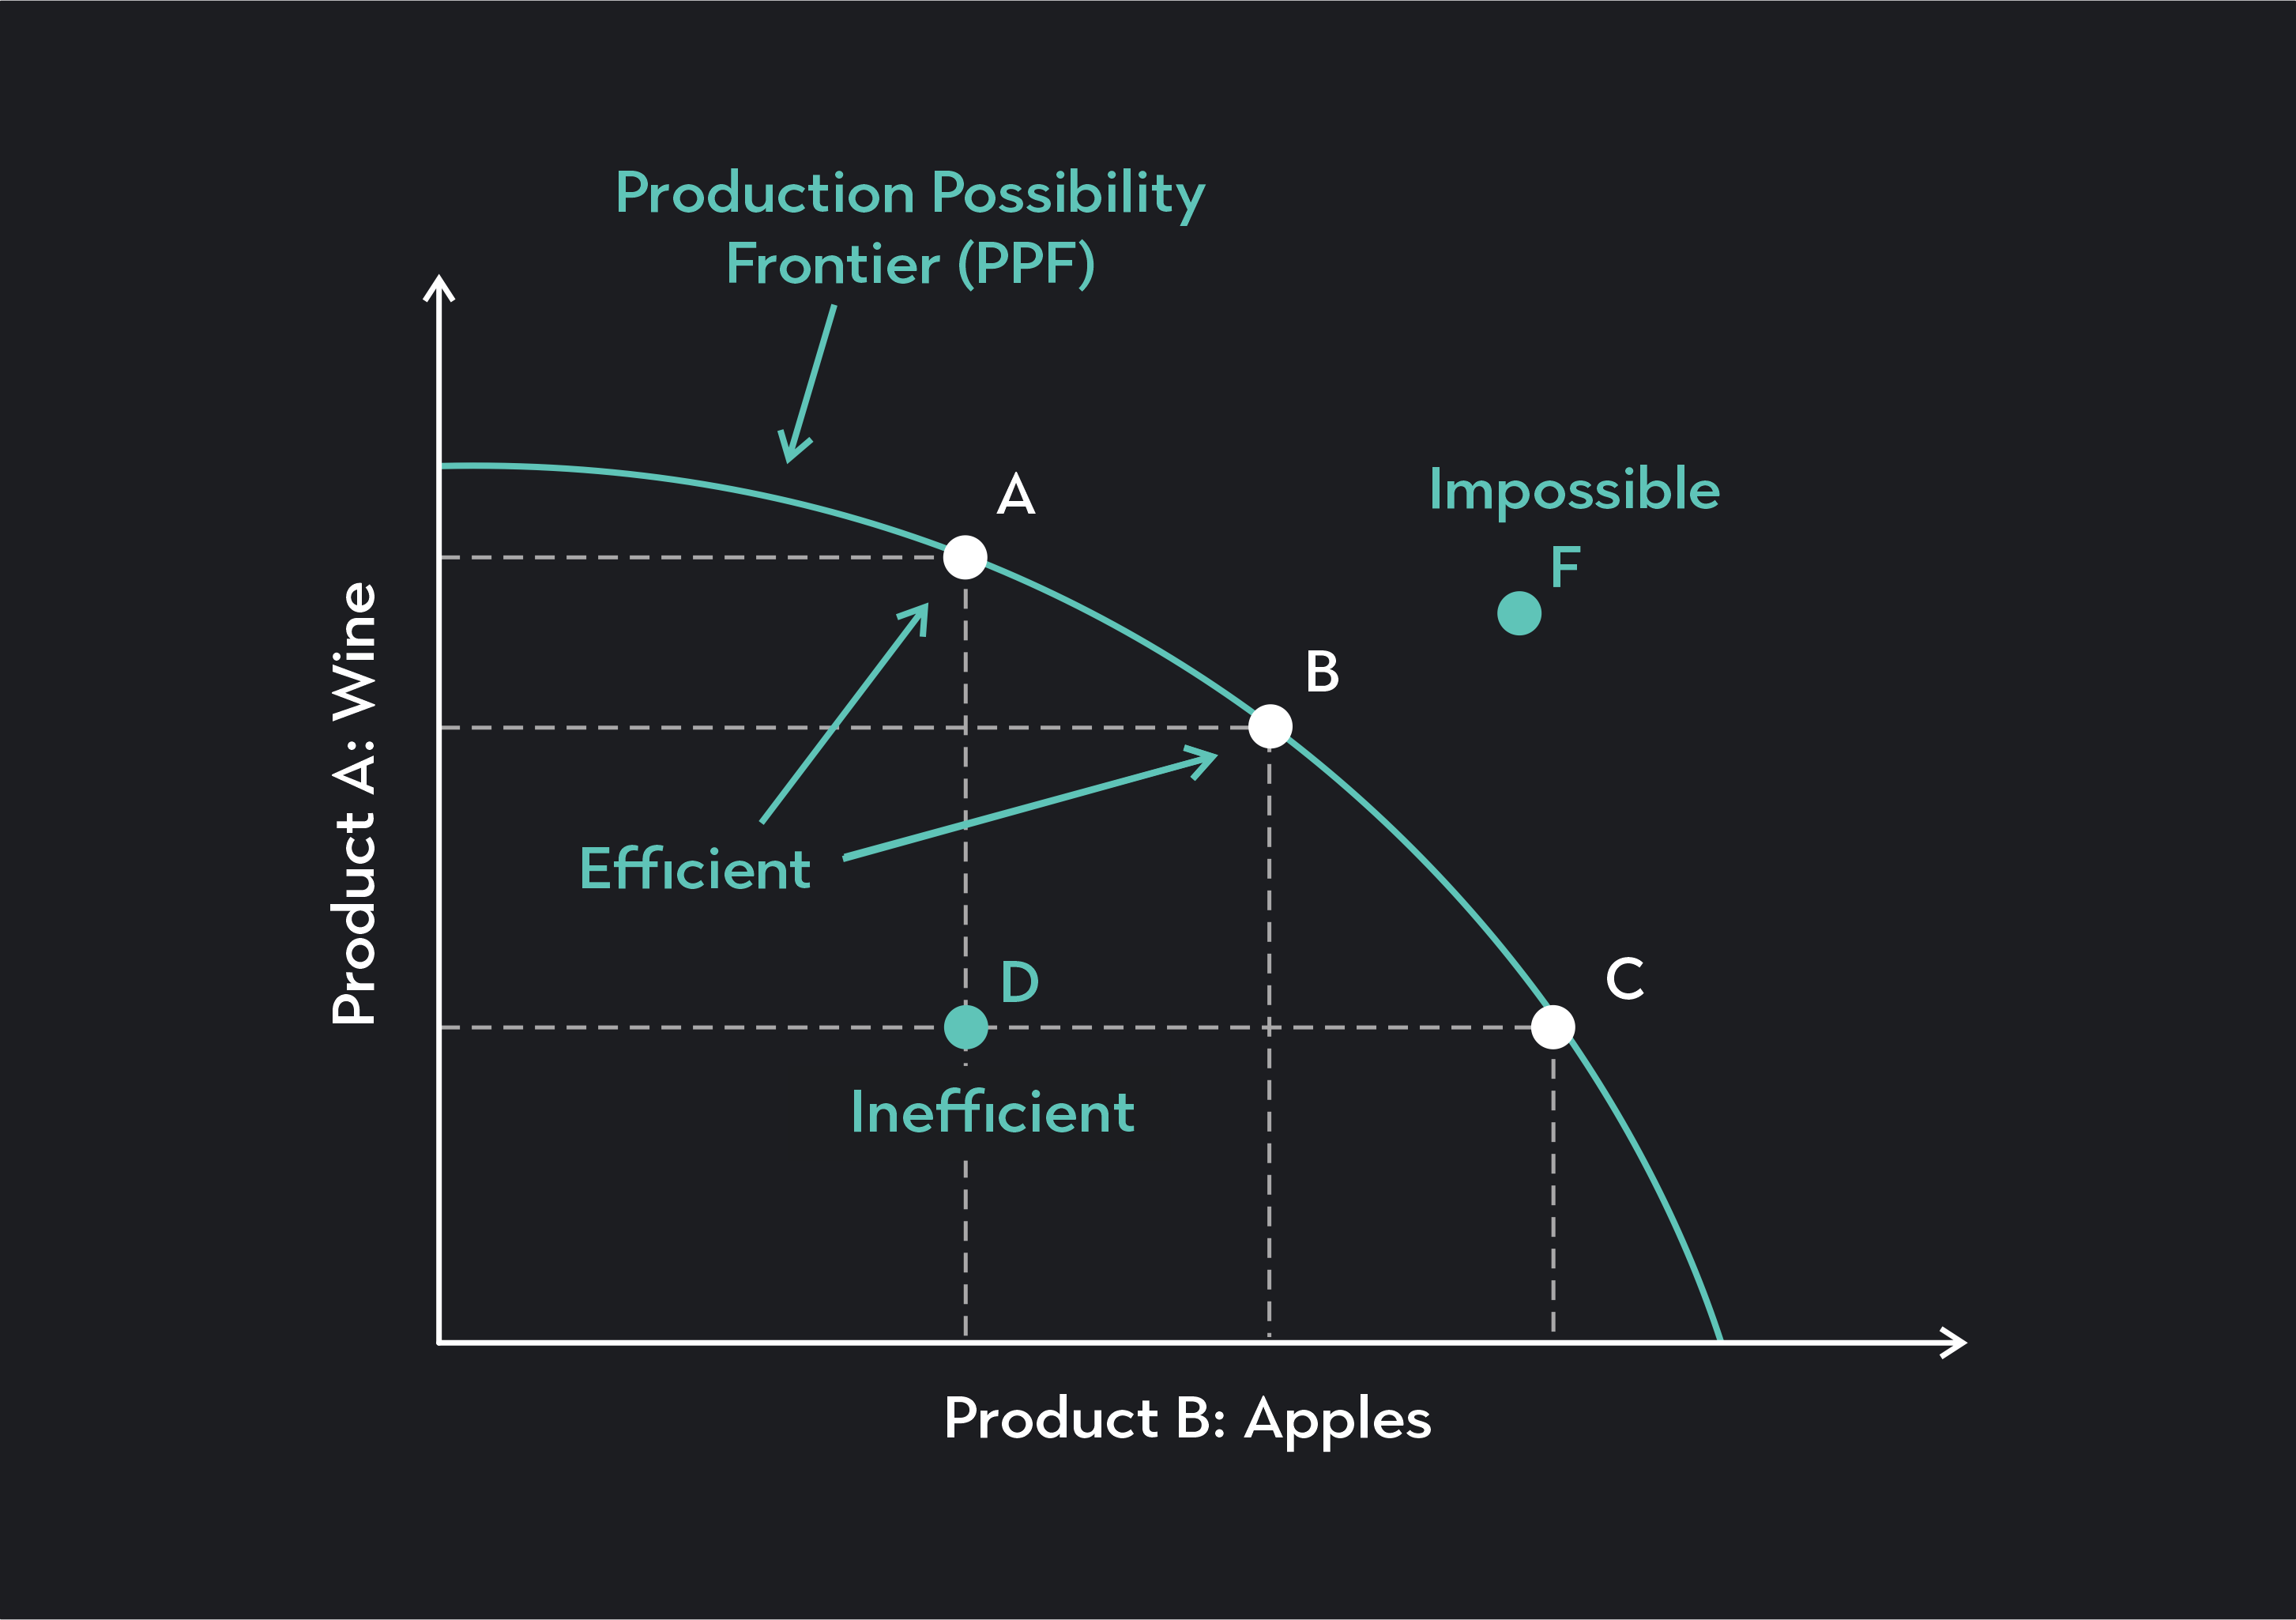
The PPC depicts a country or business's increasing opportunity cost when producing two different goods or services. The curve reflects the combination of goods that ideally maximizes the resources available.
The highest point on the curve (A) reflects the maximum production of only goods on the vertical axis (Y) and no production of goods on the horizontal axis (X). Conversely, the widest point on the curve (D) reflects the maximum production of only goods on the x-axis and no production of goods on the y-axis.
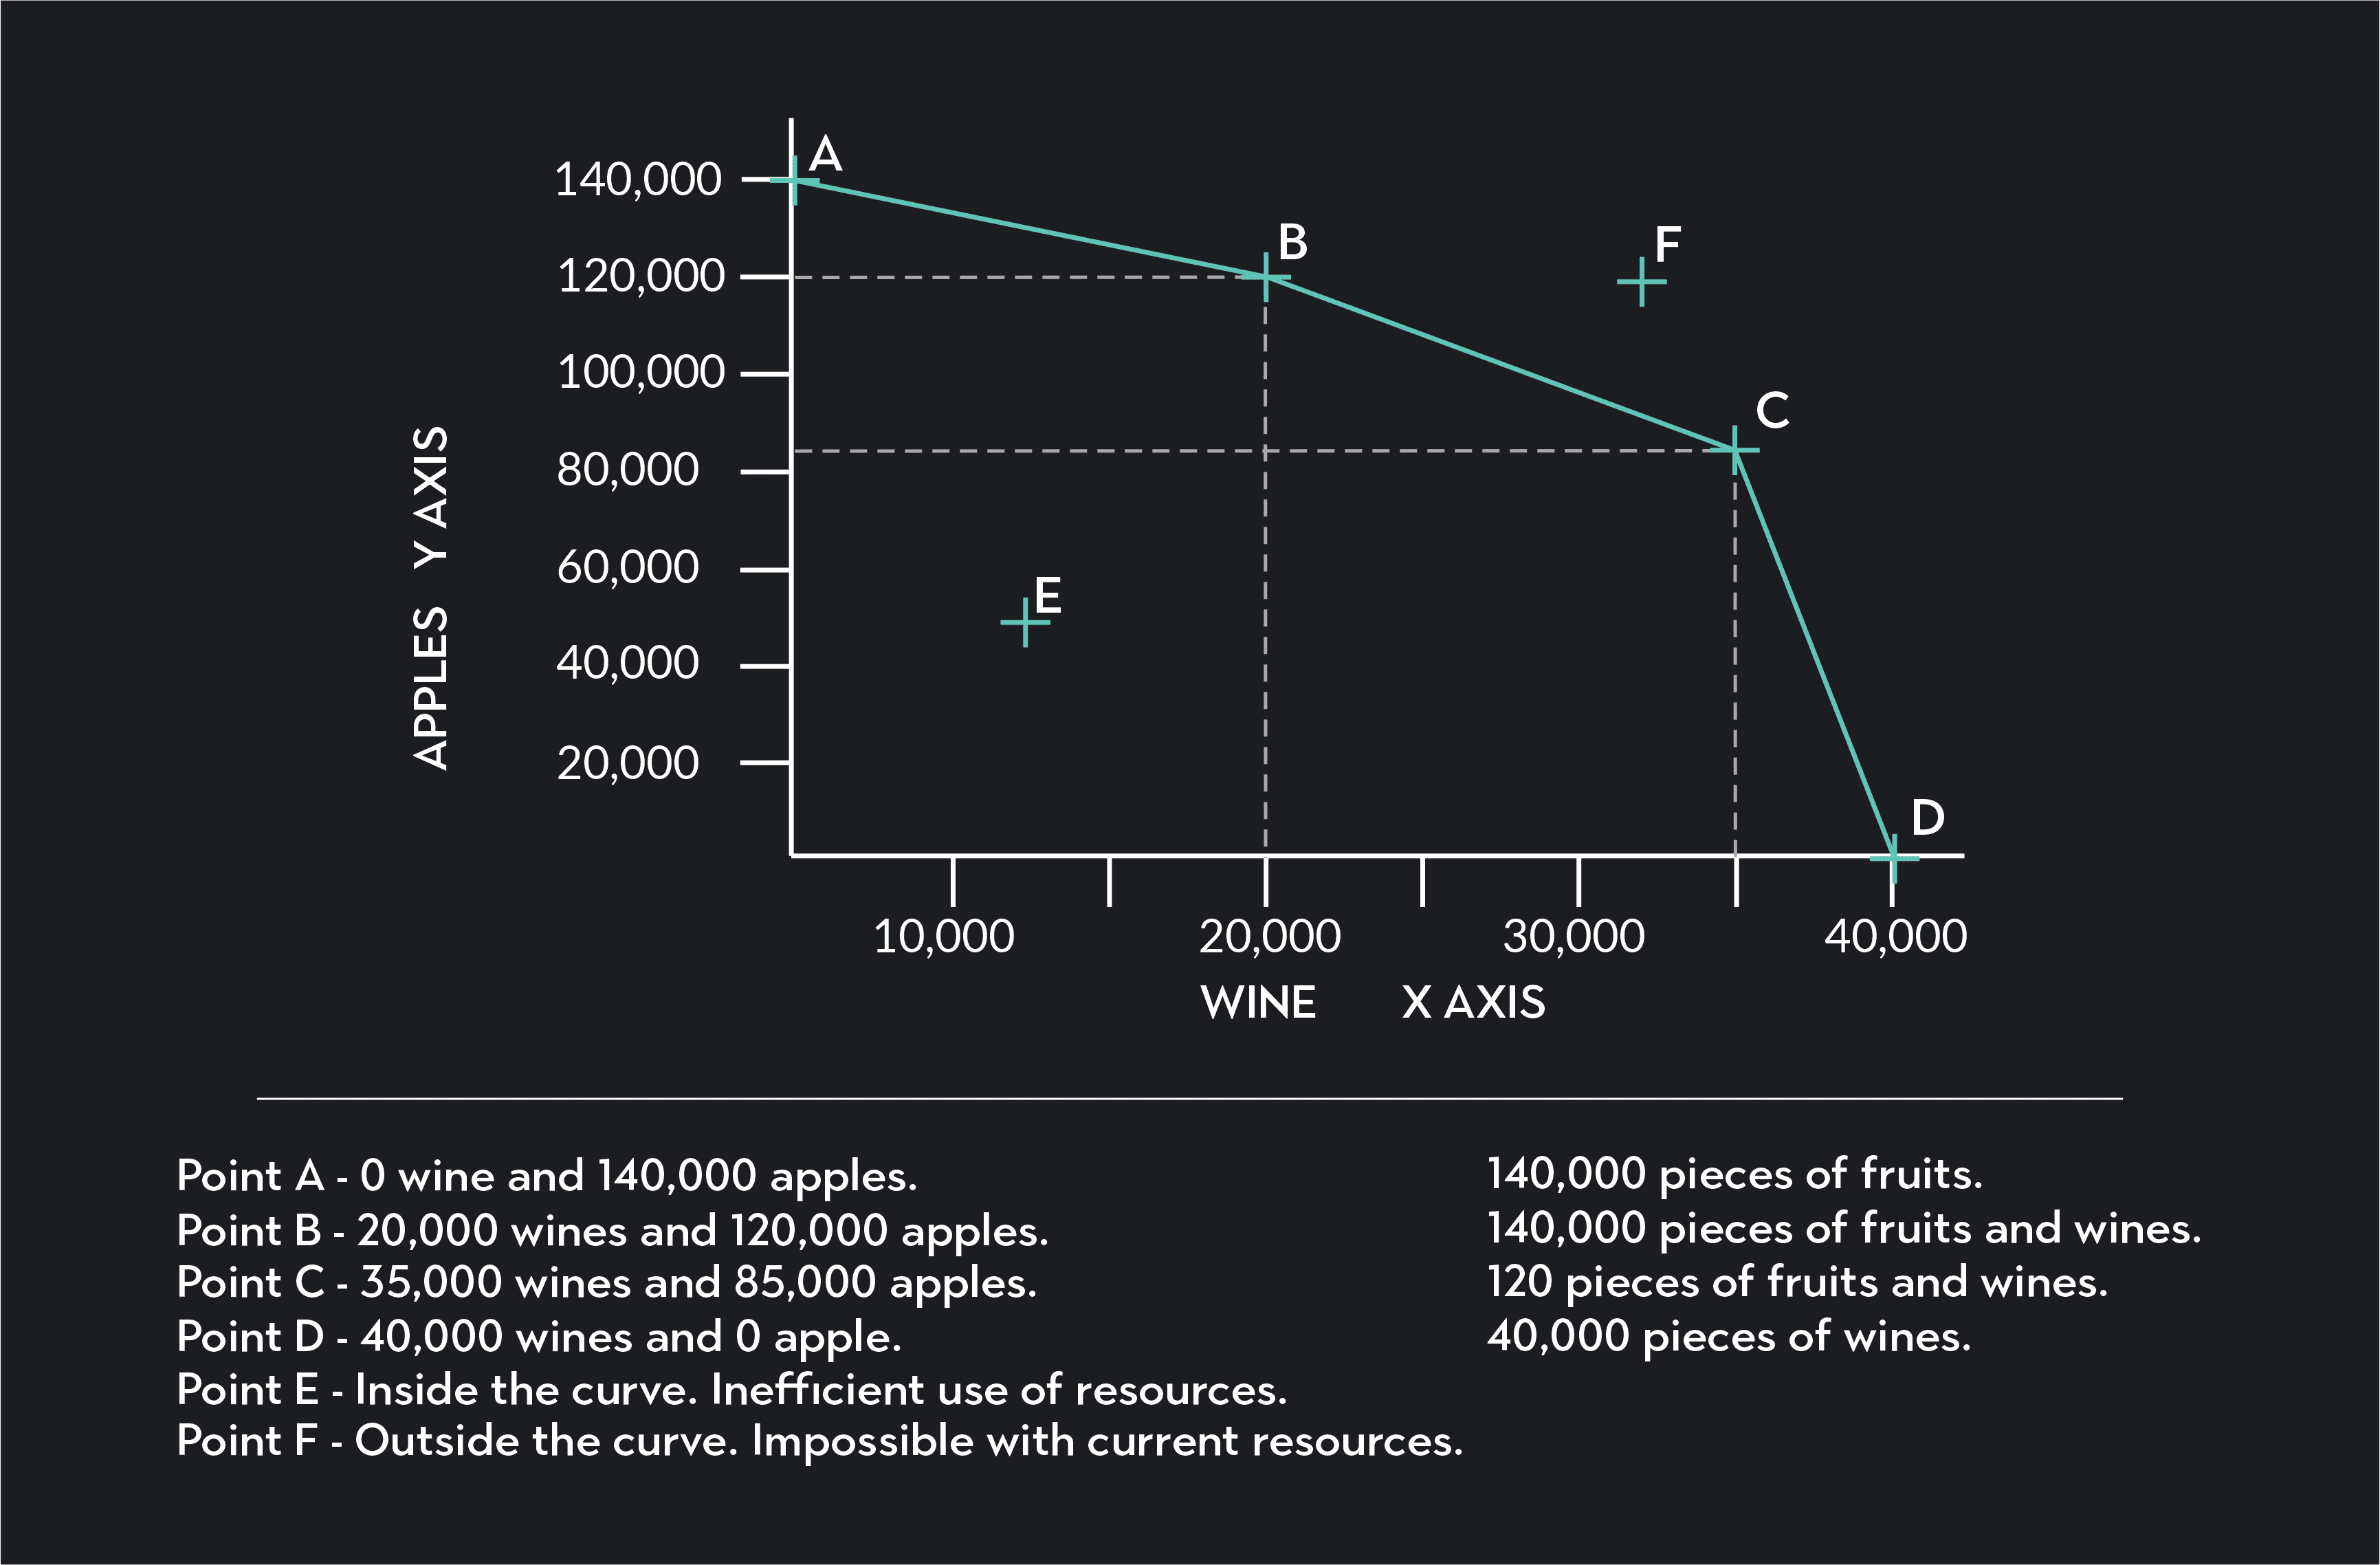
As seen in the above graph, if a company or country's output falls on the frontier, they are achieving their maximum possible output. On the other hand, if the output falls somewhere inside the curve, not all resources are being used. See point E in the chart above. Similarly, given the limited resources, any point outside the production possibilities curve is impossible to reach since the producers cannot produce more output. See point F.
Every point between the highest and widest points (A to B) reflects a tradeoff of producing different combinations of both goods. A country or business is usually more efficient when it is producing a mix of goods. This is because certain resources are more productive or better suited for producing one thing over the other. For example, if country A was only producing wine and apples. Some land might be better to grow grapes, while another land is more conducive to growing apples. The same thing applies to the labor force used in production. Some people are better fit to produce wine, while others might be better at growing apples. That is why generally, a country will be economically better off and more efficient if they split up their resources in the best possible combination.
The curved shape of the PPC reflects the law of diminishing returns. This means that each additional input factor of production has less of an impact at a certain point. At first, adding additional resources for production will result in significant output gains. However, these added output gains gradually diminish, thus causing an outward curve.
A straight PPC would mean there’s a constant opportunity cost. Meaning, the tradeoff of producing one good over the other remains constant. Regardless of where the production of either good is on the PPC, the opportunity cost is always the same. In the real world, this is very unusual because there are diminishing benefits from additional resources. That is why the PPC is generally bowed out.
Comparative advantage is essential in determining the PPC.
A country might be capable of producing all goods and services it needs to have a functioning and stable society. However, acting in such a way will often lead to an overall inefficient economy for that country and impede its economic growth. A country can grow its economy and the standard of living only through specialization. This means that each country has a comparative advantage in producing certain goods. In other words, some countries can produce certain goods at a much lower cost than other countries and should therefore maximize the production of those goods in which they have a comparative advantage.
For example, let us assume Country A can produce one million computers every year at a cheaper input cost than country B can produce one million computers per year. In contrast, country B can produce one million units of wine a year at a cheaper cost than country A. This would mean that Country A has a comparative advantage in computers while country B has a comparative advantage in wine production. Many factors determine how and why a country has a comparative advantage; it all comes down to the fact that the input cost of production is cheaper, thus creating an economic benefit.
Sometimes, a country or an individual can produce more than another country, even though both countries have the exact cost of inputs. For example, Country A may have a new technology allowing it to easily manufacture more of both apples and wine than Country B with the same amount (and cost) of inputs.
A country that can produce more of both goods has an absolute advantage. This might be because it has more access to capital goods, natural resources, higher levels of education, resulting in more skilled labor.
The overall economy does best when it directs the production of each resource toward its specialty. The more specialized the resources, the more bowed-out the production possibility curve will be.
The outward shift illustrates greater possible output. For instance, full employment would increase all possible combinations of production. Similarly, an increase in skilled labor, new technology, or access to more capital goods will shift the curve outwards.
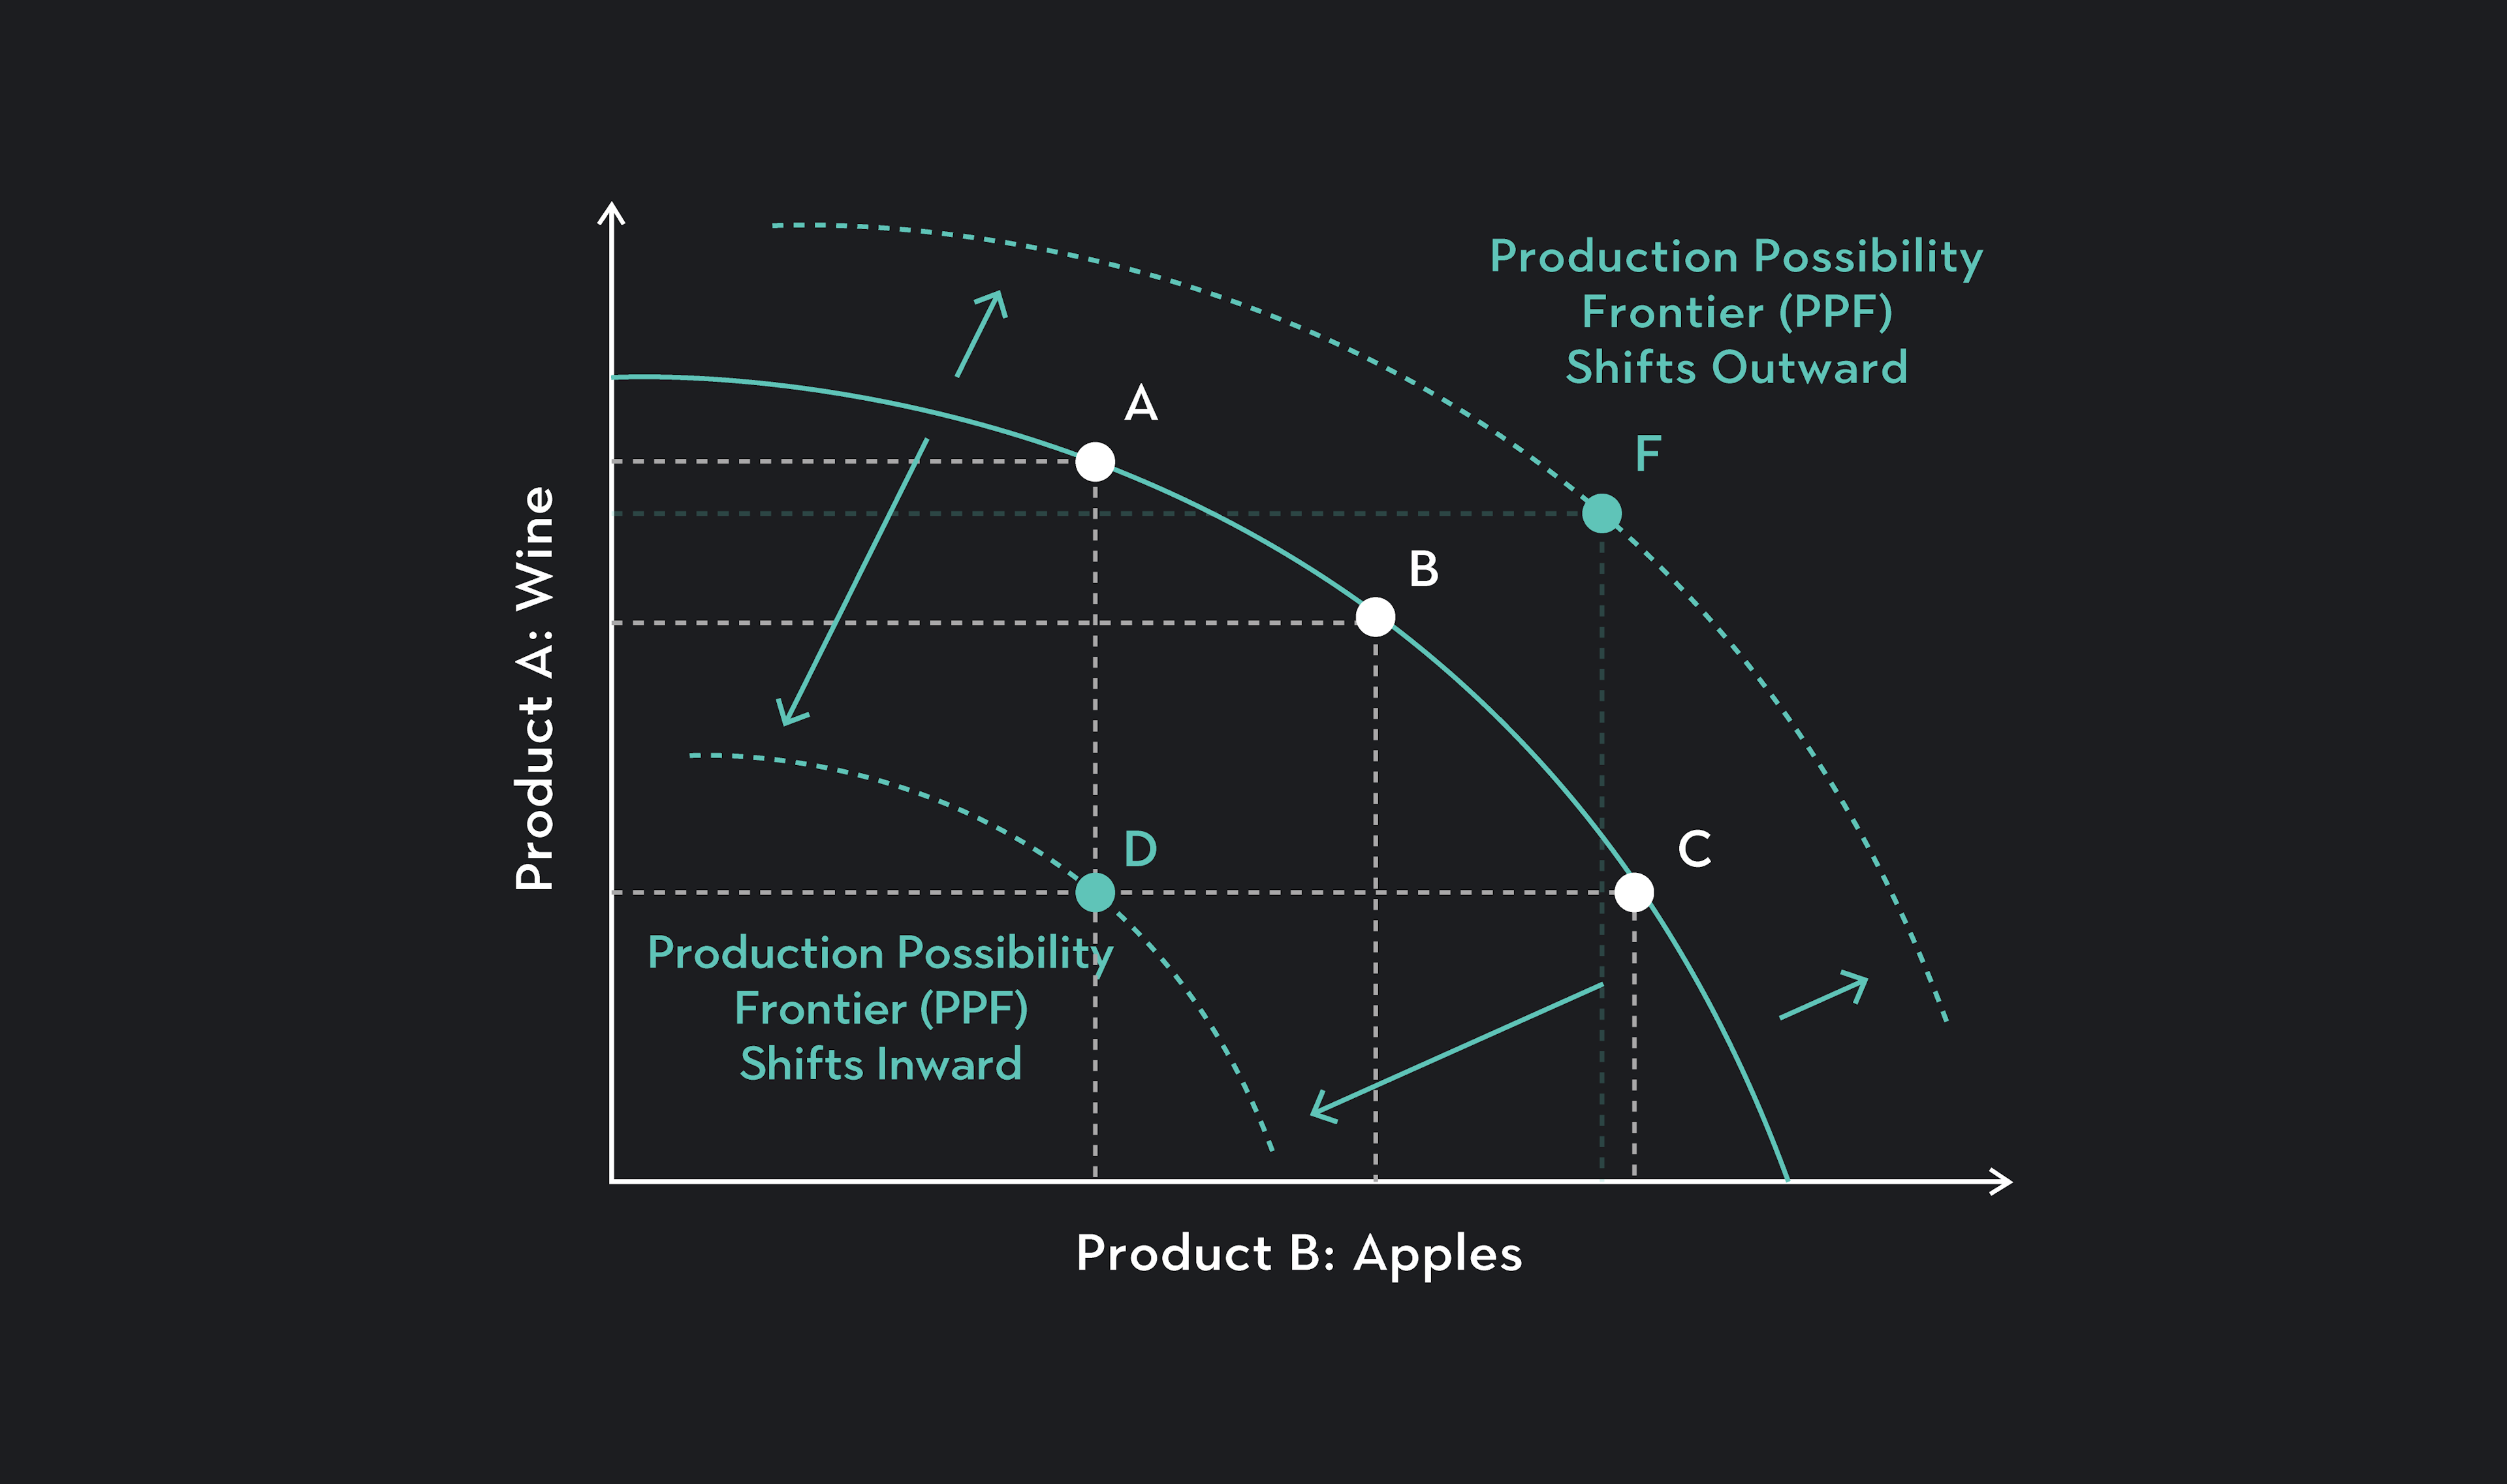
An inward shift would illustrate a decrease in possible production. Many factors can shift a country's PPC inward. For instance, high unemployment, rising inflation, and outflow of capital goods will all cause a shift inwards, illustrating overall less possible output.
Outlier (from the co-founder of MasterClass) has brought together some of the world's best instructors, game designers, and filmmakers to create the future of online college.
Check out these related courses:


Economics
Learn about what a supply curve is, how a supply curve works, examples, and a quick overview of the law of demand and supply.
Subject Matter Expert
Economics
This article gives a quick overview of perfect competition in microeconomics with examples.
Subject Matter Expert

Economics
This article is a comprehensive guide on the causes for a demand curve to change. Included are five common demand shifter examples.
Subject Matter Expert