
Economics
Labor Market Supply Curves & Demand Curves
Learn what a labor market is, the factors that produce a shift in the labor market supply curve and demand curve, and their relationship to price floors.
Sarah Thomas
Subject Matter Expert
Economics
01.30.2023 • 9 min read
Subject Matter Expert
Here’s a simple introduction to demand and supply. We’ll explain their relationship, the four basic laws, essential related concepts, and provide graphic examples illustrating them.
In This Article
“It’s basic supply and demand!” This phrase you’ll hear many people mention, like economists, journalists, people in business, and news anchors. If you understand supply and demand, there’s a lot you’ll discover about the world.
Let’s begin with the basics.
Supply and demand are central concepts in economics. In a market economy, the interaction of supply and demand determine the price and quantity of goods and services.
Supply represents the producer or seller’s side of a market. It is the quantity of goods sellers are willing to sell at various prices.
Demand represents the consumer or buyer’s side of the market. It is the quantity of goods buyers are willing to buy at various prices.
When modeling supply and demand, economists frequently use graphs, tables, and equations.
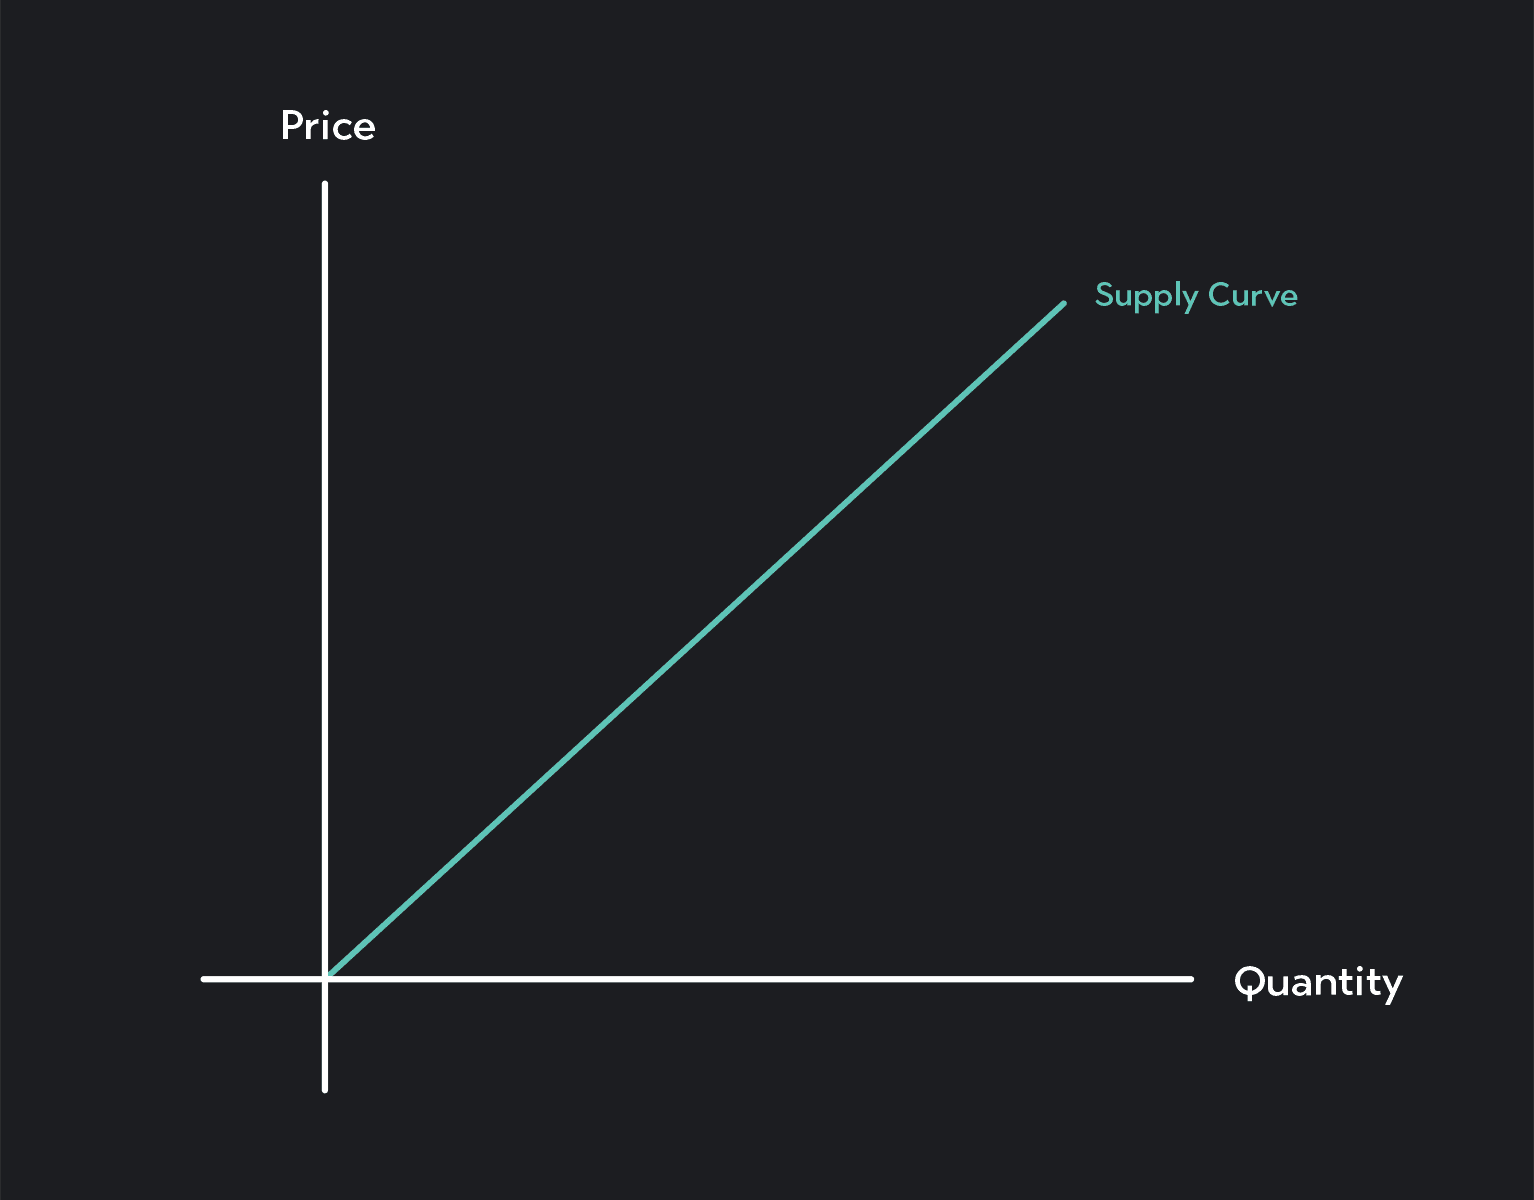
A supply curve is a graph showing the relationship between the price of a good (plotted along the vertical axis) and the quantity sellers are willing to supply at each price (plotted along the horizontal axis). Supply curves can show supply for a single seller or aggregate supply for all sellers in the market.
Supply curves can be straight lines or curves, and they are typically upward sloping. The curves slope upward due to something called the law of supply—an observation that sellers typically want to sell more of their product at higher prices and less at lower prices.
You can express a supply curve as a table known as a supply schedule or an equation where quantity supplied (Qs) is a function of price (P).
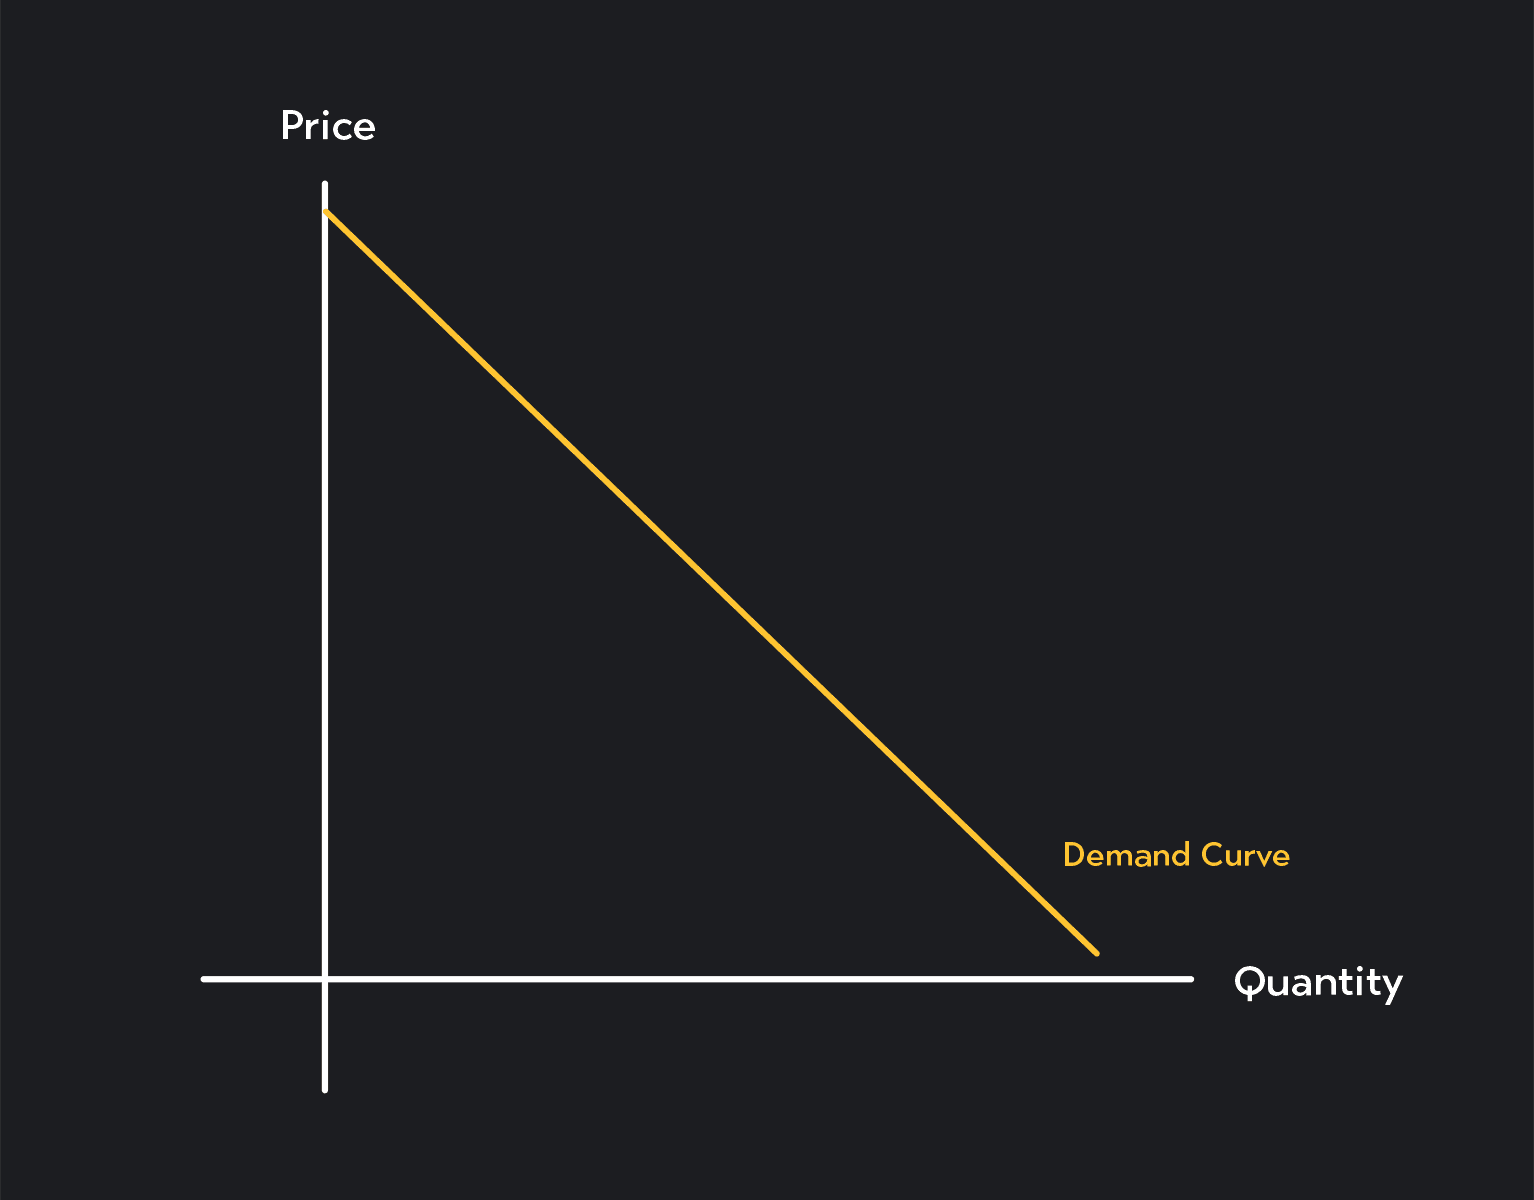
A demand curve is a graph showing the relationship between the price of a good and the quantity consumers are willing to buy at each price.
Demand curves can also be straight lines or curves, but they are typically downward sloping. You can draw individual demand curves representing the demand of a single consumer, and you can all draw market demand curves showing aggregate demand across all buyers in the market.
Demand curves slope downward because of the law of demand. This is the observation that buyers are usually willing to buy more at lower prices and less at higher prices. Their response to price is the opposite of sellers.
You can express a demand curve as a table known as a demand schedule or an equation where quantity supplied (QD) is a function of price (P).
When we put supply and demand together, we can estimate the price and quantity we expect to emerge in the market.
We can do this several ways. But the most basic model of supply and demand is the model of perfect competition. This is a model you’ll frequently use in introductory economics courses, and mastering it will help you understand more complex market models.
In the model of perfect competition, the market-clearing price and quantity (also called the equilibrium price and quantity) are determined by the intersection of the supply and demand curves.
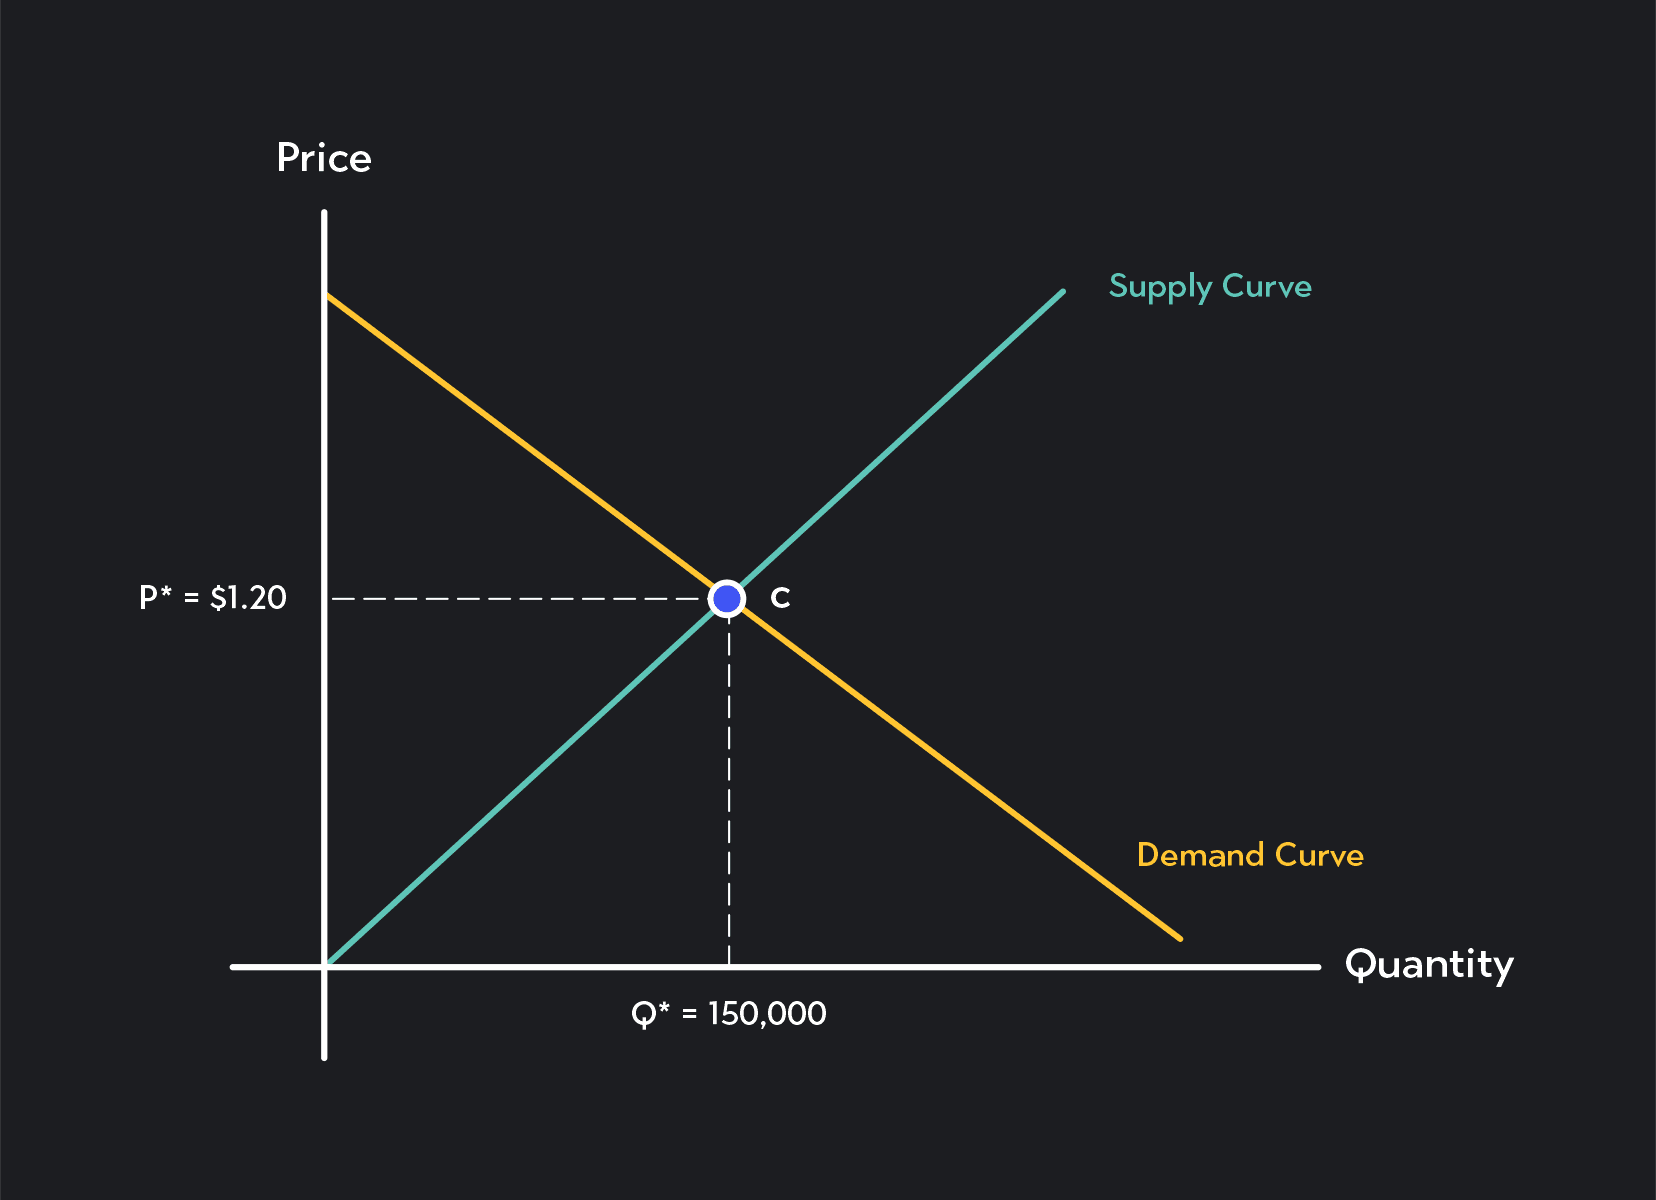
The point of intersection between the supply and demand curves is called the competitive equilibrium or market equilibrium.
If you trace this point down to the horizontal (quantity) axis, you’ll find the equilibrium quantity. This is the quantity of goods that will be bought and sold in the market. If you trace the competitive equilibrium over to the vertical (price) axis, you’ll find the equilibrium price. This is the price that will be charged in the market.
The figure above shows a hypothetical market for organic pears. Notice how market demand and market supply curves are sloping in opposite directions following the law of supply and the law of demand. The competitive equilibrium in this market is at point C. If we trace this point down to the horizontal axis, we find an equilibrium quantity (Q*) equal to 150,000. If we trace the point over to the vertical axis, we find an equilibrium price (P*) equal to $1.20 per pear.
To read more about supply and demand models, read these articles on perfect competition and labor market supply and demand curves.
Equilibrium price and quantity change in response to changes in supply and demand.
The following are factors that can affect supply:
If the price of labor or the materials used in production change, supply will change. Ceteris paribus (all else being equal), supply will increase when the cost of production falls. If an input price increases, supply will decrease.
Technology is the process by which firms create a good or service. When technology improves, sellers are able to produce their products more efficiently. This causes supply to increase. If there is a negative technological shock, supply will decrease.
Natural and political events such as storms, pandemics, abnormally good or bad weather, sanctions, and wars can affect the supply of goods and services. The impact of these events will depend on the good or service being sold.
Government policy impacts supply positively in some cases and negatively in others. Governments can intervene in markets through policies such as taxation, subsidies, regulations, price ceilings, and price floors.
Why does the government set a price ceiling and price floor for goods?
Dr. Homa Zarghamee—one of Outlier.org’s economics instructors—breaks down this complex topic (and a few others further down in the article):
The following are factors that can affect demand:
Consumer preferences can change for many reasons, including trends, new products, and new information. When preferences towards a specific good or service increase, demand increases. When preferences shift away from a specific good or service, demand for that product will decrease.
Substitutes are goods that many consumers are willing to buy in place of another (think Cheez-Its and Ritz cheese crackers). When the price of a substitute good increases, demand for the alternative will increase. When the price of a substitute good falls, demand for the alternative will decrease.
A complement is a good that consumers like to buy together with another—think hot dogs and hot dog buns. When the price of a complement increases, demand for its complement falls, and when the price of a complement decreases, demand for its complement increases.
Demographic changes and changes in the size of the population can influence demand. The more people there are, the more buyers there tend to be, so population growth tends to increase demand for most goods and services. A shrinking population tends to lower demand for most goods and services.
Consumers base their decisions around their expectations about the future. When these expectations change, demand can also change.
A good example of this is the housing market. If conditions in the economy change and news outlets start reporting a gloomy outlook for the housing market, homebuyers might put off buying a house for fear of losing value on their newly purchased home. They might also put off buying a house in hopes that future prices will be lower than what they currently are.
To read more about supply and demand shifts, check out these articles:
Overall changes in supply and demand cause supply and demand curves to shift. An increase in supply (or demand) results in an outward or rightward shift of the curve. A decrease in supply (or demand) results in an inward or leftward shift of the curve.
When the demand or supply curve shifts, the equilibrium price and quantity are also affected. A shift in supply or demand will result in a new equilibrium.
Here’s a look at how equilibrium price and quantity change in competitive markets in response to supply and demand shifts.
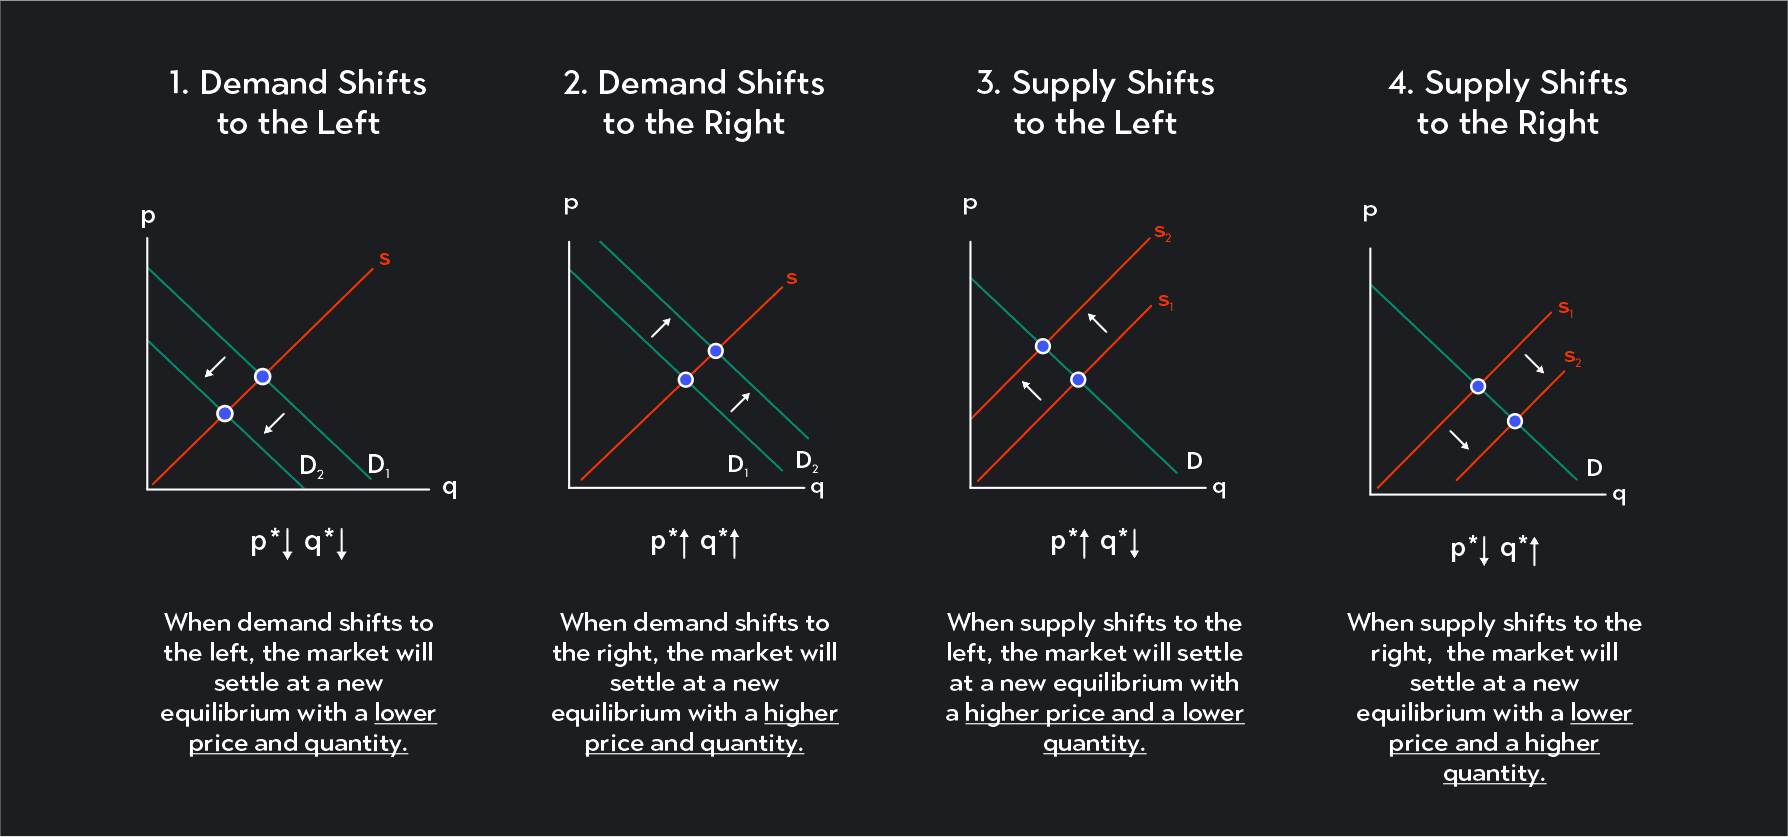
A shift in supply or demand will result in one of four outcomes:
If demand shifts inward to the left, both the equilibrium price and the equilibrium quantity fall.
If demand shifts out to the right, both the equilibrium price and the equilibrium quantity rise.
If supply shifts inward to the left, the equilibrium price rises and the equilibrium quantity falls.
If supply shifts outward to the right, the equilibrium price falls, and the equilibrium quantity rises.
Shifts in supply and demand can also occur simultaneously. If both the supply and demand curves shift, the effect on the market price and quantity can depend on the magnitude of each shift.
Shifts in supply and demand are distinct from movements along the supply or demand curve. A shift of the curve represents a change at every single price. For example, an outward shift of the supply curve means that quantity supplied increases for every given price. The entire curve moves.
A movement along the supply or demand curve represents how the quantity supplied (or demanded) changes in response to price changes.
Elasticity is a topic closely related to supply and demand. Elasticity measures the sensitivity of supply or demand to changes in prices or income.
Goods or services can either be elastic (sensitive to changes in price or income) or inelastic (relatively unresponsive to changes in price or income).
You may come across different types of elasticity. Here are the most common ones:
This measures the sensitivity of quantity demanded in response to a change in the price of a good. It is measured as the percentage change in quantity demanded of a good divided by the percentage change in its price.
Income elasticity of demand measures the percentage change in demand for a good relative to a percentage change in consumer incomes. It is measured as the percentage change in quantity demanded divided by the percentage change in consumer income.
The cross-price elasticity of demand measured the sensitivity of quantity demanded in response to a change in the price of another good. It is measured as the percentage change in quantity demanded of the first good divided by the percentage change in quantity demanded of the second good.
Price elasticity of supply measures the sensitivity of quantity supplied of a good relative to changes in its price. It is measured as the percentage change in quantity supplied divided by the percentage change in quantity demanded.
To learn more about elasticity read these articles:
Now you know the basics of supply and demand. Next, see if you can find something going on in the world that you think you could explain with shifting supply and demand curves.
As an added challenge, see if you can find something in the news that contradicts the basic mechanics of a perfectly competitive supply and model.
To deepen your understanding of supply and demand, familiarize yourself with the assumptions behind the model of perfect competition. You can also explore other economic models of markets. Monopoly, oligopoly, and monopsony are great places to start!
Outlier (from the co-founder of MasterClass) has brought together some of the world's best instructors, game designers, and filmmakers to create the future of online college.
Check out these related courses:


Economics
Learn what a labor market is, the factors that produce a shift in the labor market supply curve and demand curve, and their relationship to price floors.
Subject Matter Expert

Economics
This article is a comprehensive guide on the causes for a demand curve to change. Included are five common demand shifter examples.
Subject Matter Expert

Economics
Learn about what a supply curve is, how a supply curve works, examples, and a quick overview of the law of demand and supply.
Subject Matter Expert