Economics
Understanding the Supply Curve & How It Works
Learn about what a supply curve is, how a supply curve works, examples, and a quick overview of the law of demand and supply.
Alejandro Diaz Herrera
Subject Matter Expert

Economics
03.25.2022 • 9 min read
Subject Matter Expert
This article is a quick guide about what market clearing price is, how it works, its importance, as well as a list of examples and FAQs.
In This Article
When sellers and buyers encounter each other in a market, a process starts in which each side of the market pursues its best interests. Sellers in the market expect to earn the biggest possible profits—i.e., sell the most at the highest possible price. Buyers in the market look to maximize their utility and prefer to buy goods at the lowest possible price. So, how do both sides agree on a specific price? And, what’s special about this price?
If you’ve heard the term equilibrium price—the price at which supply equals demand—then you are already familiar with what a market clearing price is. These two terms can be used interchangeably.
A market clearing price is a price at which the quantity supplied matches the quantity demanded. At this price, every seller who is willing to sell at or below the market-clearing price can do so, and every buyer who is willing to buy at or above the market-clearing price can do so as well.
A market clearing price is a price at which the quantity supplied matches the quantity demanded.
For many years, economists thought that market-clearing was a natural phenomenon. To better understand how this phenomenon works, let’s look at an example using a supply and demand diagram.

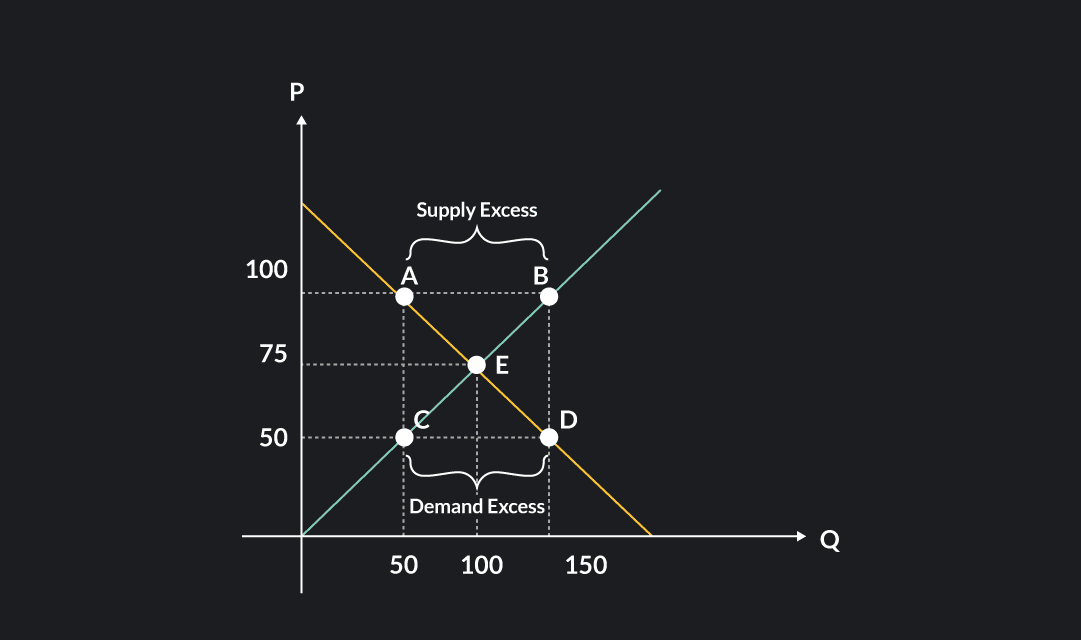
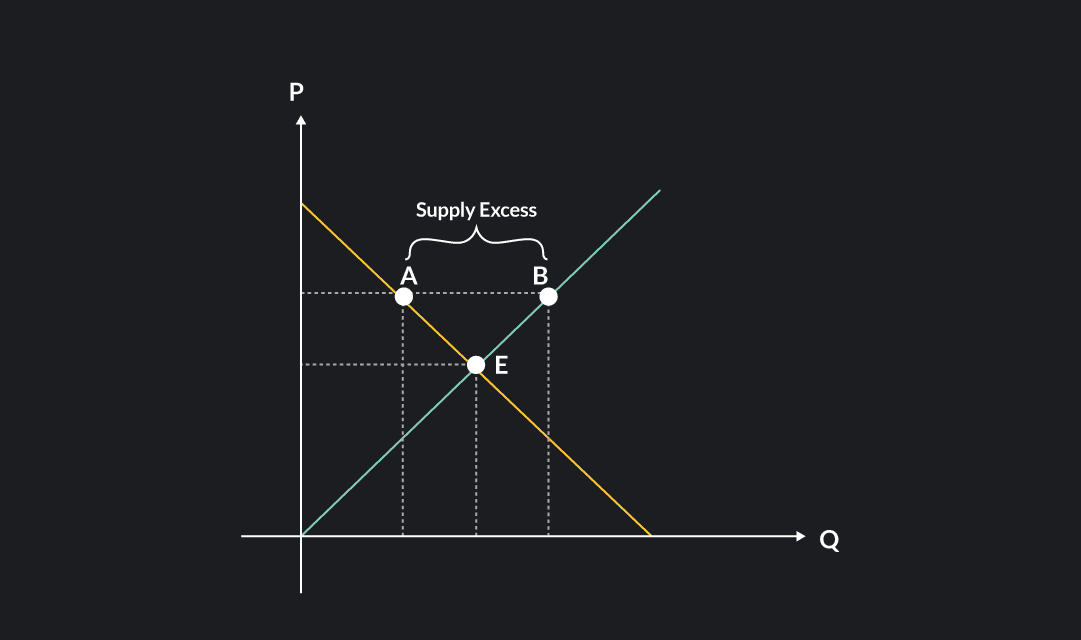
Start by looking at points A and B, where the price is equal to $100. At this price, sellers expect to sell a quantity of 150, but consumers are only willing to buy a quantity of 50. As a result, there is excess supply (a surplus of goods) in the market. A total of 150 units will be produced, but only 50 units will be sold. There will be 100 units produced for which there are no buyers.
One of the most recent and famous examples of excess supply was in 2020, when Russia and Saudi Arabia both raised their oil production and the amount of oil offered in the world temporarily exceeded demand. When this happens, the overproduction of goods puts downward pressure on prices and causes the market price to fall. This is exactly what happened to oil prices in 2020.
Notice in the diagram that as the price falls, there continues to be a surplus of goods in the market (albeit a smaller one) until the price reaches the market-clearing price. Remember, the market clearing price occurs at the point where supply equals demand. So in this diagram, the market clearing price is $75. Once the market reaches this point, the quantity supplied is exactly equal to the quantity demanded, so the price ceases to fall.
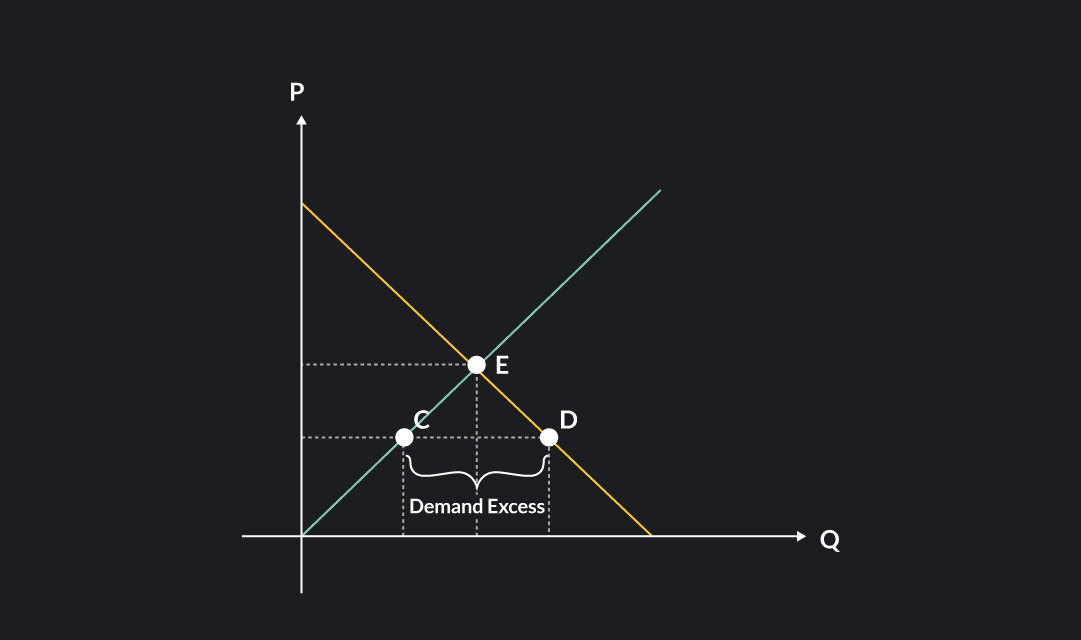
Now, let’s have a look at points C and D, where the price is equal to $50. At this price, demand exceeds supply. Consumers demand 150 units of the good, but producers are only willing to sell 50 units. This time, there is excess demand (a shortage of goods) in the market. Excess demand puts upward pressure on prices. Buyers desperate to buy the good will bid up the price on the limited quantity supplied. The price in the market will continue to rise until it hits equilibrium. At the equilibrium, quantity supplied catches up to quantity demanded, so the price ceases to increase further.
A good example of a market shortage was the market for facemasks shortly after the start of the COVID-19 pandemic. When news of the pandemic began to spread, people around the world rushed to buy facemasks, and demand for facemasks quickly overwhelmed supply. Because there were not enough facemasks to meet the sudden increase in demand, prices surged.
As you can see from both of these examples, if prices in the market deviate from the equilibrium, there are forces that push the price back towards equilibrium.
So far, we have discussed excess supply and excess demand. In both cases, quantity supplied and quantity demanded did not match, and as a result, there were forces that pushed supply and demand back towards equilibrium. The forces that drive the price to increase (in the case of excess demand) or decrease (in the case of excess supply) are the law of supply and the law of demand.
When a low price causes demand to exceed supply, the good will be scarce and suppliers will take advantage of a highly desired good which consumers are willing to pay a higher price for. On the other hand, if the price is too high, consumers will not demand a large quantity, and sellers will have to sell at a discounted price. This will cause them to sell a smaller quantity of goods. In either case, the incentives facing individual buyers and sellers will work to put the pull the market back to an equilibrium.
For many years, economists thought that market-clearing happened naturally without interference by outside actors or policymakers. They believe that market-clearing clearing mechanisms were at work in all markets. During the Great Depression, however, economists started to recognize this might not be the case. John Maynard Keynes, an English economist from the last century, noticed this when he observed labor markets. During the Great Depression many workers were unemployed and looking for jobs (an excess supply of workers), and yet, the labor market did not seem to be moving back to an equilibrium. Keynes’ observation opened up a discussion for how markets are sticky and will not always move quickly back towards an equilibrium
Several factors can affect the market clearing price. Perhaps the most important is how frequently transactions occur in the market. Economists call markets with many frequent transactions liquid markets. The market for stocks and many other financial assets are examples of liquid markets.
On the other hand, when transactions occur infrequently, markets are slower to adjust and clear. Economists call these types of markets illiquid markets.
When prices adjust slowly in a market, we say that prices in the market are sticky. This means that despite changes in market conditions, the price in the market might remain unchanged for an extended period of time. This is true of the market for many types of cars. When a new line of cars is launched, prices are defined for a year and will not change until the next line is launched. This is also what Keynes observed in the labor market. The “price” in labor markets is the wage paid to employees. You’ll often hear economists say that “wages are sticky.” This is because employers typically hire workers with wage contracts and salaries that are fixed for a particular period of time. Wages and salaries aren’t usually adjusted day-to-day or even week-to-week, so they are slow to adjust to changes in supply and demand.
The COVID-19 pandemic is an example of how shocks can affect markets. The pandemic caused a swift change in the demand and supply of many goods such as toilet paper, ventilators, and the demand for services that became inaccessible due to lockdowns and other preventive policies. For goods and services where demand suddenly increased, suppliers needed to adapt and ramp up production, but due to the sudden and unexpected nature of the shock, suppliers were not always able to adapt quickly. Whether these shocks are temporary or permanent, they can produce shortages and surpluses that disrupt markets by knocking them out of equilibrium.
When a new technology reduces production costs, suppliers can produce more goods at a lower cost, and therefore, sell at a lower price. In this case, the equilibrium price and quantity will shift to a lower price and greater quantity. In a supply and demand diagram, this can be represented as a shift of the supply curve. The same could be the case for the arrival of new competitors in the market. The presence of new firms in a market increases supply and results in a shift of the equilibrium.
Taxes, subsidies, price caps, regulations, even bans to specific companies. All of these affect the equilibrium and can affect how markets clear. For example, the 2019 US government’s ban on Huawei created a temporary shortage of goods in the market for a specific range of smartphones.
Let’s do an example of a market where the price is outside of the equilibrium. Suppose the demand for bicycles is given by the following equation:
On the other side, suppose that the supply for bicycles in the same market is given by the equation:
At the beginning, suppose that the price in the market is P=90. At this price level, consumers will demand:
Producers will offer:
Quantity demanded is lower than quantity supplied, causing a surplus (excess supply) of 170 units of the good. =330-160=170. Now suppose that a new price level of P=10 is defined. Since the price is lower, producers will have an incentive to produce fewer goods, but the consumers will demand a higher quantity. The new respective quantities for demand and supply at this price level are (respectively):
Since quantity supplied is lower than quantity demanded, we have a shortage of 170 units.
=130-300=-170.
Finally, to find the equilibrium, we must find a price where quantity supplied equals quantity demanded. We can do this by equating both functions:
At a price of P=50, consumers will demand Q=230, and producers will supply the same amount. We have found the market clearing price!
The process to find the market clearing price consists of finding the moment in which demand and supply are willing to exchange the same quantity at the same price. Let’s do another example. Suppose that in the market for jackets, supply and demand are defined by the following functions:
To find the market clearing price, we need to find the price for which .
When the price is 140, quantity demanded is equal to quantity supplied, and the market equilibrium will be: (Q,P)=(80,140).
As we have discussed, when the price is above the equilibrium price, there will be an excess supply of goods (a surplus). In this case, consumers are willing to buy fewer units of the good than suppliers would like to sell. Graphically, this is represented by Point A and B. If a market experiences a surplus, the laws of supply and demand should drive the market price back down to the market clearing price.

If price is below the equilibrium, consumers will demand more goods than what suppliers are willing to sell. This translates to an excess of demand of goods (a shortage). Graphically, this is represented by Point C and D. If a market experiences a shortage, the laws of supply and demand should drive the market price back up to the market clearing price.

Outlier (from the co-founder of MasterClass) has brought together some of the world's best instructors, game designers, and filmmakers to create the future of online college.
Check out these related courses:

Economics
Learn about what a supply curve is, how a supply curve works, examples, and a quick overview of the law of demand and supply.
Subject Matter Expert

Economics
This article gives a quick overview of perfect competition in microeconomics with examples.
Subject Matter Expert

Economics
This article is a comprehensive guide on the causes for a demand curve to change. Included are five common demand shifter examples.
Subject Matter Expert