
Economics
5 Things That Can Shift a Demand Curve
This article is a comprehensive guide on the causes for a demand curve to change. Included are five common demand shifter examples.
Mendy Wolff
Subject Matter Expert

Economics
02.18.2022 • 8 min read
Subject Matter Expert
This is an overview of what an equilibrium price is, the formula, table, difference between equilibrium and disequilibrium, how to calculate it, and examples.
In This Article
When you go to buy something, let’s say your groceries, have you ever wondered why things cost what they cost? Why should you pay 3 dollars for a soda and 6 dollars for some slices of cheese? The simple answer is that these prices are not randomly decided. They result from a whole process in which two main forces of the economy find themselves in an agreement for that price.
Let’s look first at the consumers who demand the product (that’s you). You buy a soda because you get a utility from it, and that utility is what you are paying for. But think for a moment, would the soda taste better if it was more expensive or cheaper? Of course not. The soda is exactly the same whether you have to pay 3 dollars for it, or you get it for free. Therefore, it makes sense to think that consumers will be happy to pay lower prices for the same product.
By having a look at the demand curve, we can note that lower prices will mean that a bigger quantity is demanded. Why is this? Think about yourself and that soda, you might be willing to pay 3 dollars for it, but would you be willing to pay 20 dollars? There is a maximum price you would be willing to pay for that soda, and this maximum price will be different for every consumer in the market.
This is what we call a reservation price or the maximum price a consumer is willing to pay for a specific product.
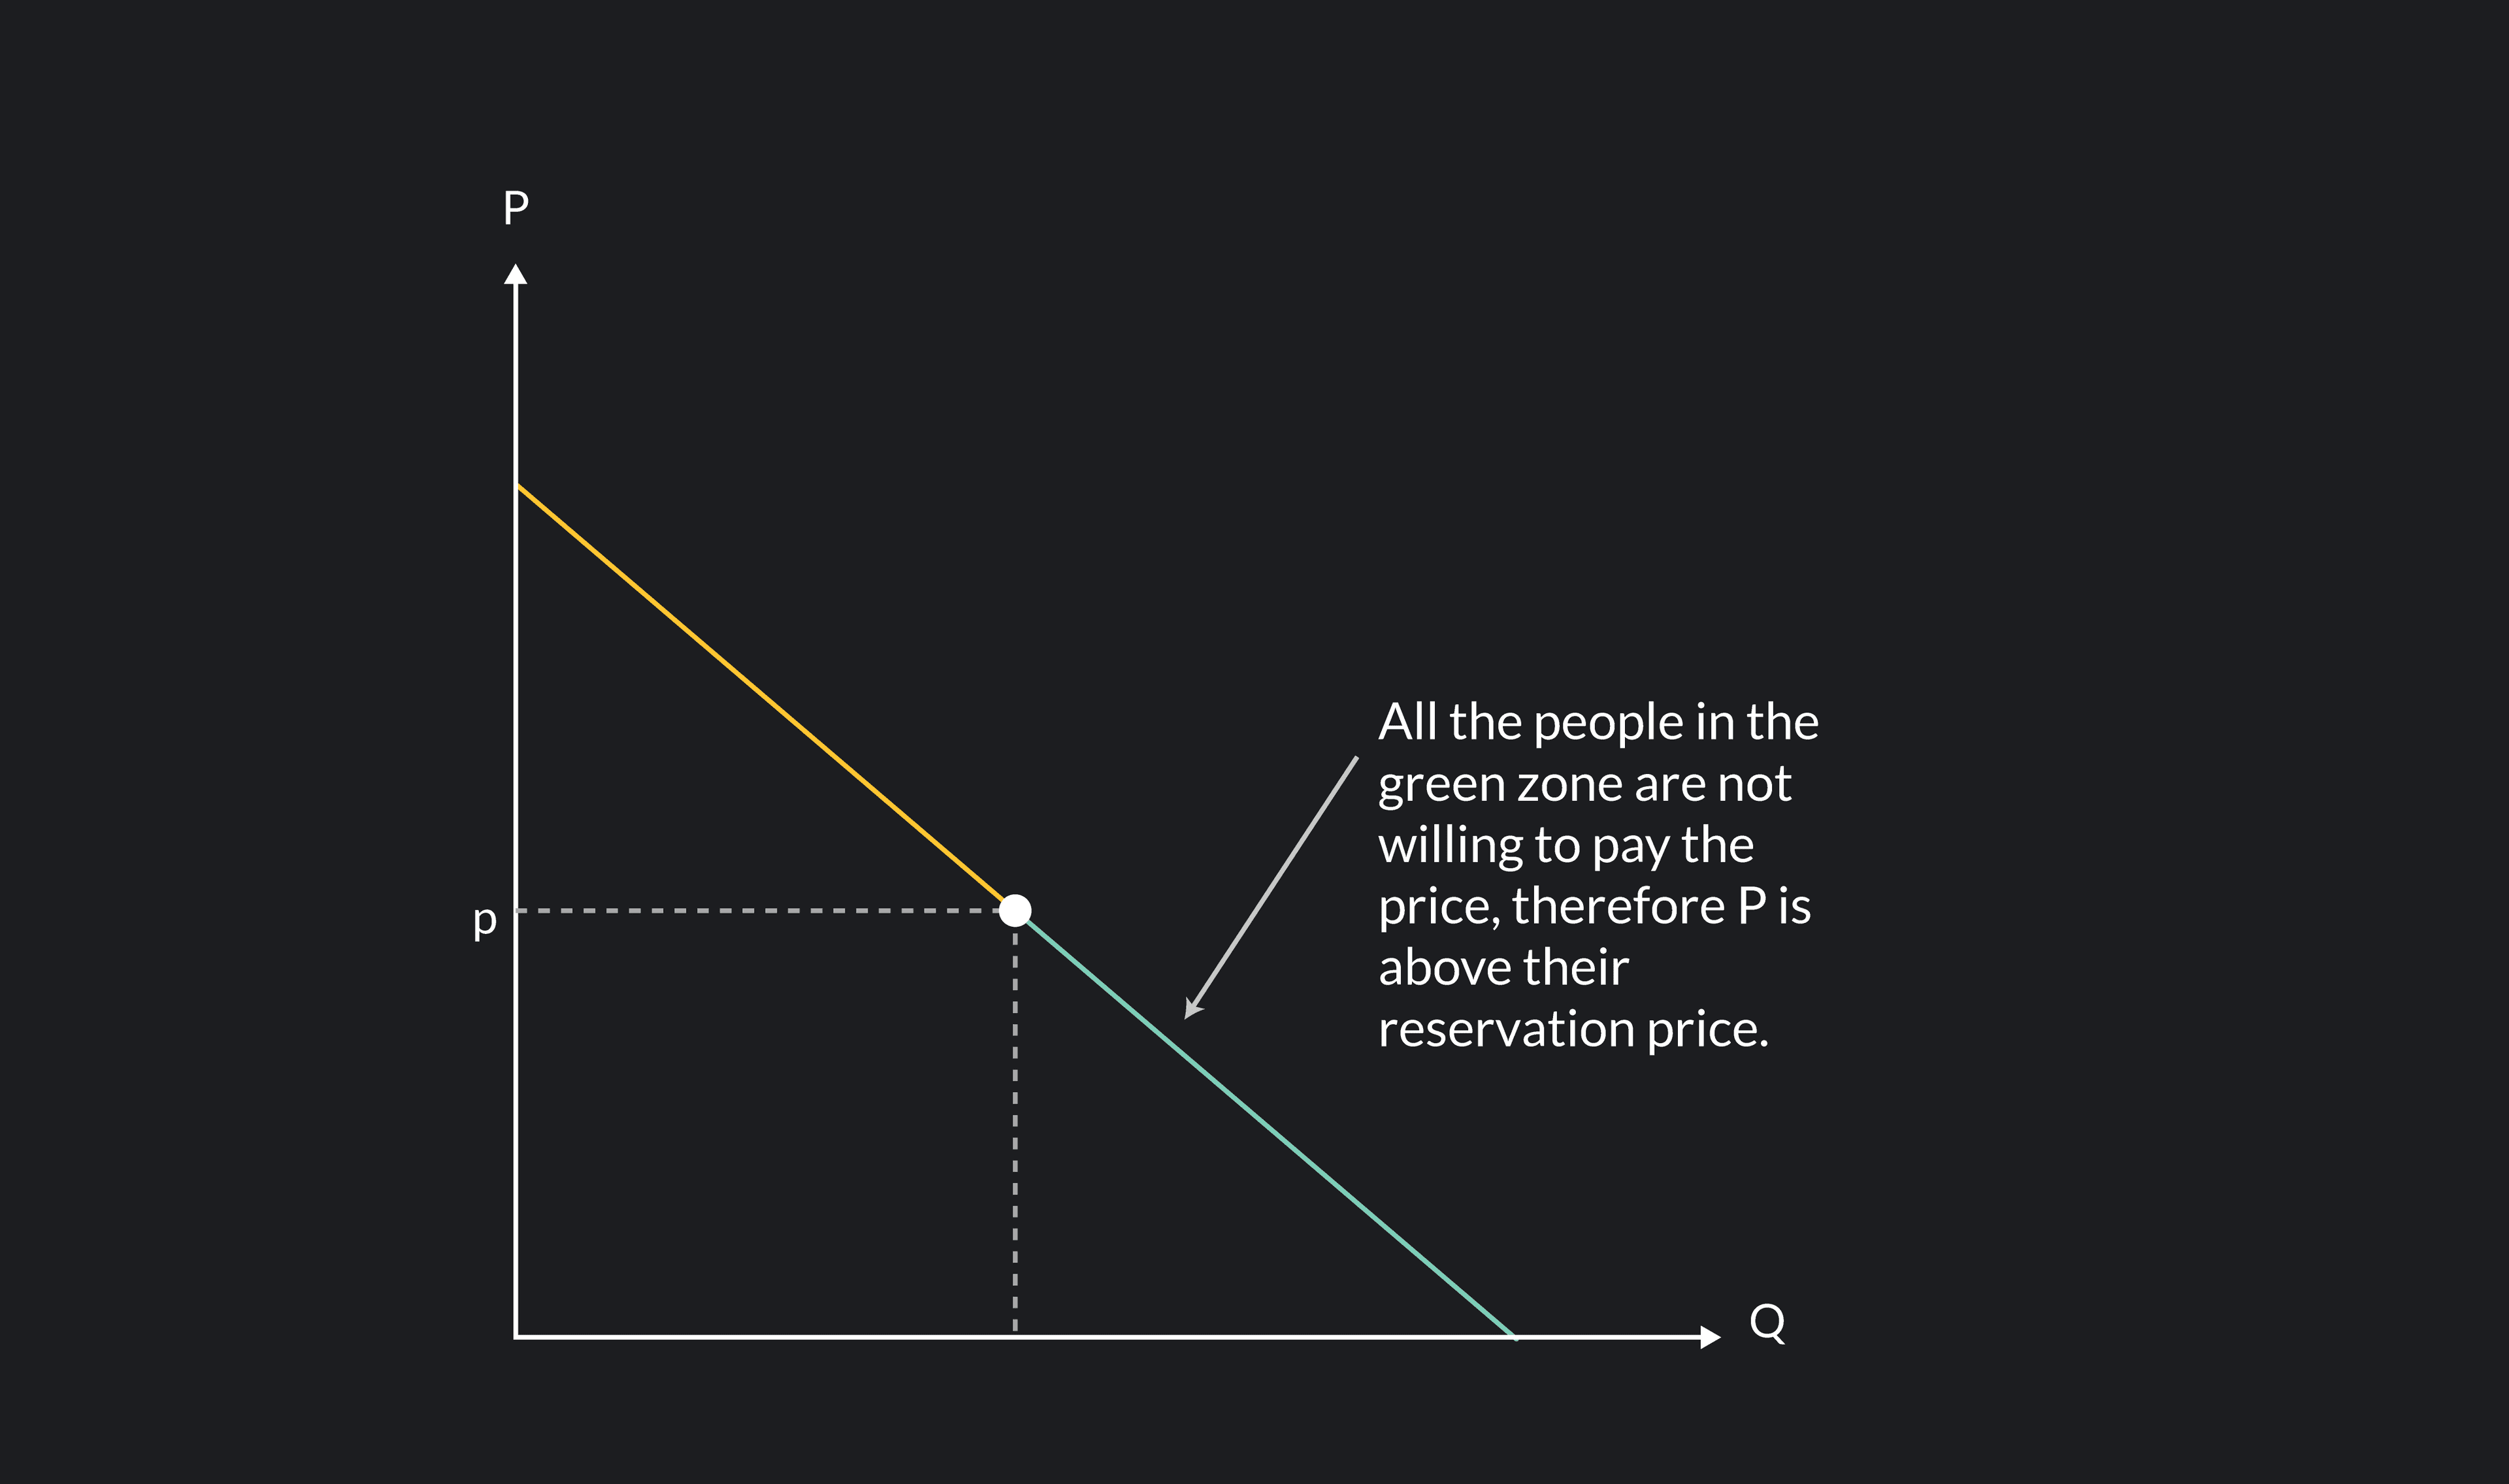
As you can see in the graph, as the price decreases, more people find the soda below their reservation price and are now willing to pay for it. As a result, the total quantity of sodas demanded will increase. The opposite is also true; if the price increases it will exceed the reservation price of more consumers, and fewer people will be willing to pay for a soda.
Then, we have the producers who supply the product. Remember that producers face costs with each soda can such as production, marketing, and distribution to stores. They are in the business for profit. If they are not earning any money from the process, they will not be able to produce sodas. The price must be enough to cover the production costs and make a profit. The higher the price, the better for the producer, since they will earn higher profits.
The same way consumers have a reservation price, producers will have theirs (yes, it is also named reservation price, so when you hear this term, you must look at the context and check whether you are talking about a consumer or a producer to know which definition to use).
Reservation price also can refer to a minimum price a producer is willing to accept in order to sell a specific product.
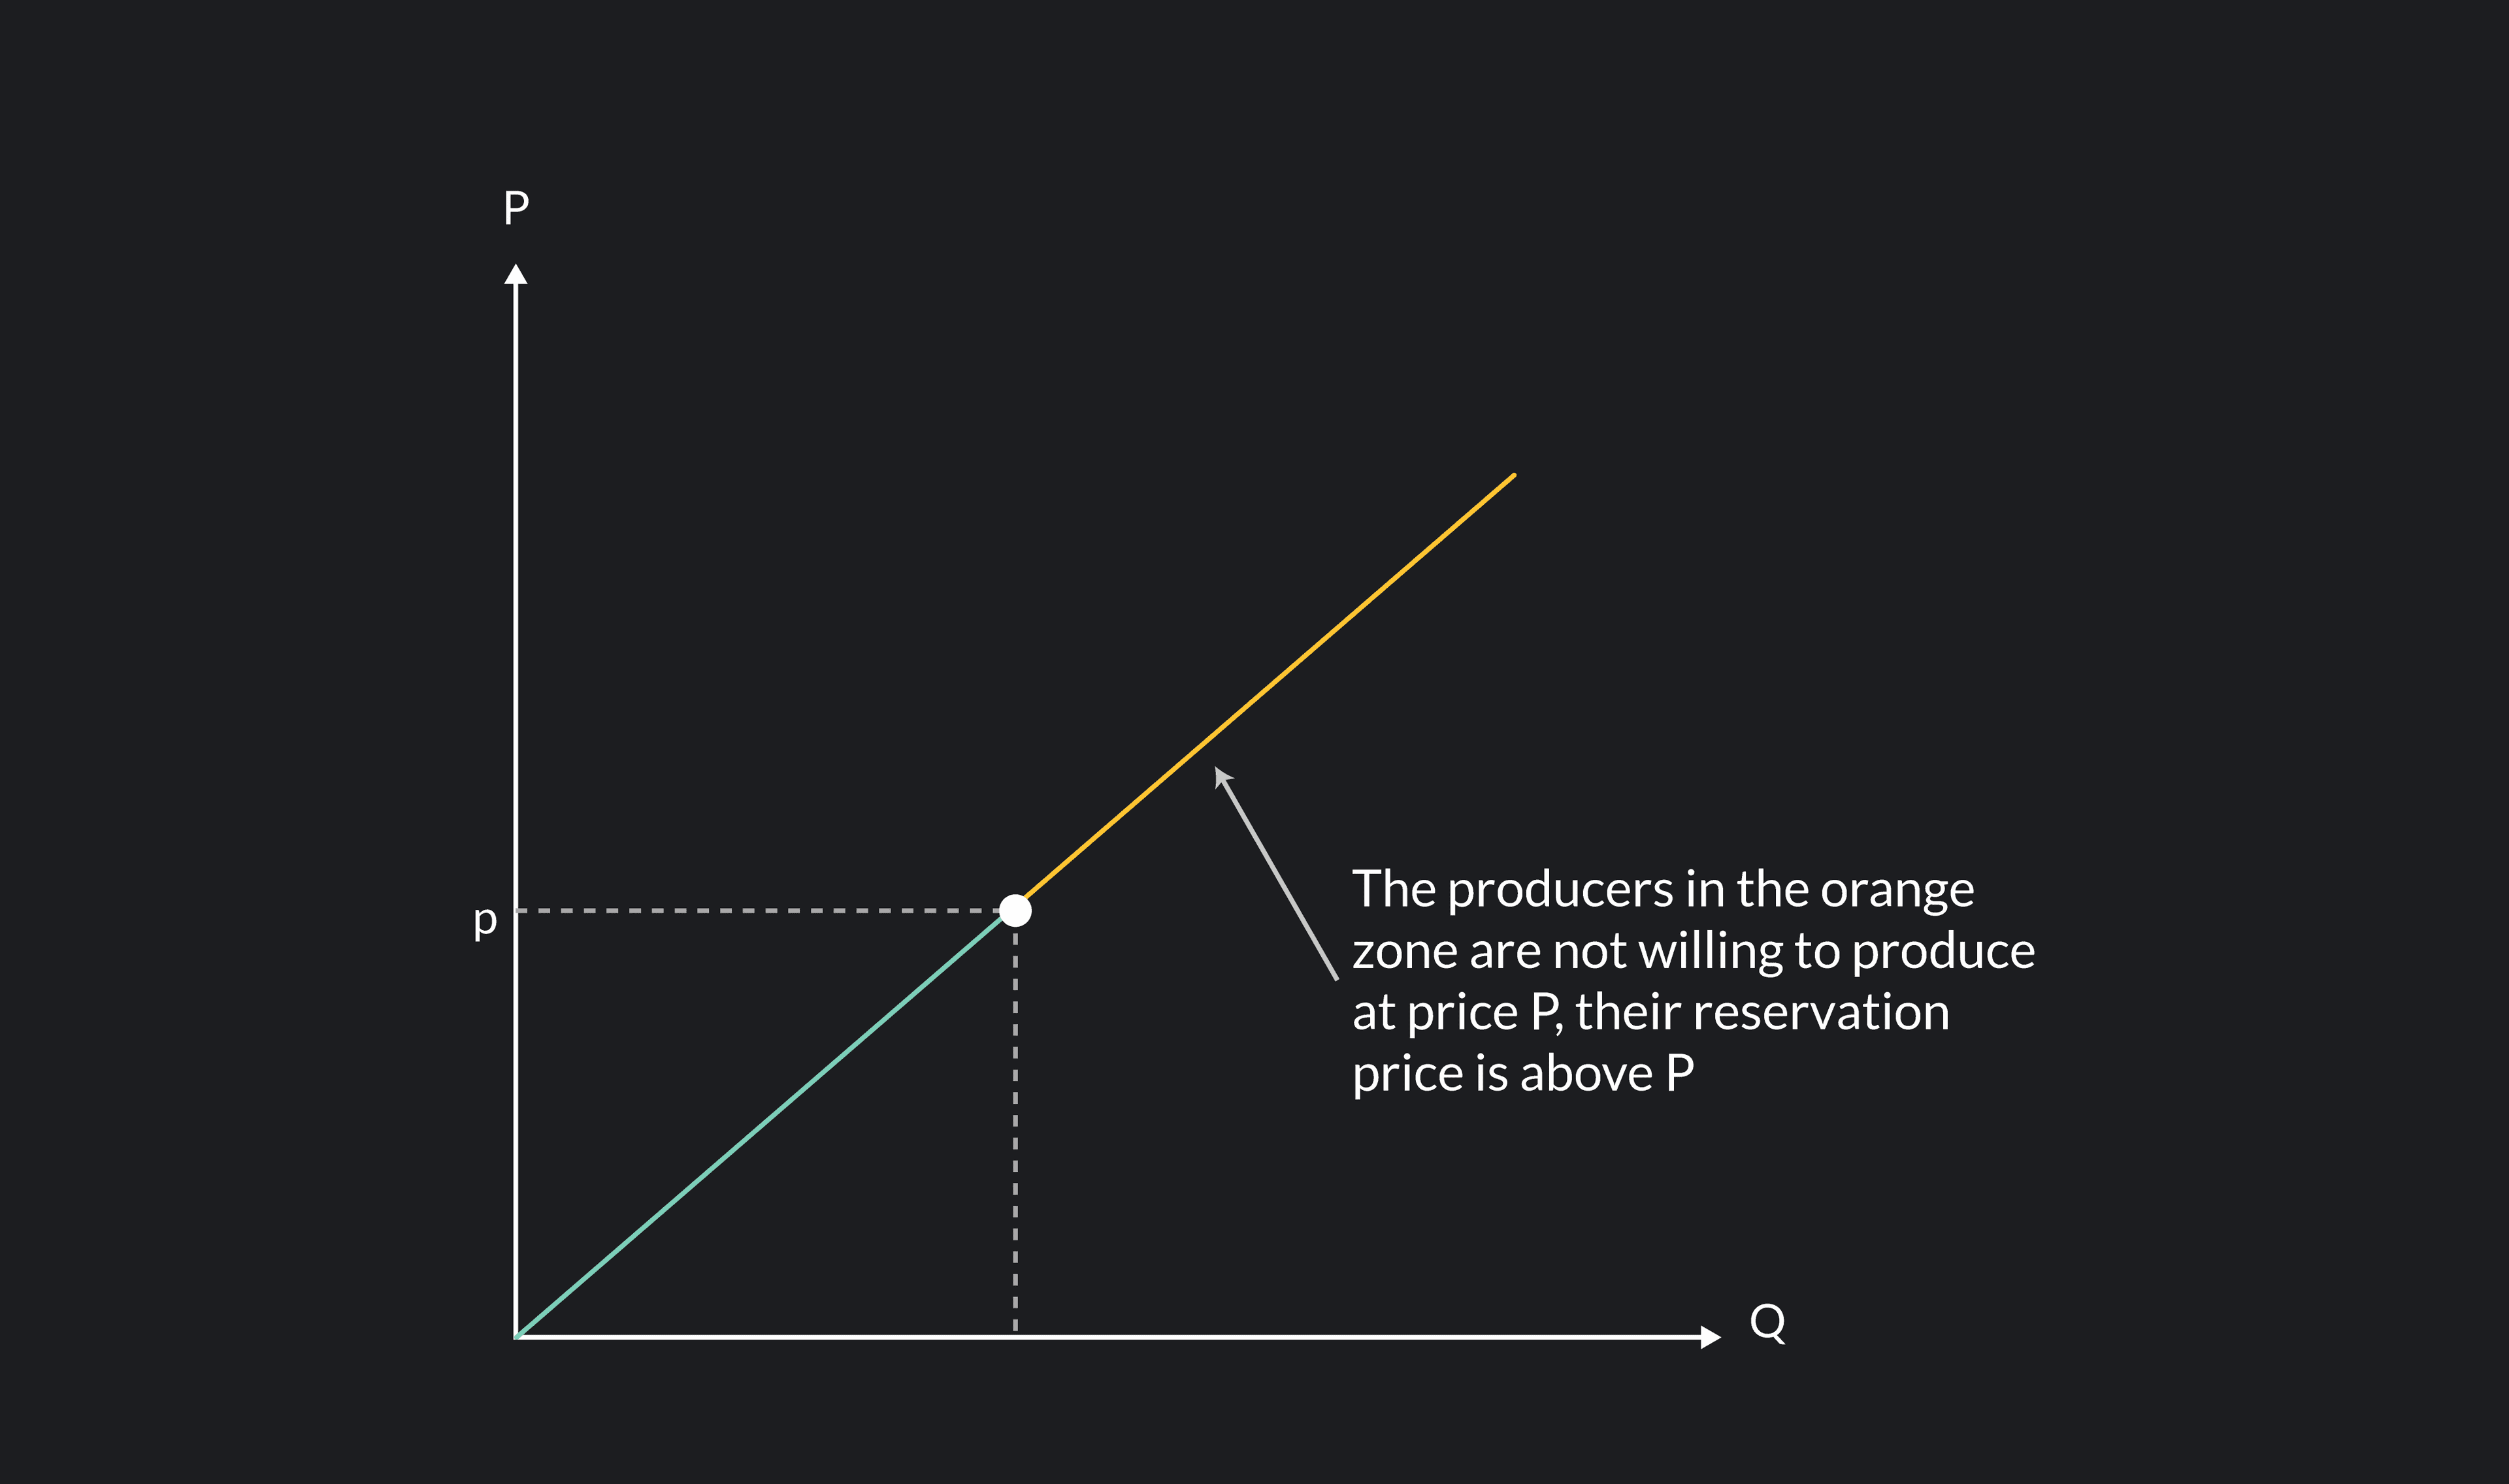
Looking at the graph of the supply curve, you can see that higher prices will allow for producers who were not producing before – because the previous price was below their reservation price – to produce now. Consequently, the total quantity of sodas offered will increase. The opposite is also true; if the price decreases, it will fall short to the reservation price of more producers, and they will not be willing to produce sodas anymore.
So far, we have seen that consumers and producers want opposite things in terms of the price. There is no way that both sides get what they want. The best they can do is start a large negotiation until they find a price where both of them feel they are getting the best deal they can; that is the logic behind what we will call an equilibrium price.
Equilibrium price is the price at which both demand and supply agree in the quantity exchanged. It is unique and should not be affected by any external force or influence.
When we graph the demand and supply curves together, you see that there is one point – and only one – in which both curves intersect each other. At this point, there is a specific price and quantity at which both the supply and demand coincide.
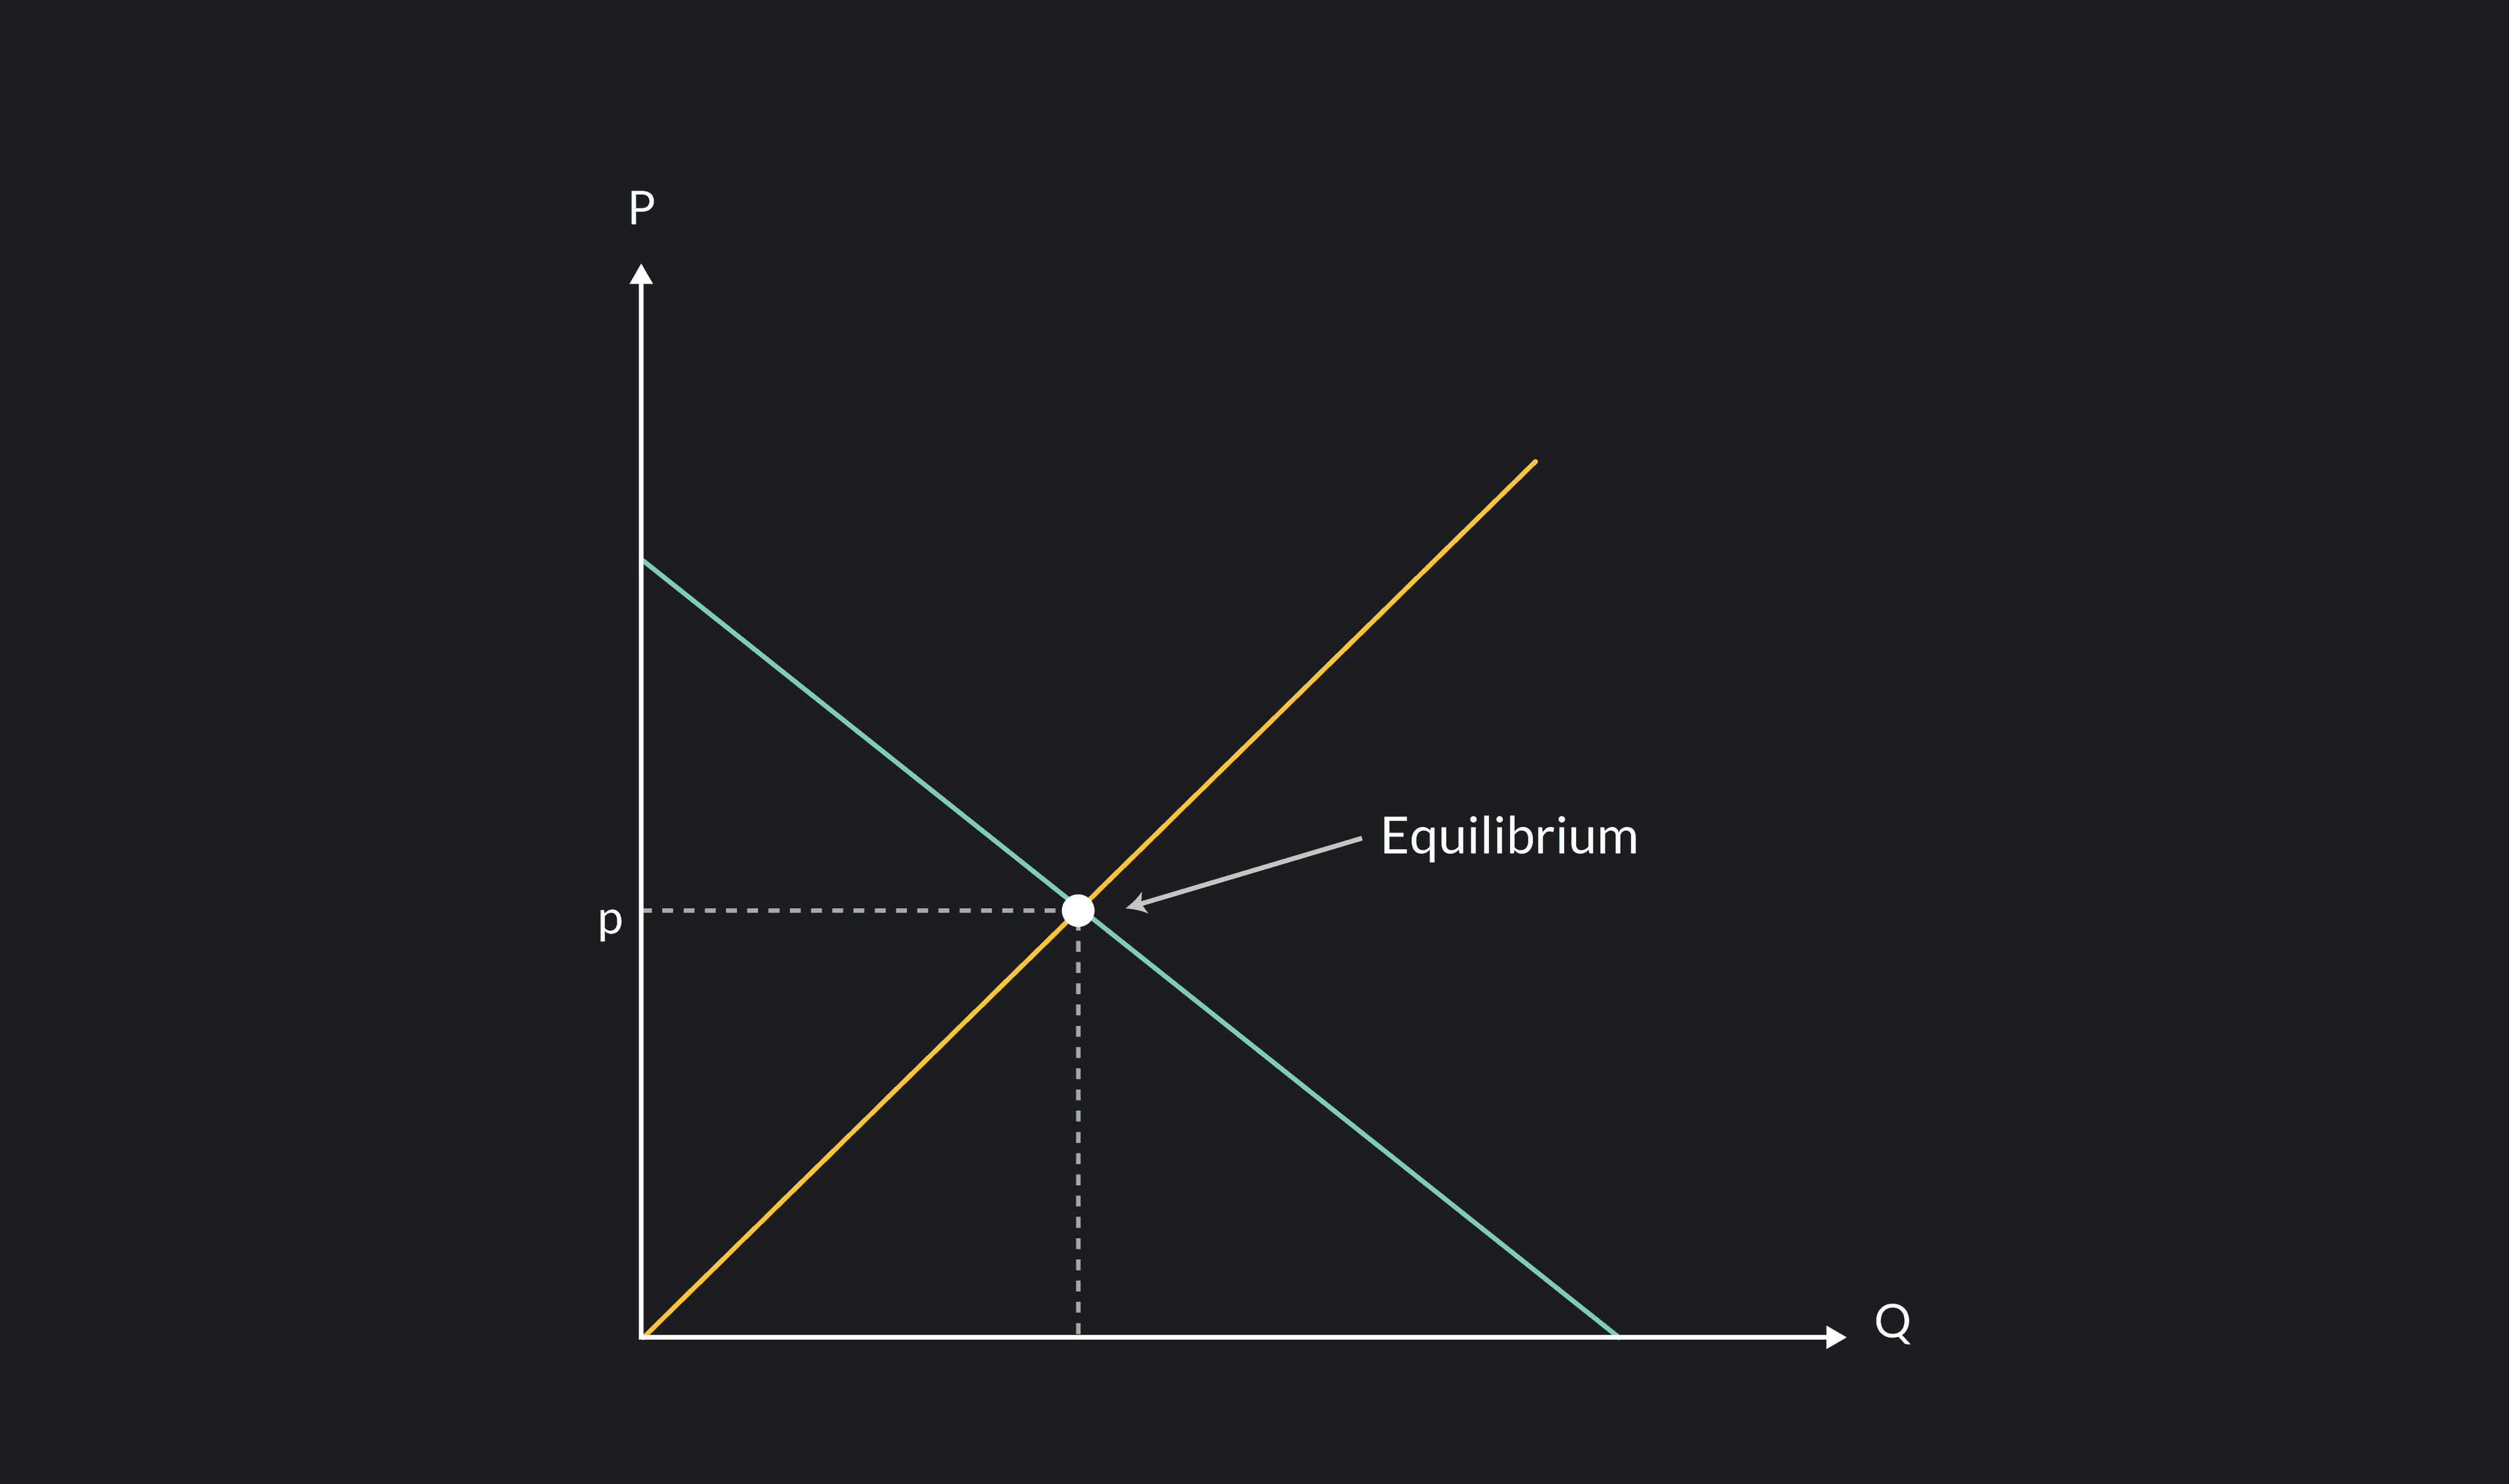
Think about the equilibrium in the graph. It’s true that suppliers would like to charge a higher price. If they do so, there won’t be enough people willing to pay that price, and the quantity produced will not match the quantity demanded.
On the other side, the demanders would like to pay a lower price. But similarly, if they do so, there won’t be enough producers willing to sell at that price. Again, the quantities demanded and produced won’t match. Therefore, the equilibrium price is the only price at which demand and supply will both coincide.
If equilibrium price is the only moment in which both demand and supply coincide in the quantity, then the best way to find it is to find the moment where both the quantity demanded and the quantity supplied will be the same. Mathematically, we are talking about the price where
Recall that both and are expressed as a function of the price P. Here, we are talking about solving a system of equations. We have two equations – one for demand and one for supply – and two variables called quantity and price. Note that the quantity will be the same for both demand and supply. This will yield a unique solution, which will be a pair (P*,Q*).
Before doing an algebraic example, let’s have a look at how the equilibrium price will look by using a table to list how the demand and the supply will behave at different prices. Suppose we have a demand function:
And we also have a supply function:
For different levels of price, we will have different quantities demanded and offered. The following table shows some of them:
If you look at row 8, note that it is the only row where the quantity demanded and the quantity offered both coincide at the price of 1600.
In this case, our equilibrium would be:
This means that at a price of 1600, the consumers will demand a total of 1800 units of the product, and the producers will offer a total of 1800 units of the product as well.
Before doing some other examples of how to find an equilibrium, let’s discuss the concept of disequilibrium. So far, we have defined that when the market is in equilibrium, both the demand and the supply will agree in price and quantity. Moreover, this price and quantity are unique. But another important aspect of the equilibrium is the fact that it should not be affected by external forces that can affect demand or supply outside of the equilibrium.
A good example of an external force that would affect the equilibrium is the ongoing COVID pandemic, which has affected both sides without being a specific aspect of the market itself.
Before the pandemic, there was an equilibrium in the market for facemasks. As COVID arrived, facemasks suddenly became an important product, and the demand for facemasks increased before the supply could adapt to the situation. This created an imbalance between the quantity supplied, which remained equal, and the new quantity demanded, which was bigger than the equilibrium. This caused a shortage of facemasks.
The mismatch between the demand and the supply is caused by something external called disequilibrium and is a common phenomenon.
Beyond a global pandemic, other examples of what can cause a disequilibrium are:
Regulatory – Products are an example. They require a license or permission to be bought such as prescription drugs.
Other industries – what happens in one industry can affect another, if the final product of the first one is an input in the second. For example, the shortage of computer chips that is currently affecting the car industry).
Natural disasters – They can increase the demand for a product or decrease the supply. One example is an earthquake that destroys a factory).
To conclude, let’s do two exercises to practice how to find an equilibrium. For the first one, consider a smartphone market in which the demanders are represented by the demand function:
And they're represented by a supply function:
As we have mentioned before, the equilibrium will be where the quantity demanded and the quantity supplied are the equal:
So we replace the functions and find the price that satisfies this equality.
The equilibrium price will be P=500. Now, we can check that at this price the demand and the supply will coincide in the quantity.
Demand→ = 1,000,000-100,000 P=1,000,000
Supply → = 100,000 P=100,000(500)=50,000,000
And our equilibrium will be:
In this market 50 million smartphones will be sold at a price of 500 dollars each.
For a second example, we will show that the equilibrium can also be found by equalizing the price of the demand and the supply instead of the quantity. Suppose we have a small market for sandwiches, where the consumers define the price they are willing to pay () as a function of the quantity they demand:
But the cafeteria defines the quantity of sandwiches they will produce as a function of the price:
To find the equilibrium, this time we will find when the consumers are willing to pay the same price that the cafeteria is willing to charge:
Our first step will be to find how the price the cafeteria wants to charge is defined as a function of the quantity of sandwiches produced:
Now we can solve for the quantity that makes the price of consumers and producers match.
We can now check that at a quantity exchanged of 20 sandwiches, the consumers will be willing to pay the same price that the cafeteria wants to charge for each sandwich.
Demand→
Supply →
Our equilibrium will be (P*,Q*) = (8, 20) and in this small market 20 sandwiches will be sold at a price of 8 dollars each.
Outlier (from the co-founder of MasterClass) has brought together some of the world's best instructors, game designers, and filmmakers to create the future of online college.
Check out these related courses:


Economics
This article is a comprehensive guide on the causes for a demand curve to change. Included are five common demand shifter examples.
Subject Matter Expert

Economics
Ever wondered why some things never seem to go on sale? Price Elasticity of Demand, one of the key concepts of Microeconomics, can help you answer this question. In this article, we’ll explore the relationship between price and demand, and then dive deep on various types of elasticity.
Subject Matter Expert
Economics
This article gives a quick overview of perfect competition in microeconomics with examples.
Subject Matter Expert