In This Article
Shift in Demand: What Does It Mean?
What Is a Shift?
What Causes a Shift in the Demand Curve?
5 Phenomenons That Cause a Shift in the Demand Curve
Final Demand Curve FAQs
Shift in Demand: What Does It Mean?
To understand what is a shift, let’s first go over what a demand curve is in economics.
A demand curve is a model that plots the demand schedule for a specific good or service. As we can see in the below graph, the demand curve details exactly how many units are wanted at each price. The difference in the quantity of demand at each price is an outcome of the law of demand: as the price increases, people buy less.
What Is a Shift?
A shift in the demand curve is when the price stays the same, but some other unusual occurrence happens that pushes the demand schedule to either increase or decrease at each price point.
The five things we will learn about later in this article are the different events that shift the demand curve.
What Causes a Shift in the Demand Curve?
Let’s first review how the demand curve functions and the difference between a movement along the demand curve and a shift in the demand curve.
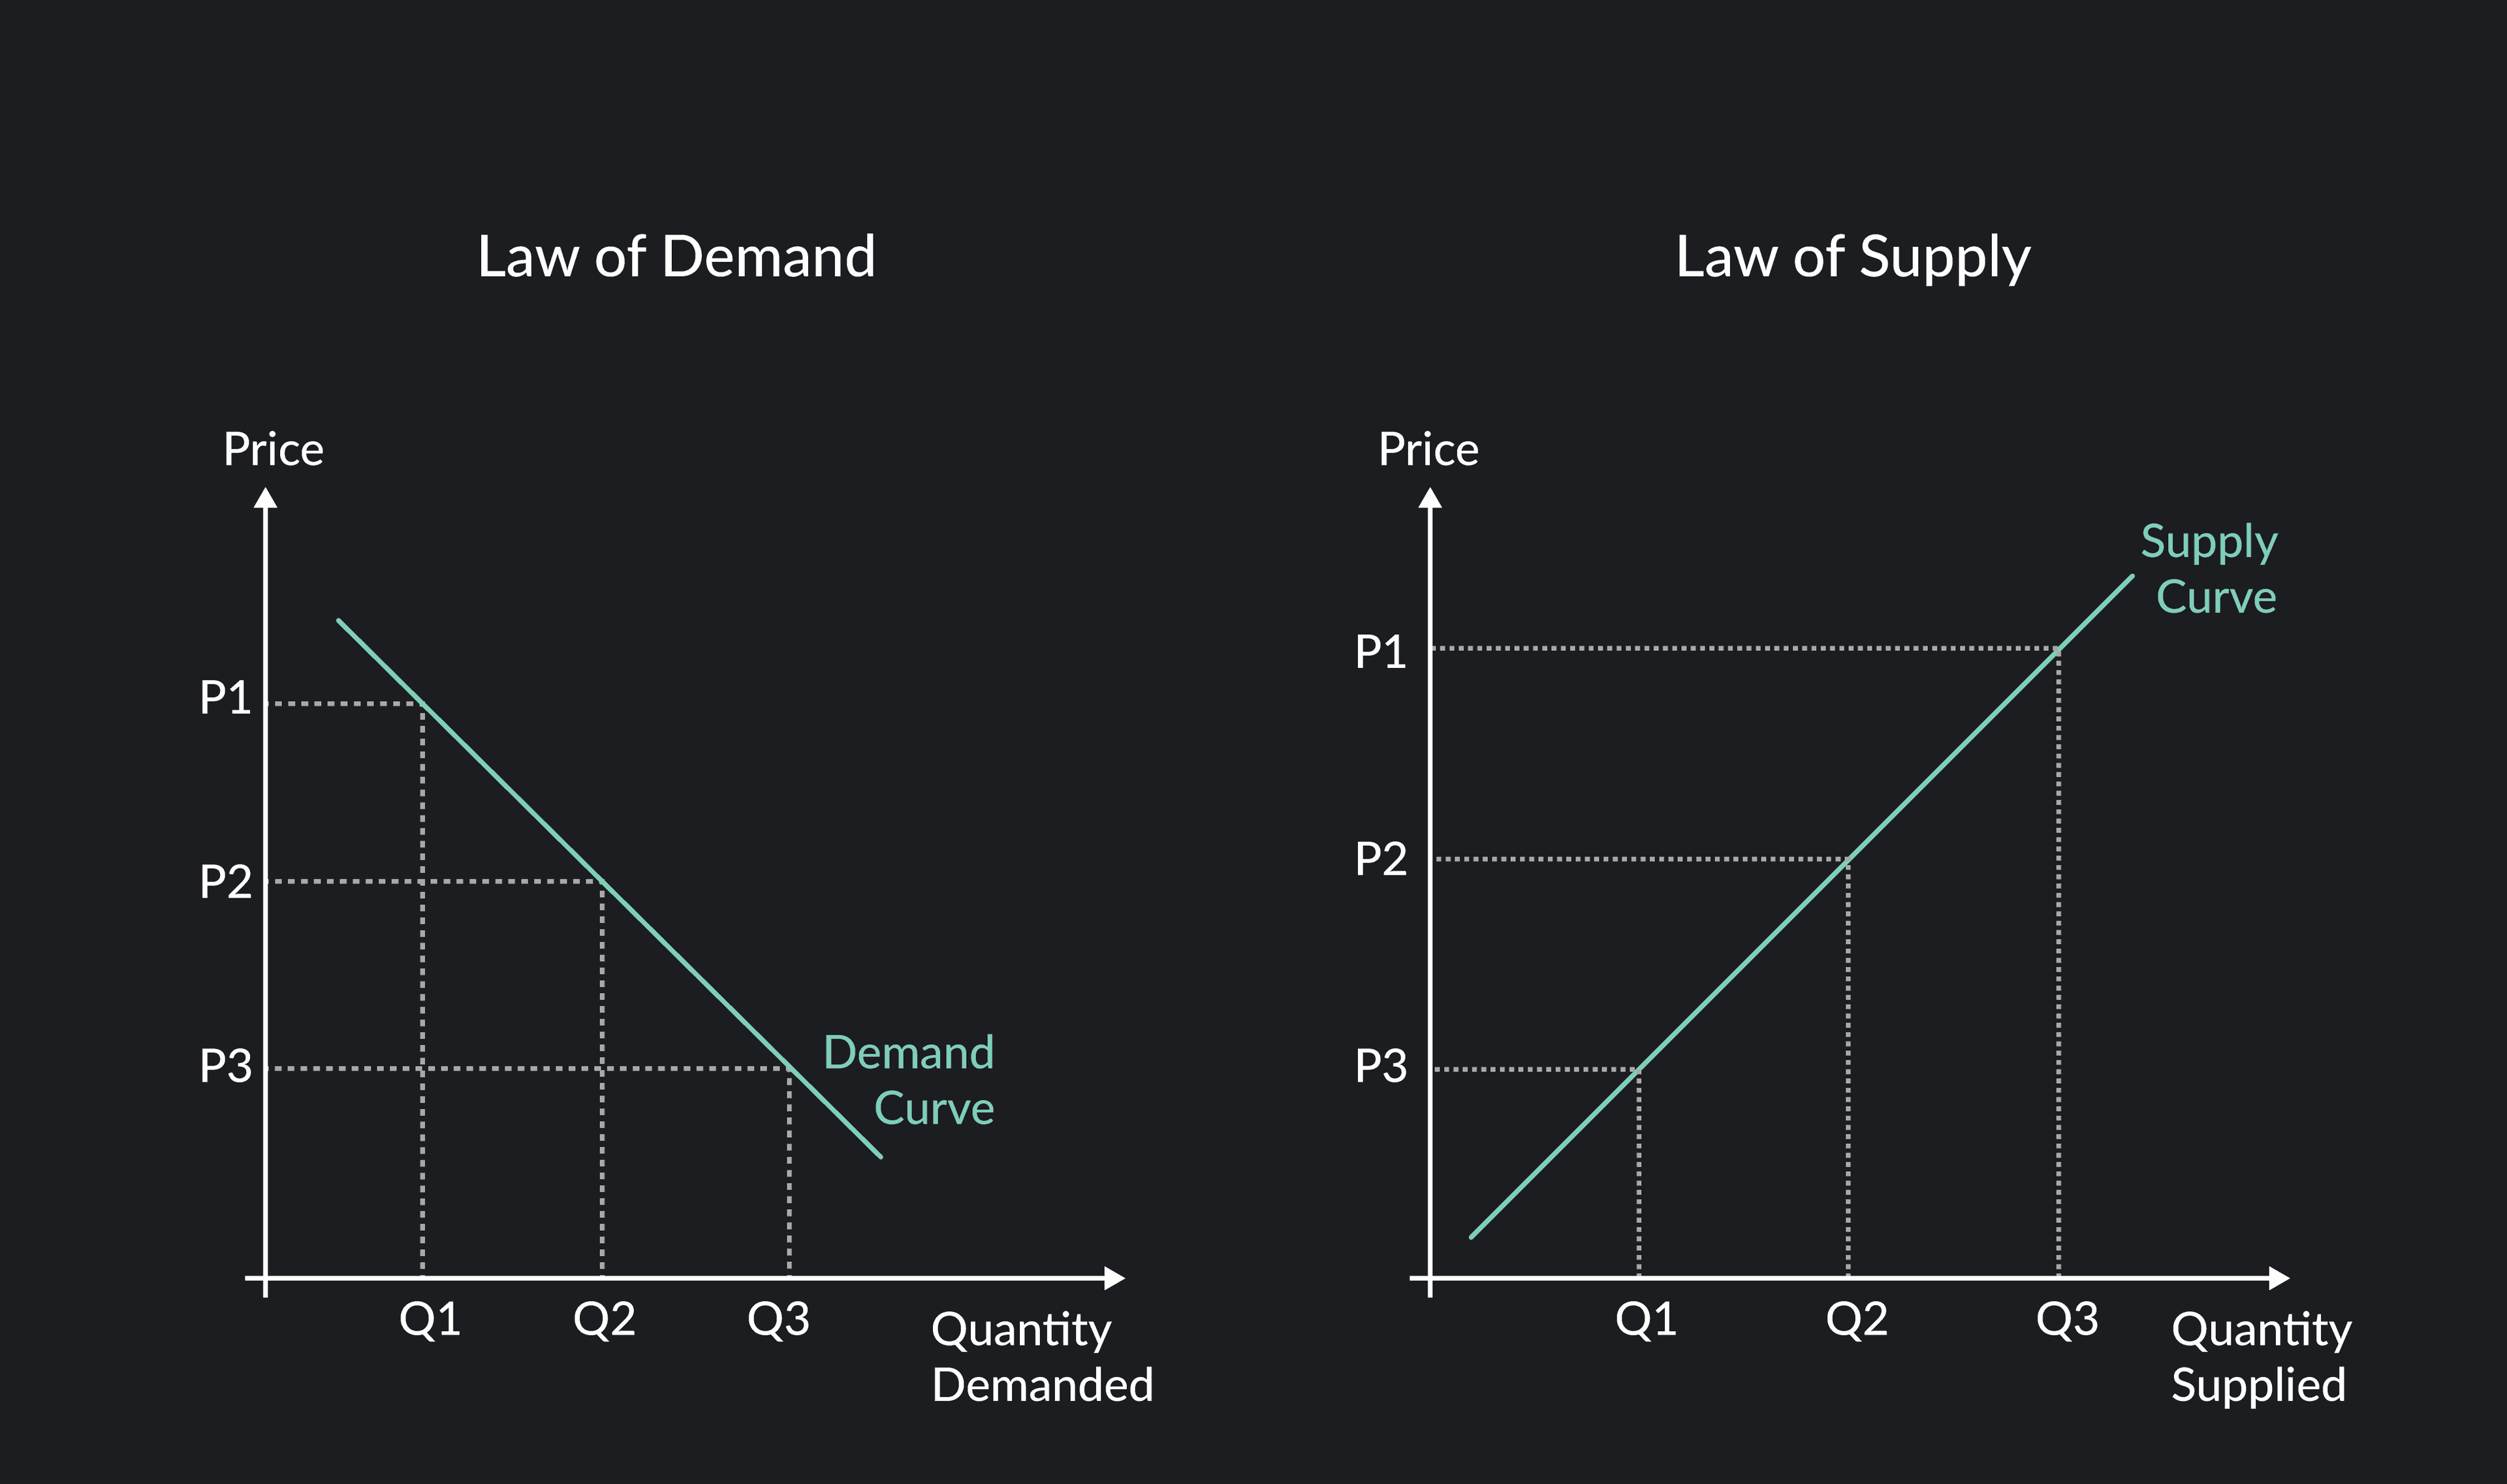
Probably the most famous model in economics is the Supply and Demand Curve. The model is a combination of two intuitive ideas: the Law of Demand and the Law of Supply.
The law of demand says that as the price of a good or service rises, the demand for it will decrease; and so conversely, as the price decreases, the quantity of demand will increase. That’s why the demand curve is downward sloping since, as the price on the horizontal axis (P) rises, the quantity of demand (Q) on the vertical axis decreases.
The law of supply says that an increase in price will increase the willingness of sellers to supply or produce more of that good. The Supply Curve is upward sloping since, as prices (P) rise, the quantity (Q) of supply increases; and as the price decreases, the willingness of sellers to supply decreases.
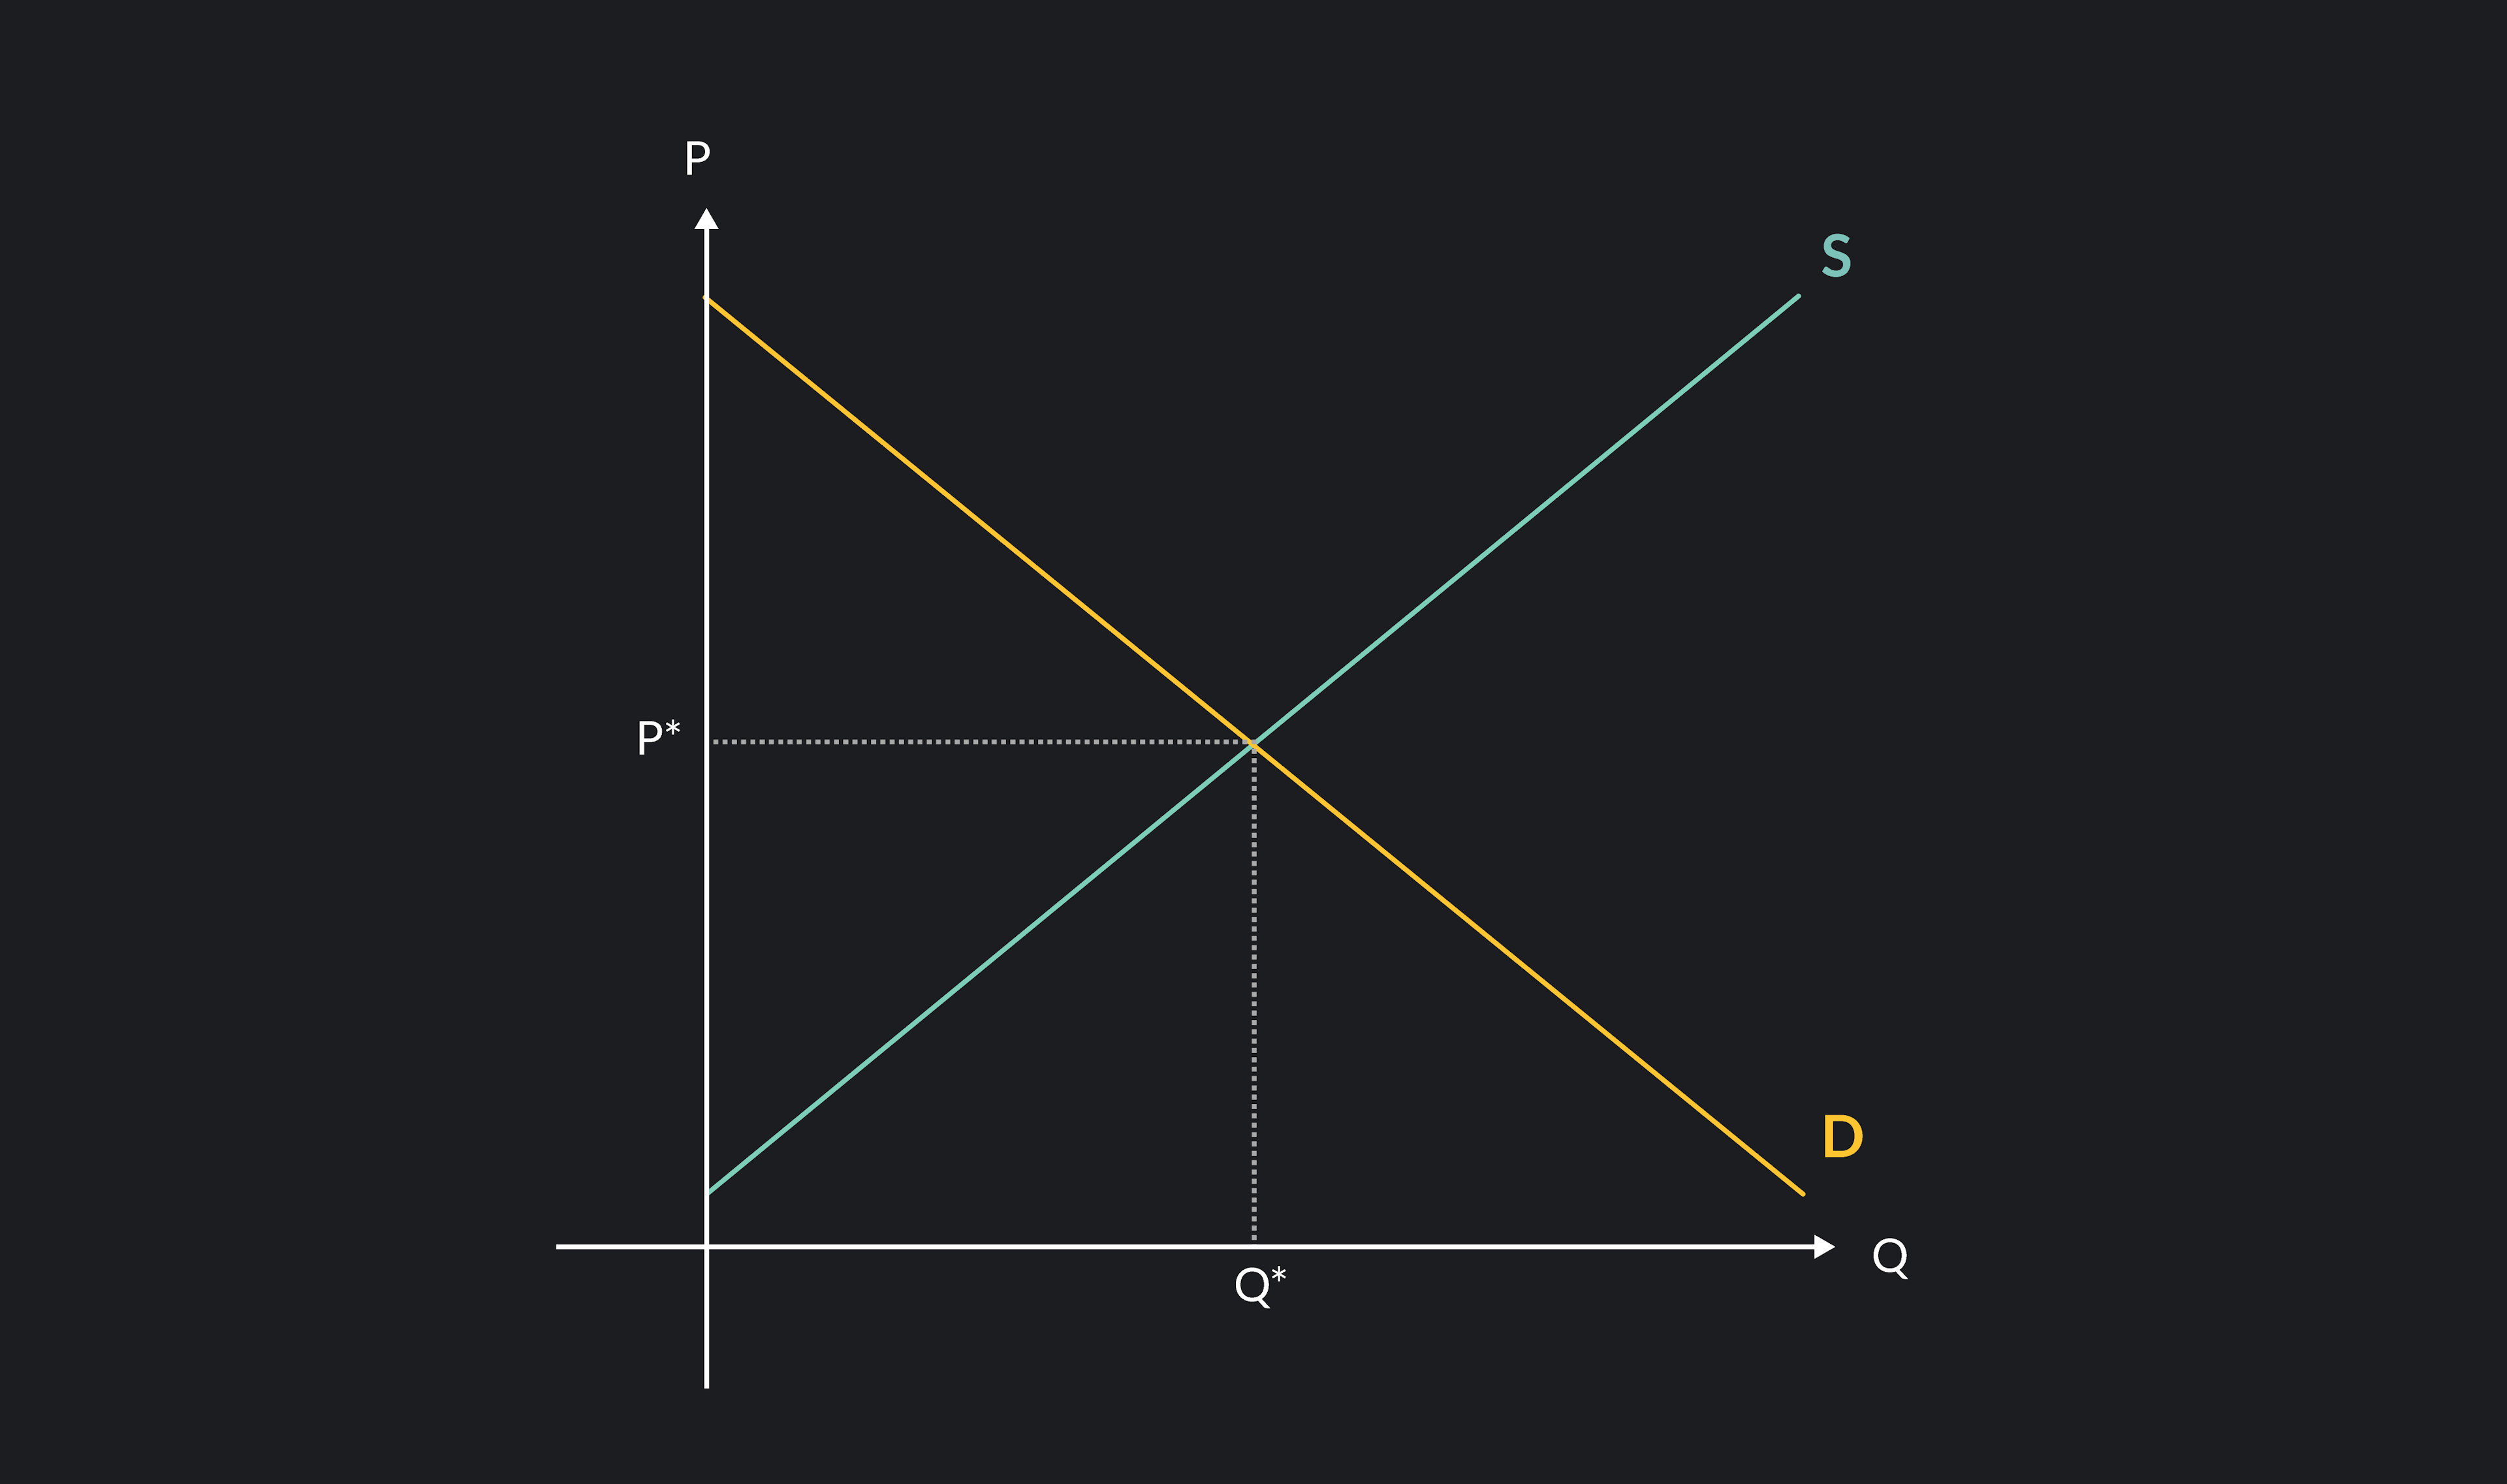
Putting these two laws together, we get the supply and demand curve. The point at which supply and demand intersect is called market equilibrium (p*). The word equilibrium means "balance" so like on the graph below, p* is the point where there is an equal balance of buyers and sellers. A change in either the supply or demand will change that equal balance and thus the equilibrium price will change. In this article, we review how a shift in the demand curve changes the equilibrium price to either rise or fall.
Difference Between a Movement Along the Demand Curve and a Shift
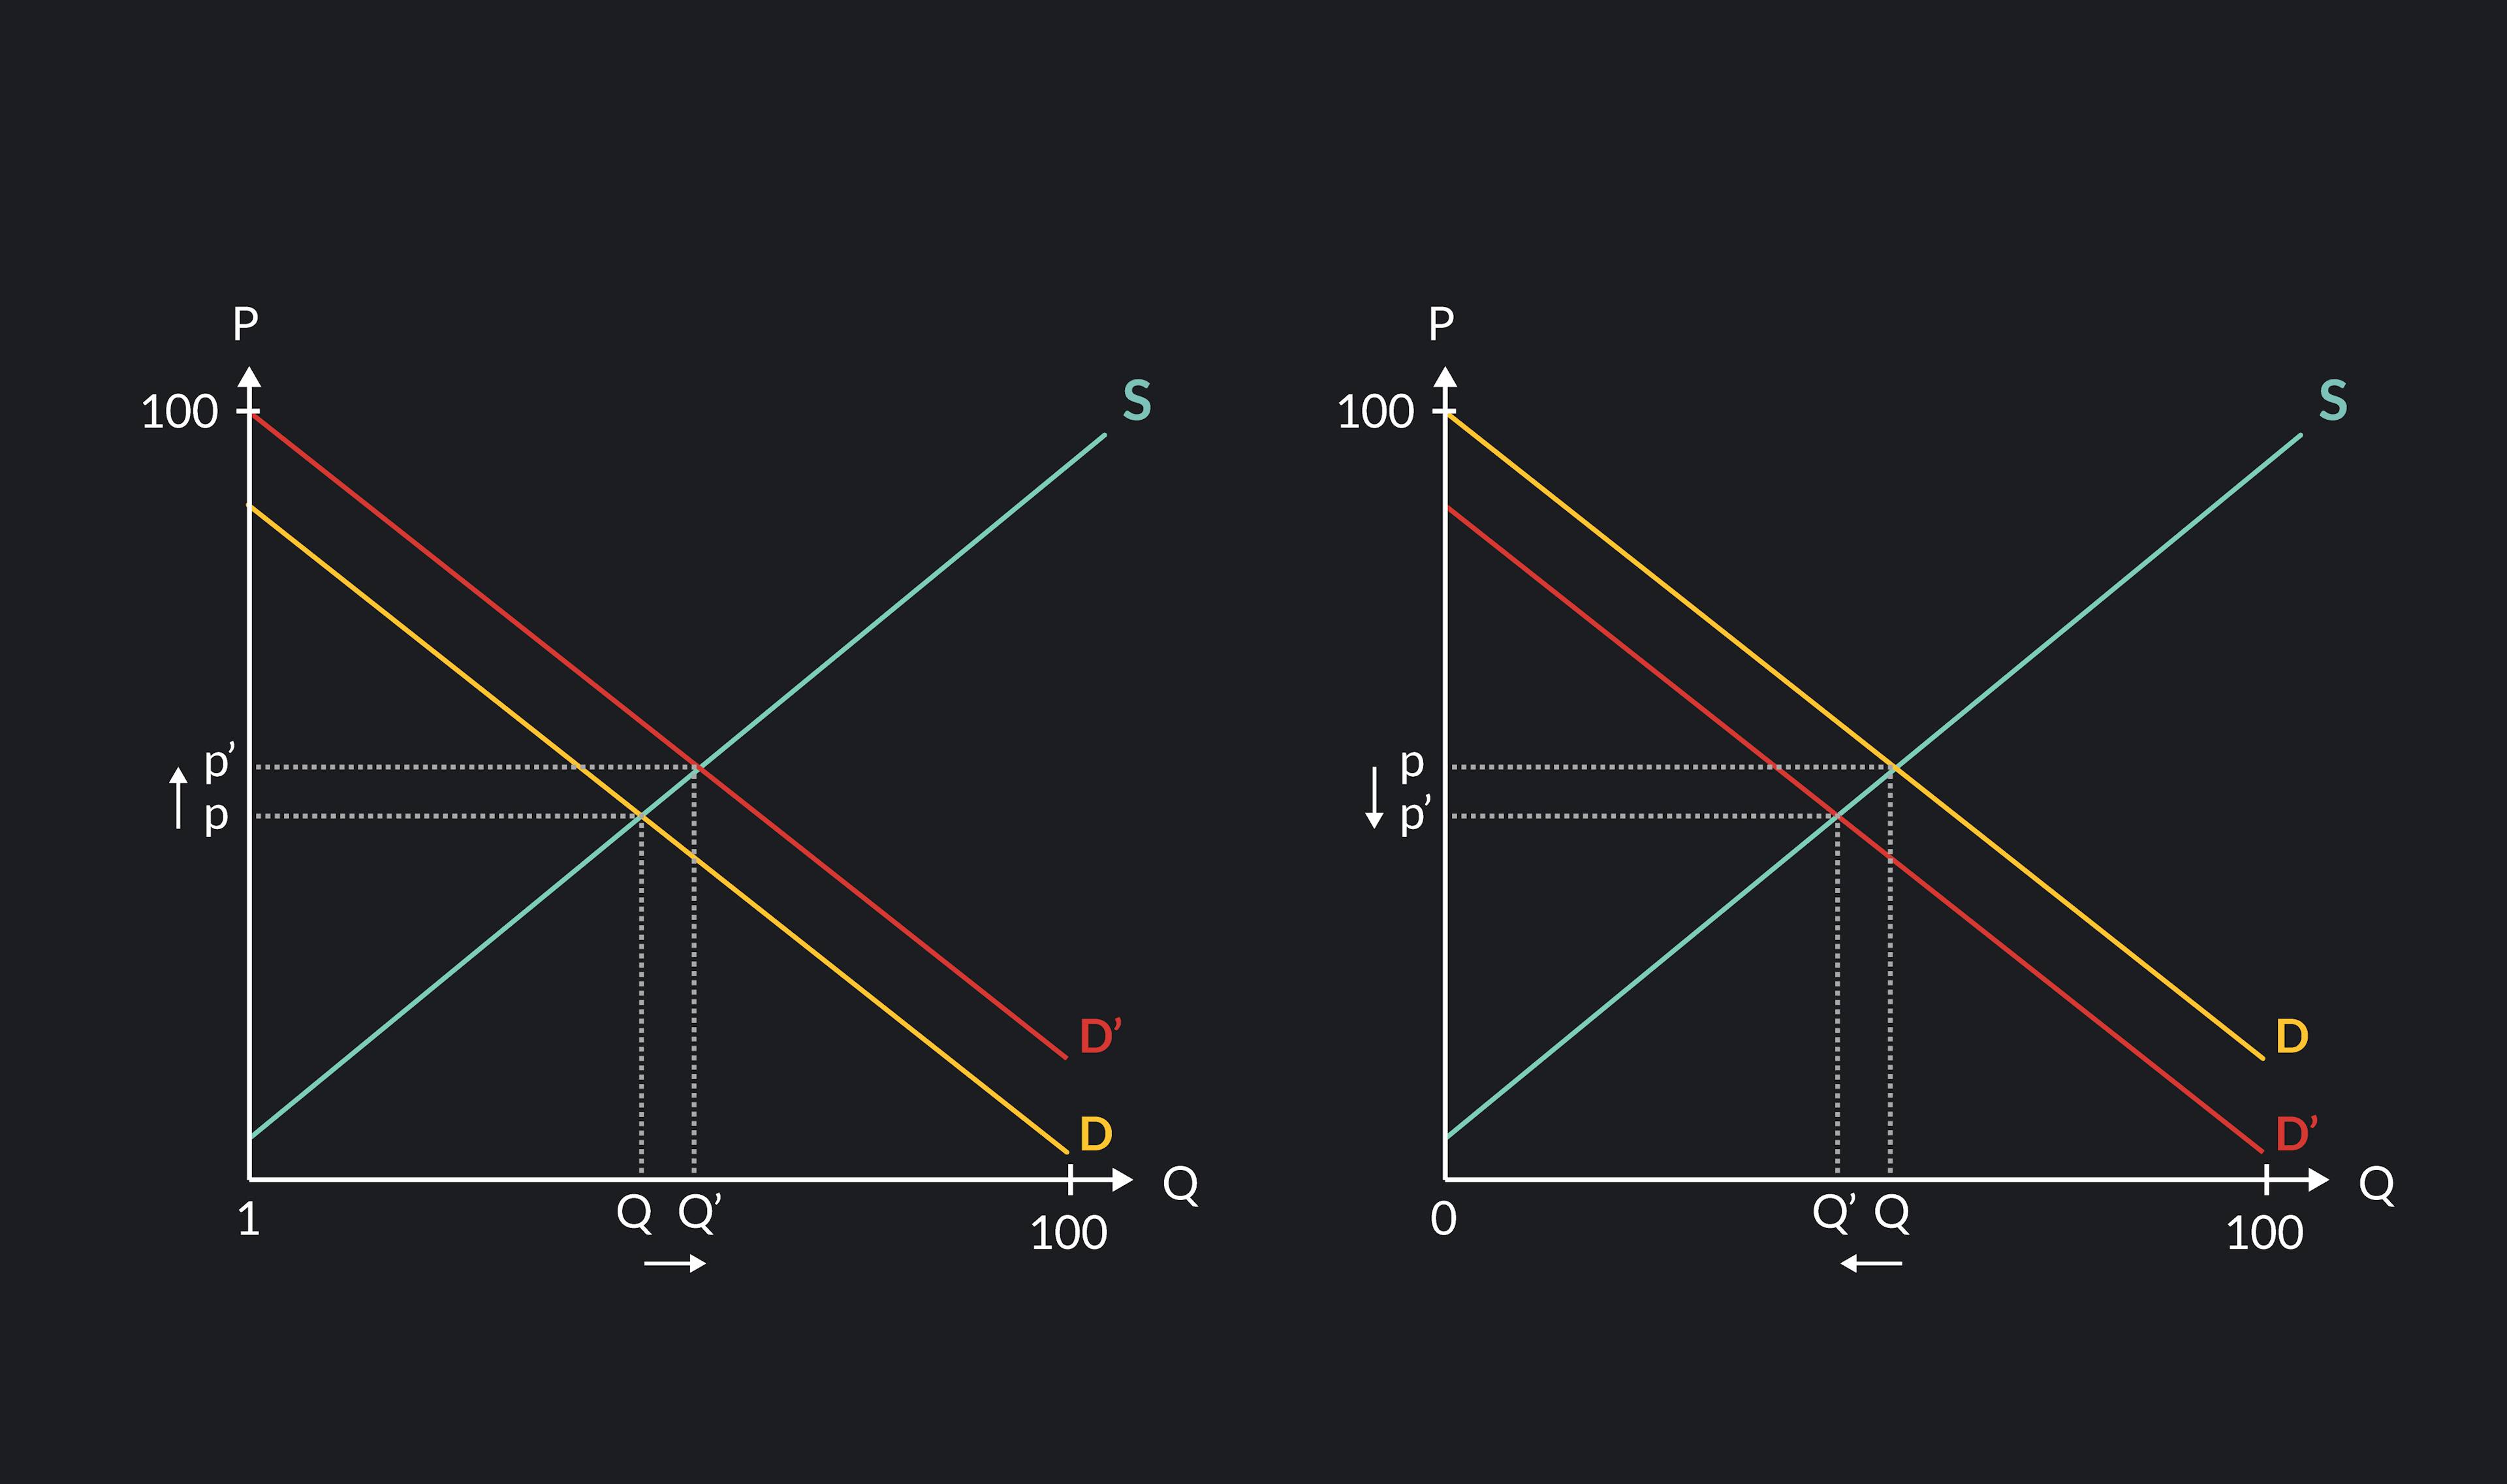
A change in the price of a good causes movement along the demand curve. Whereas factors beyond a price change cause a shift in the demand curve. In other words, the demand curve shifts when P is held constant. A shift causes the quantity of demand to either increase (a shift to the right) or decrease (a shift to the left) even though P does not change.
Example of Movement vs. Shift
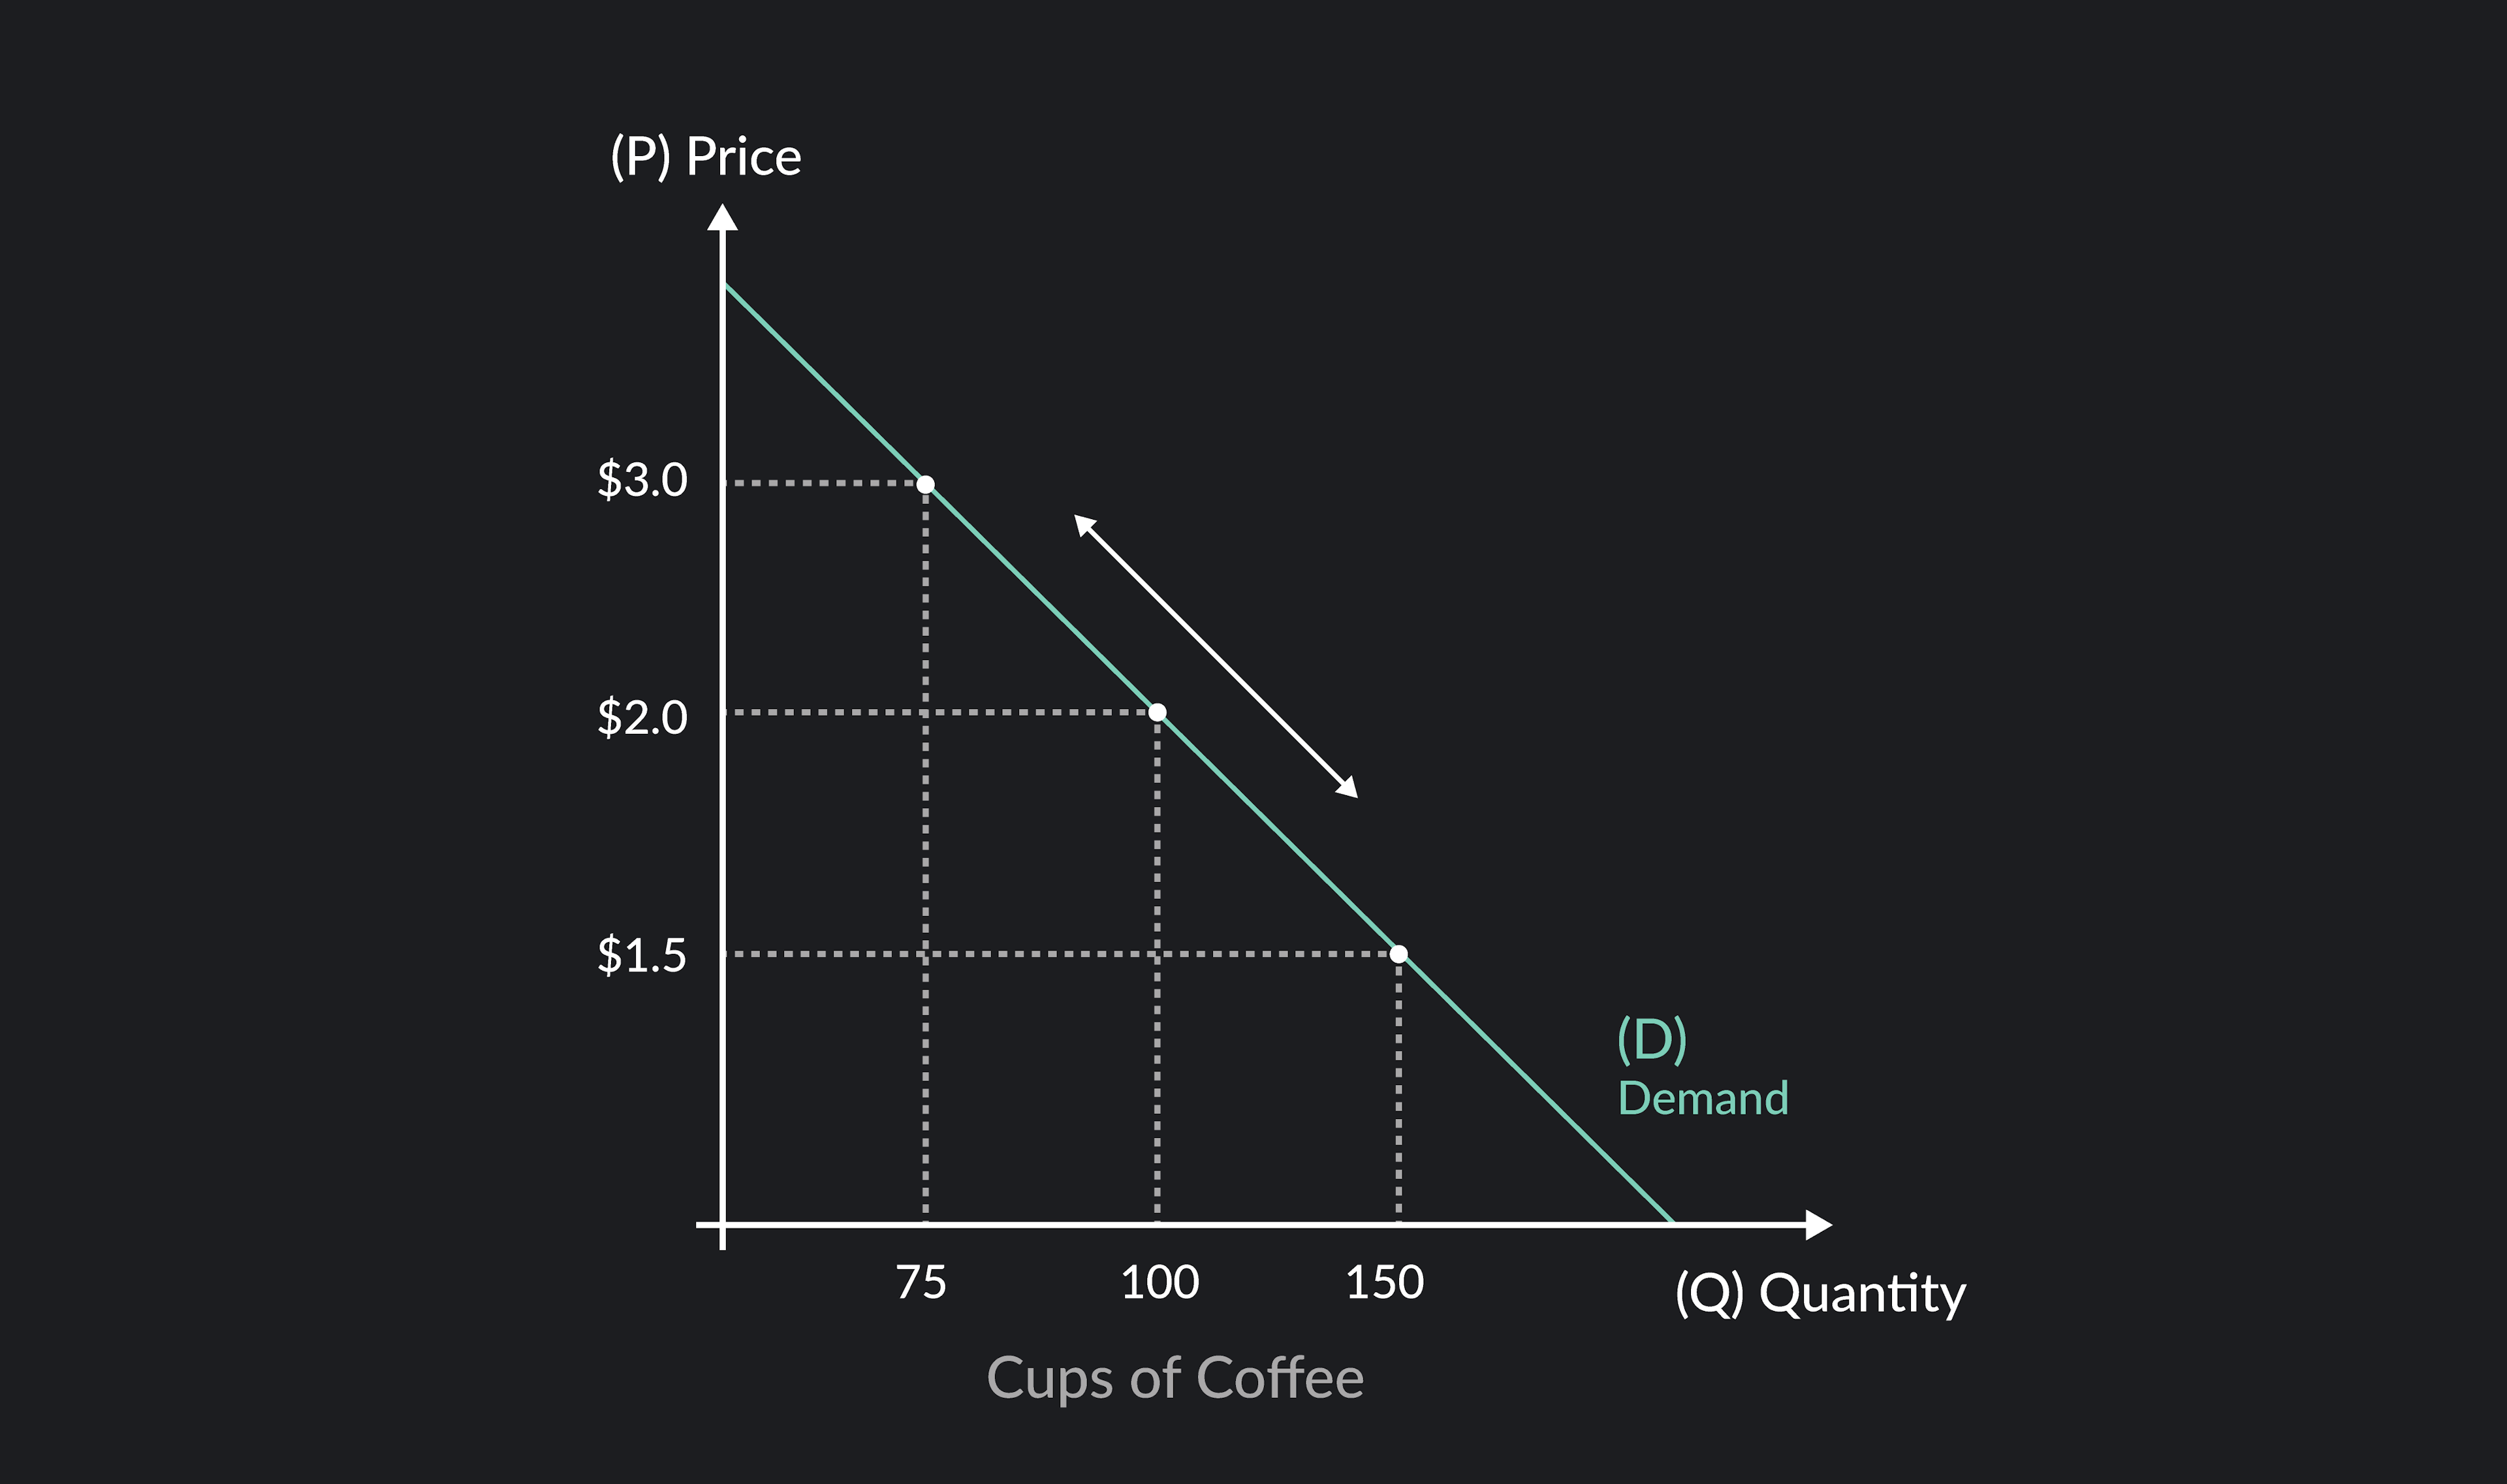
First, let’s use a coffee shop to illustrate how changing the price for a cup of coffee will cause a movement along the demand curve. We will see how external factors — outside the coffee shop’s discretion — will cause a shift in the demand curve.
In the graph below, we see that when a cup of coffee is $2.00, the quantity demanded is 100 cups of coffee. If the price increases to $3.00, there is an upward movement along the curve and the quantity of demand decreases to 75 cups of coffee. When the price drops to $1.50, there is a downward movement, and the quantity demanded then increases to 125 cups of coffee. The change in quantity demanded (Q) is a direct outcome from the change in P which is reflected in the movement along the demand curve.
However, a shift in the demand curve happens when the price of coffee stays the same, and yet the quantity of demand changes. For example, if the price of coffee is still $2.00 but there is a change in the quantity of demand for coffee at the shop, that would be a shift in the demand curve. So what can cause this shift?
5 Phenomenons That Cause a Shift in the Demand Curve
So what shifts the demand curve? Keep in mind that the demand curve can either shift right or left. When there is a shift to the right, this shows an increase in demand at every price point. Then, when the demand curve shifts to the left, this shows a decrease in demand at each price.
1. Change in Taste and Preferences
As style and the desire to consume certain items increases or decreases, it will cause a shift in the demand curve. For example, drinks that have a lot of sugar became less desirable in recent years. That means the taste and the preference of consumers have changed.
With this change in demand, the demand curve for sugary drinks shifts to the left. If something has become more popular recently, like electric vehicles, then that increase in preference will cause a shift to the right.
2. Population Increase or Decrease
The size of the current population directly affects the quantity of demand for all goods and services at every price. When there is a growth in the population, the demand curve shifts to the right, and when the population decreases, the demand curve shifts to the left.
3. Price Change of a Related Good
In economics there are two types of related goods:
A substitute good
A complementary good
A substitute good is exactly how it sounds. It is a good bought in exchange for another product.
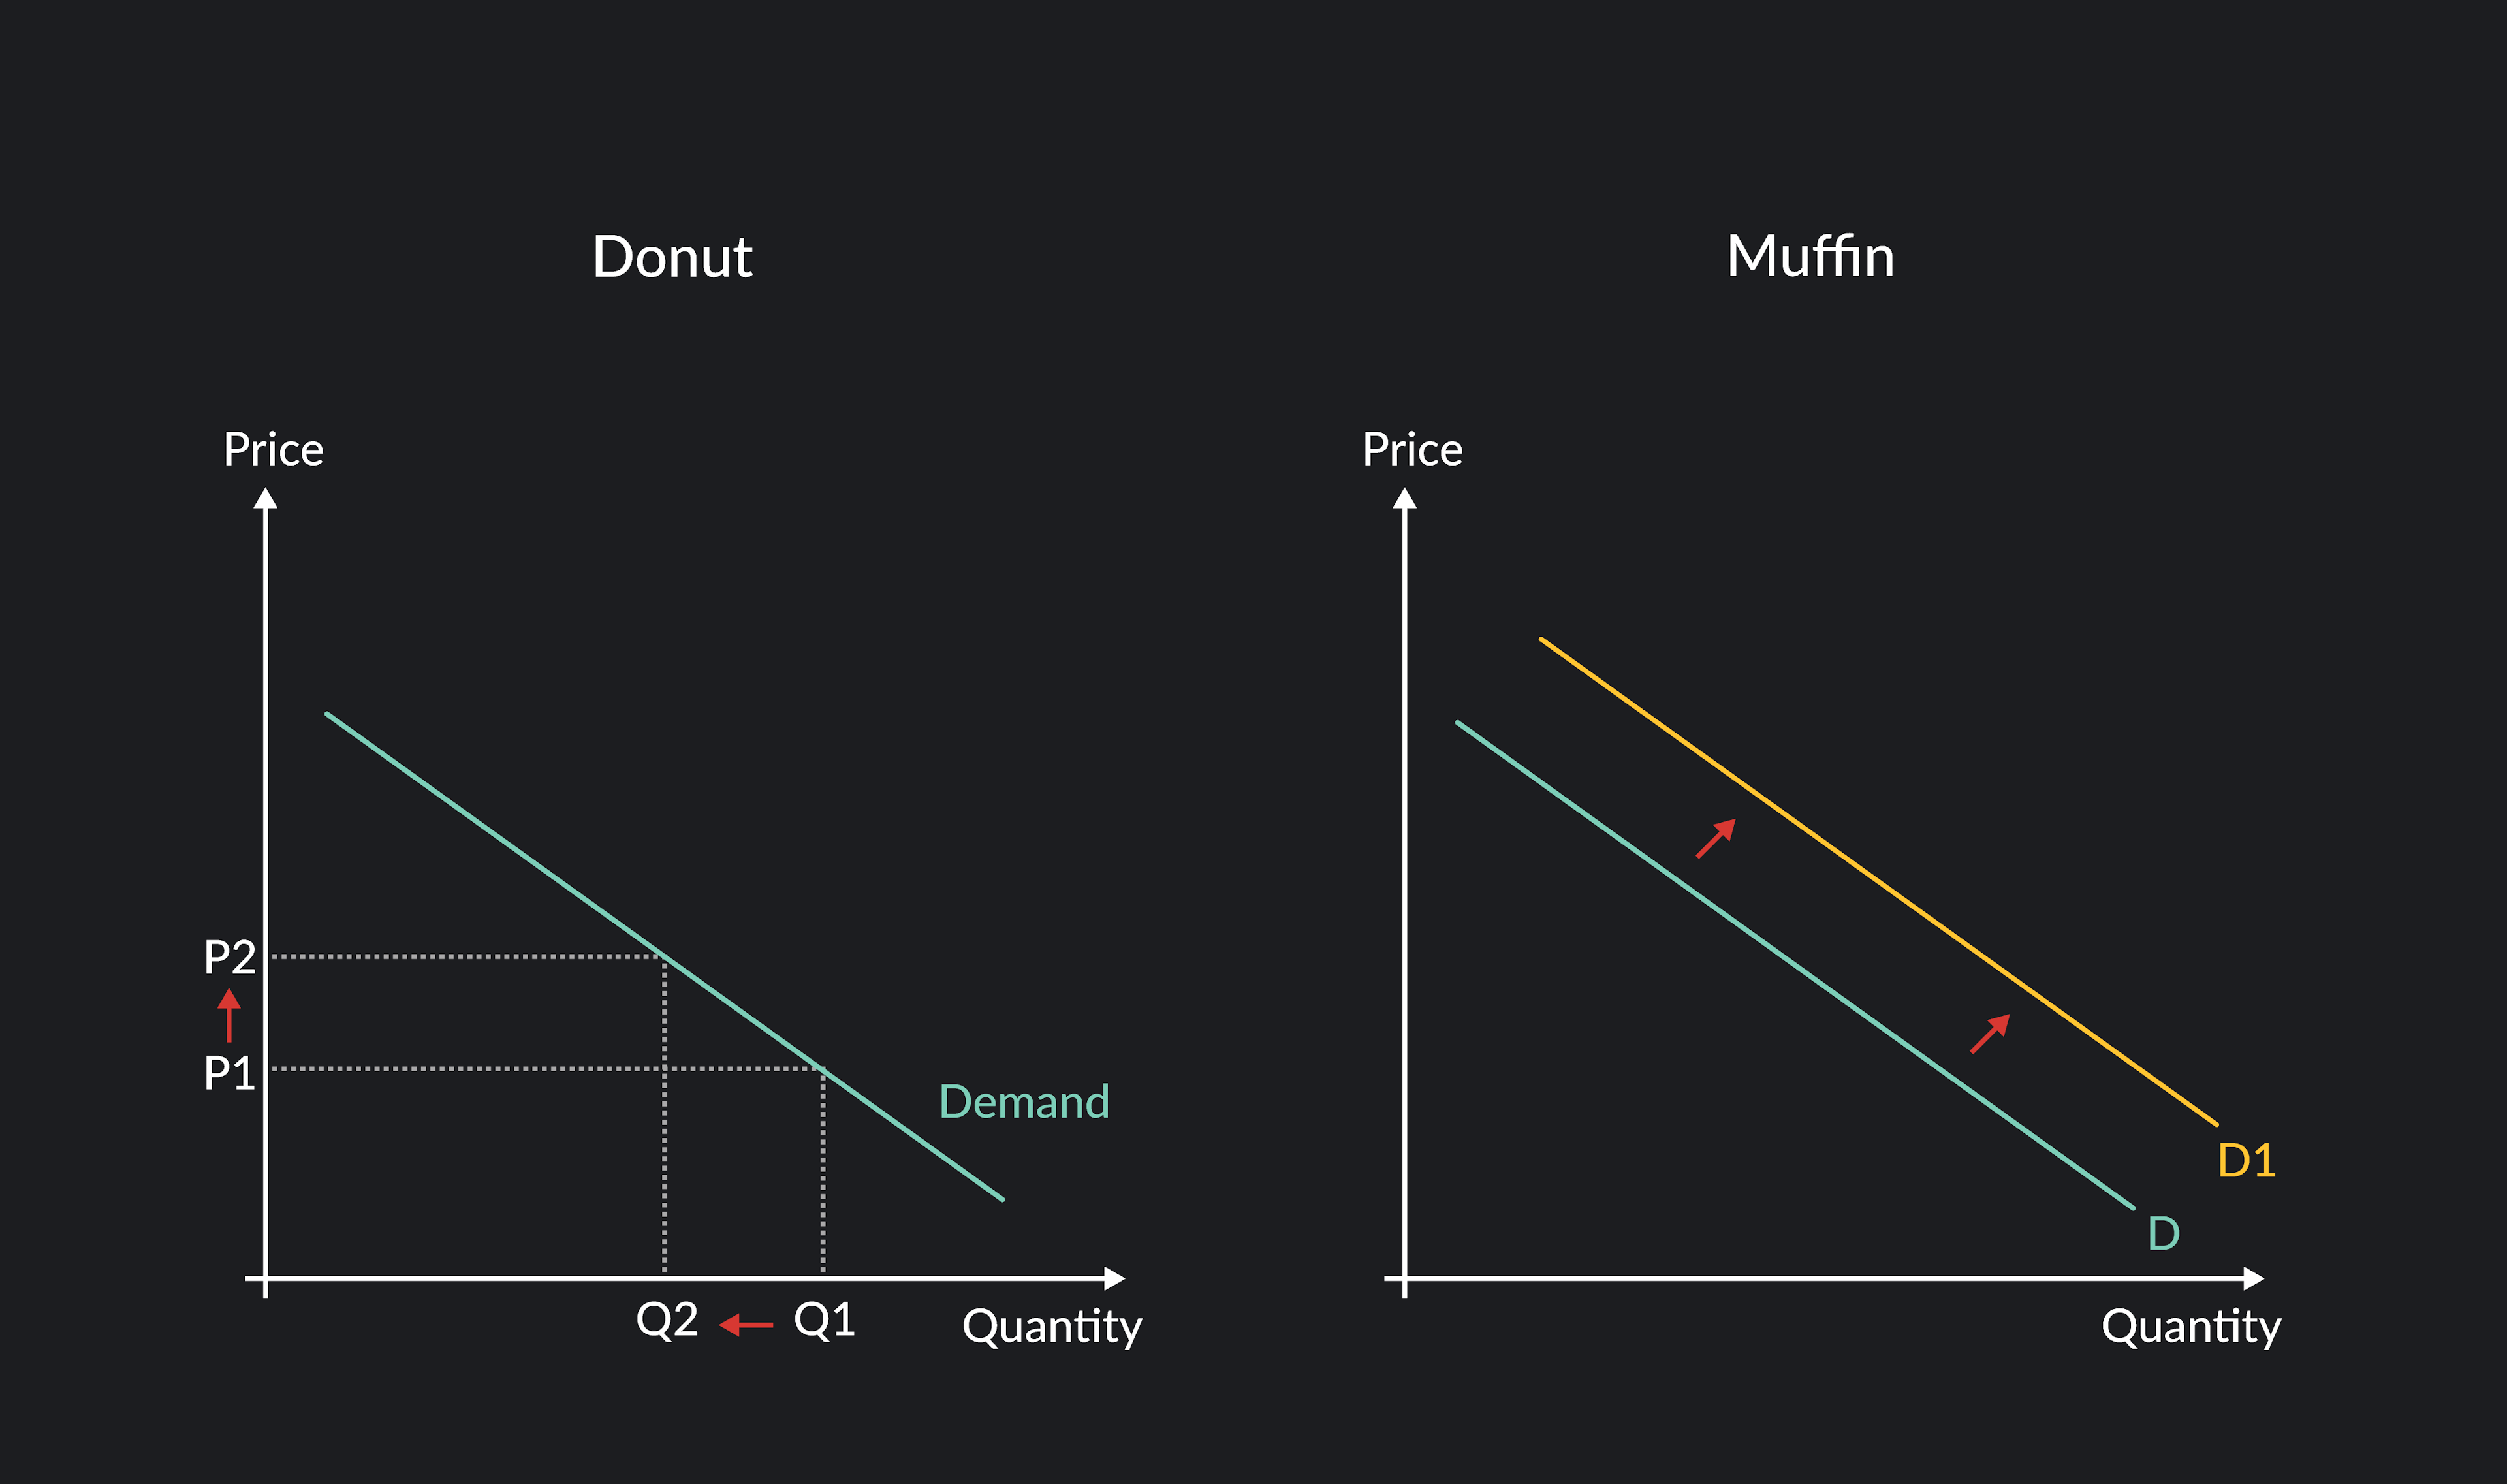
If the price of one thing goes up, they will find something more affordable to substitute for it. For example, we have one customer of our coffee shop who likes to buy a donut along with their coffee every morning. One day, they notice that the price of donuts went up, and they might buy a muffin instead. So the demand for muffins increased, although the price stayed the same. As more people move away from the expensive item (the donut) towards the cheaper item (the muffin), the demand for that cheaper item shifts to the right. Also, the quantity of demand increases at each price point.
A complementary good is a good that often goes together with the product we are buying.
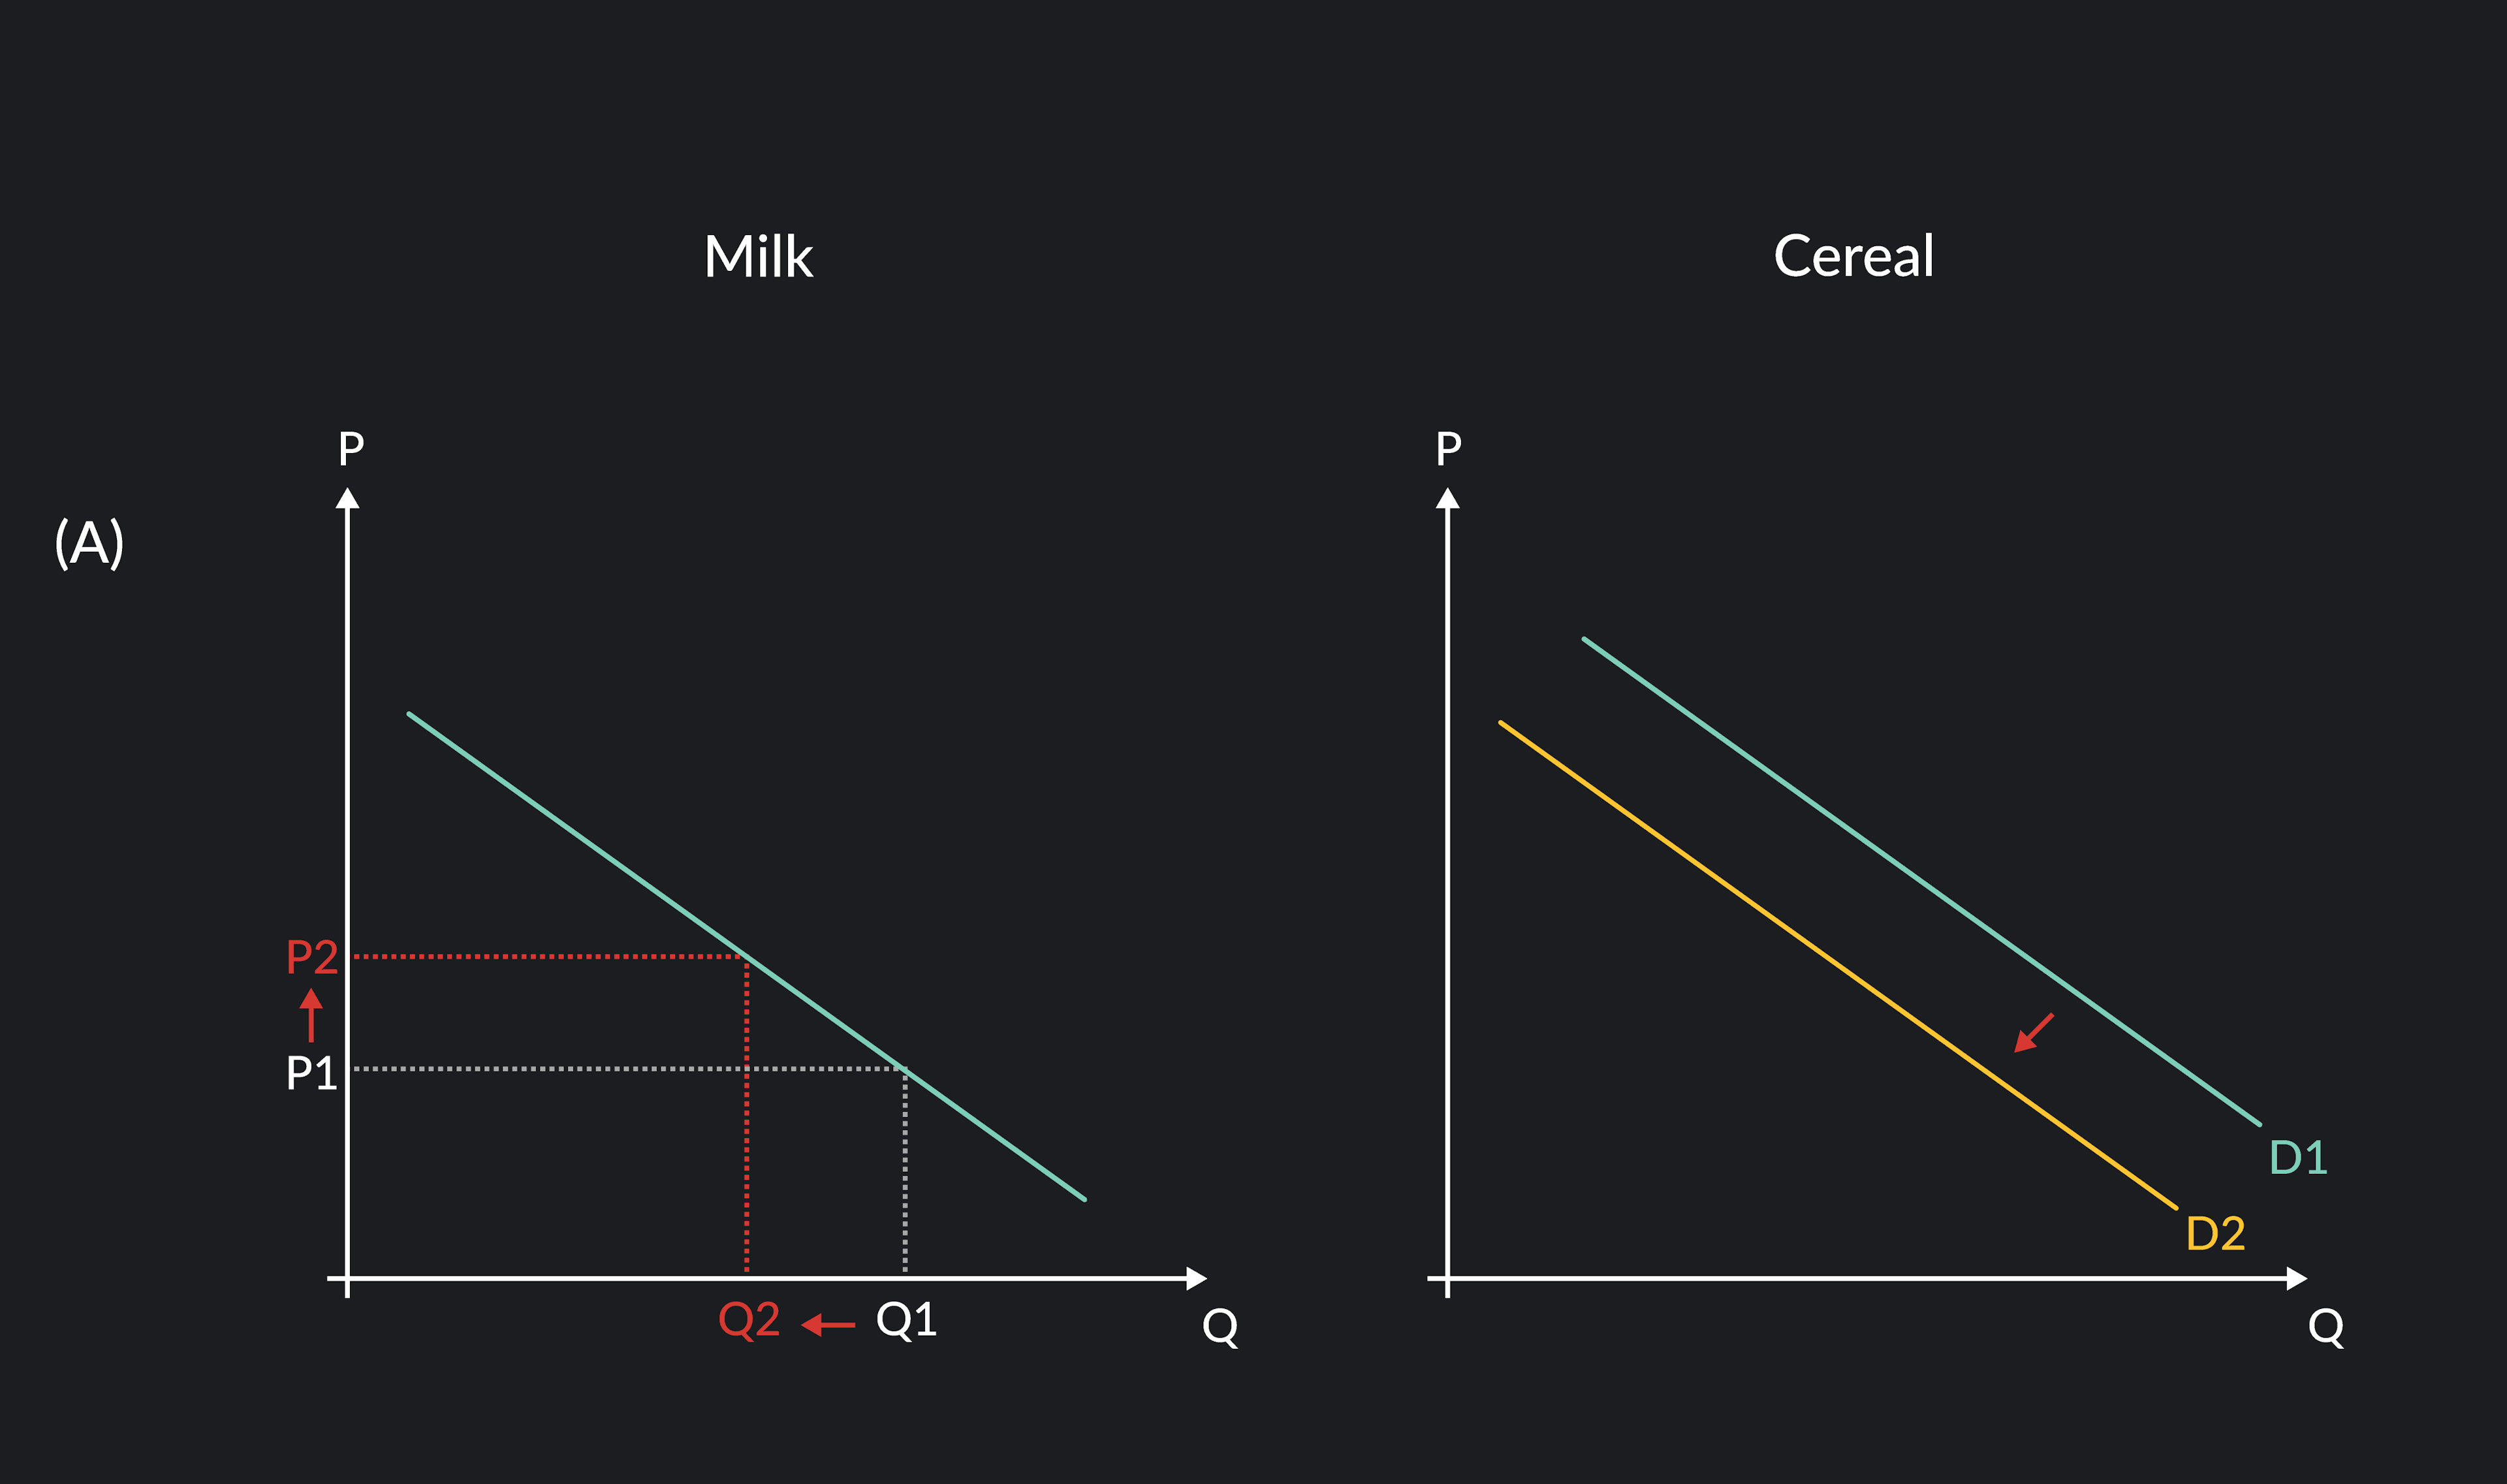
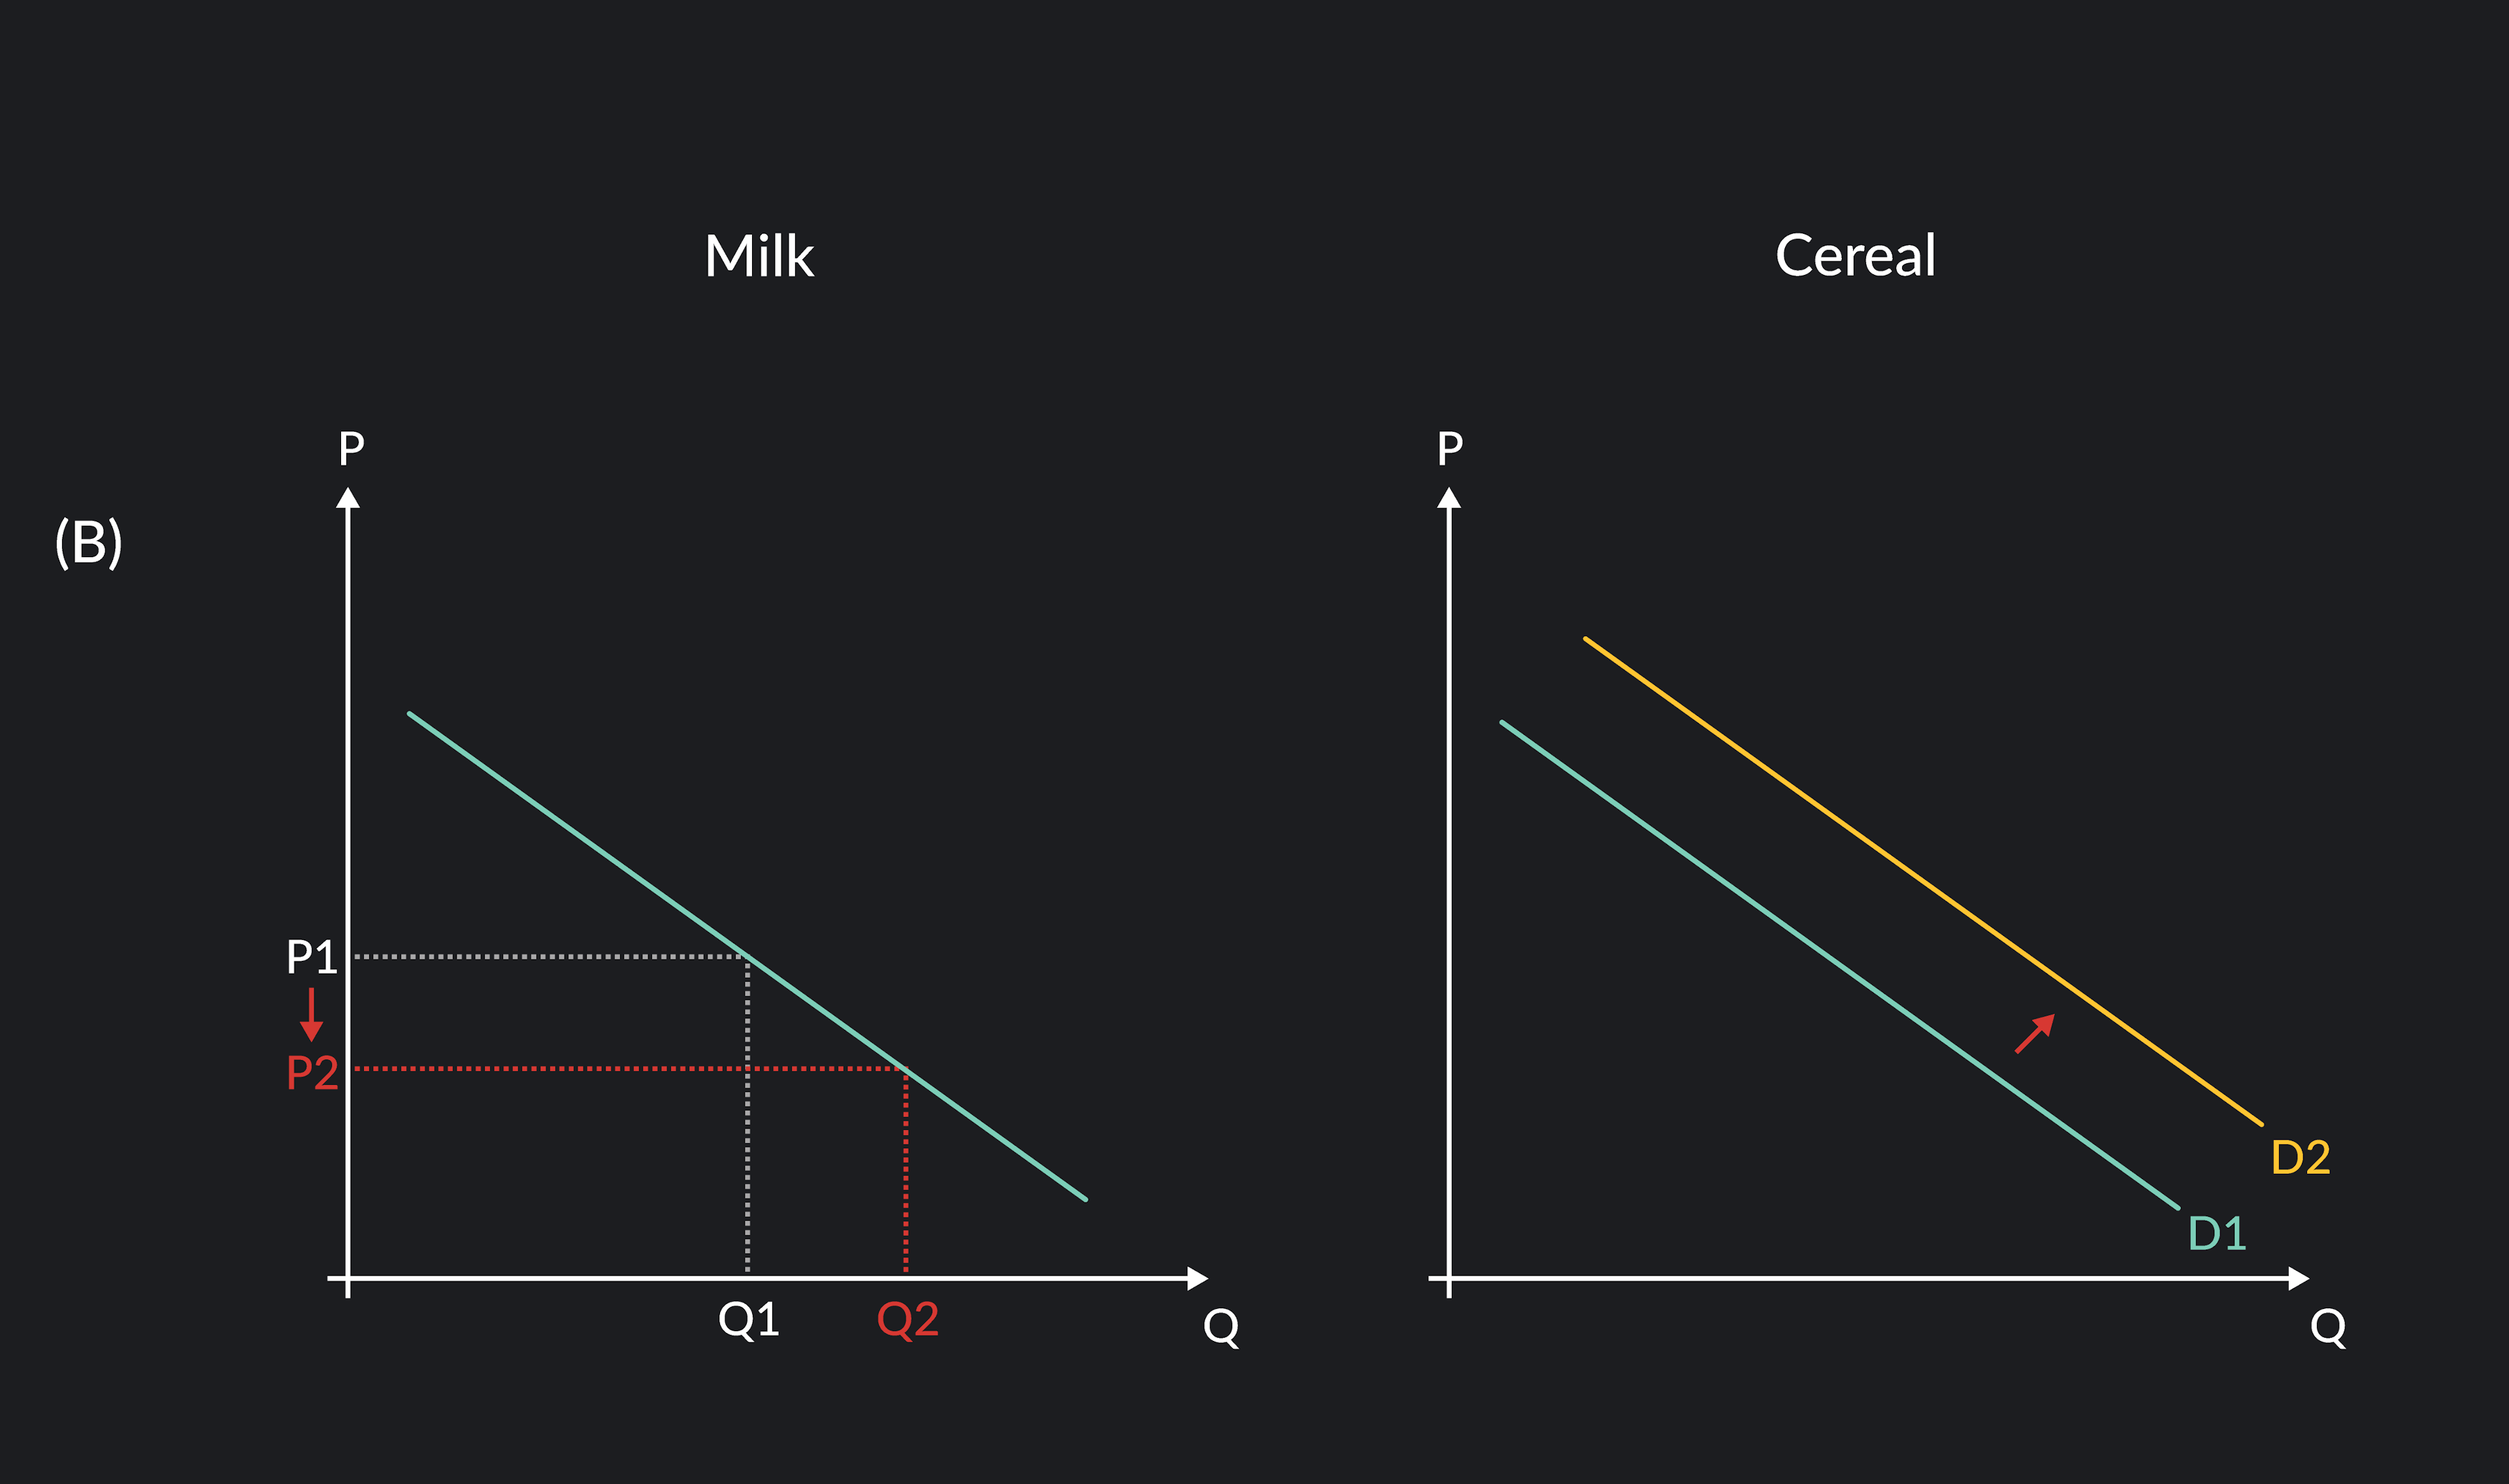
So a change in the price of a complementary good also causes a shift in our demand curve. For example, if there is a steep rise in the price of milk, people will stop buying cereal for breakfast since milk is a complementary good for cereal and is now relatively expensive.
4. Change in the Expected Future Prices
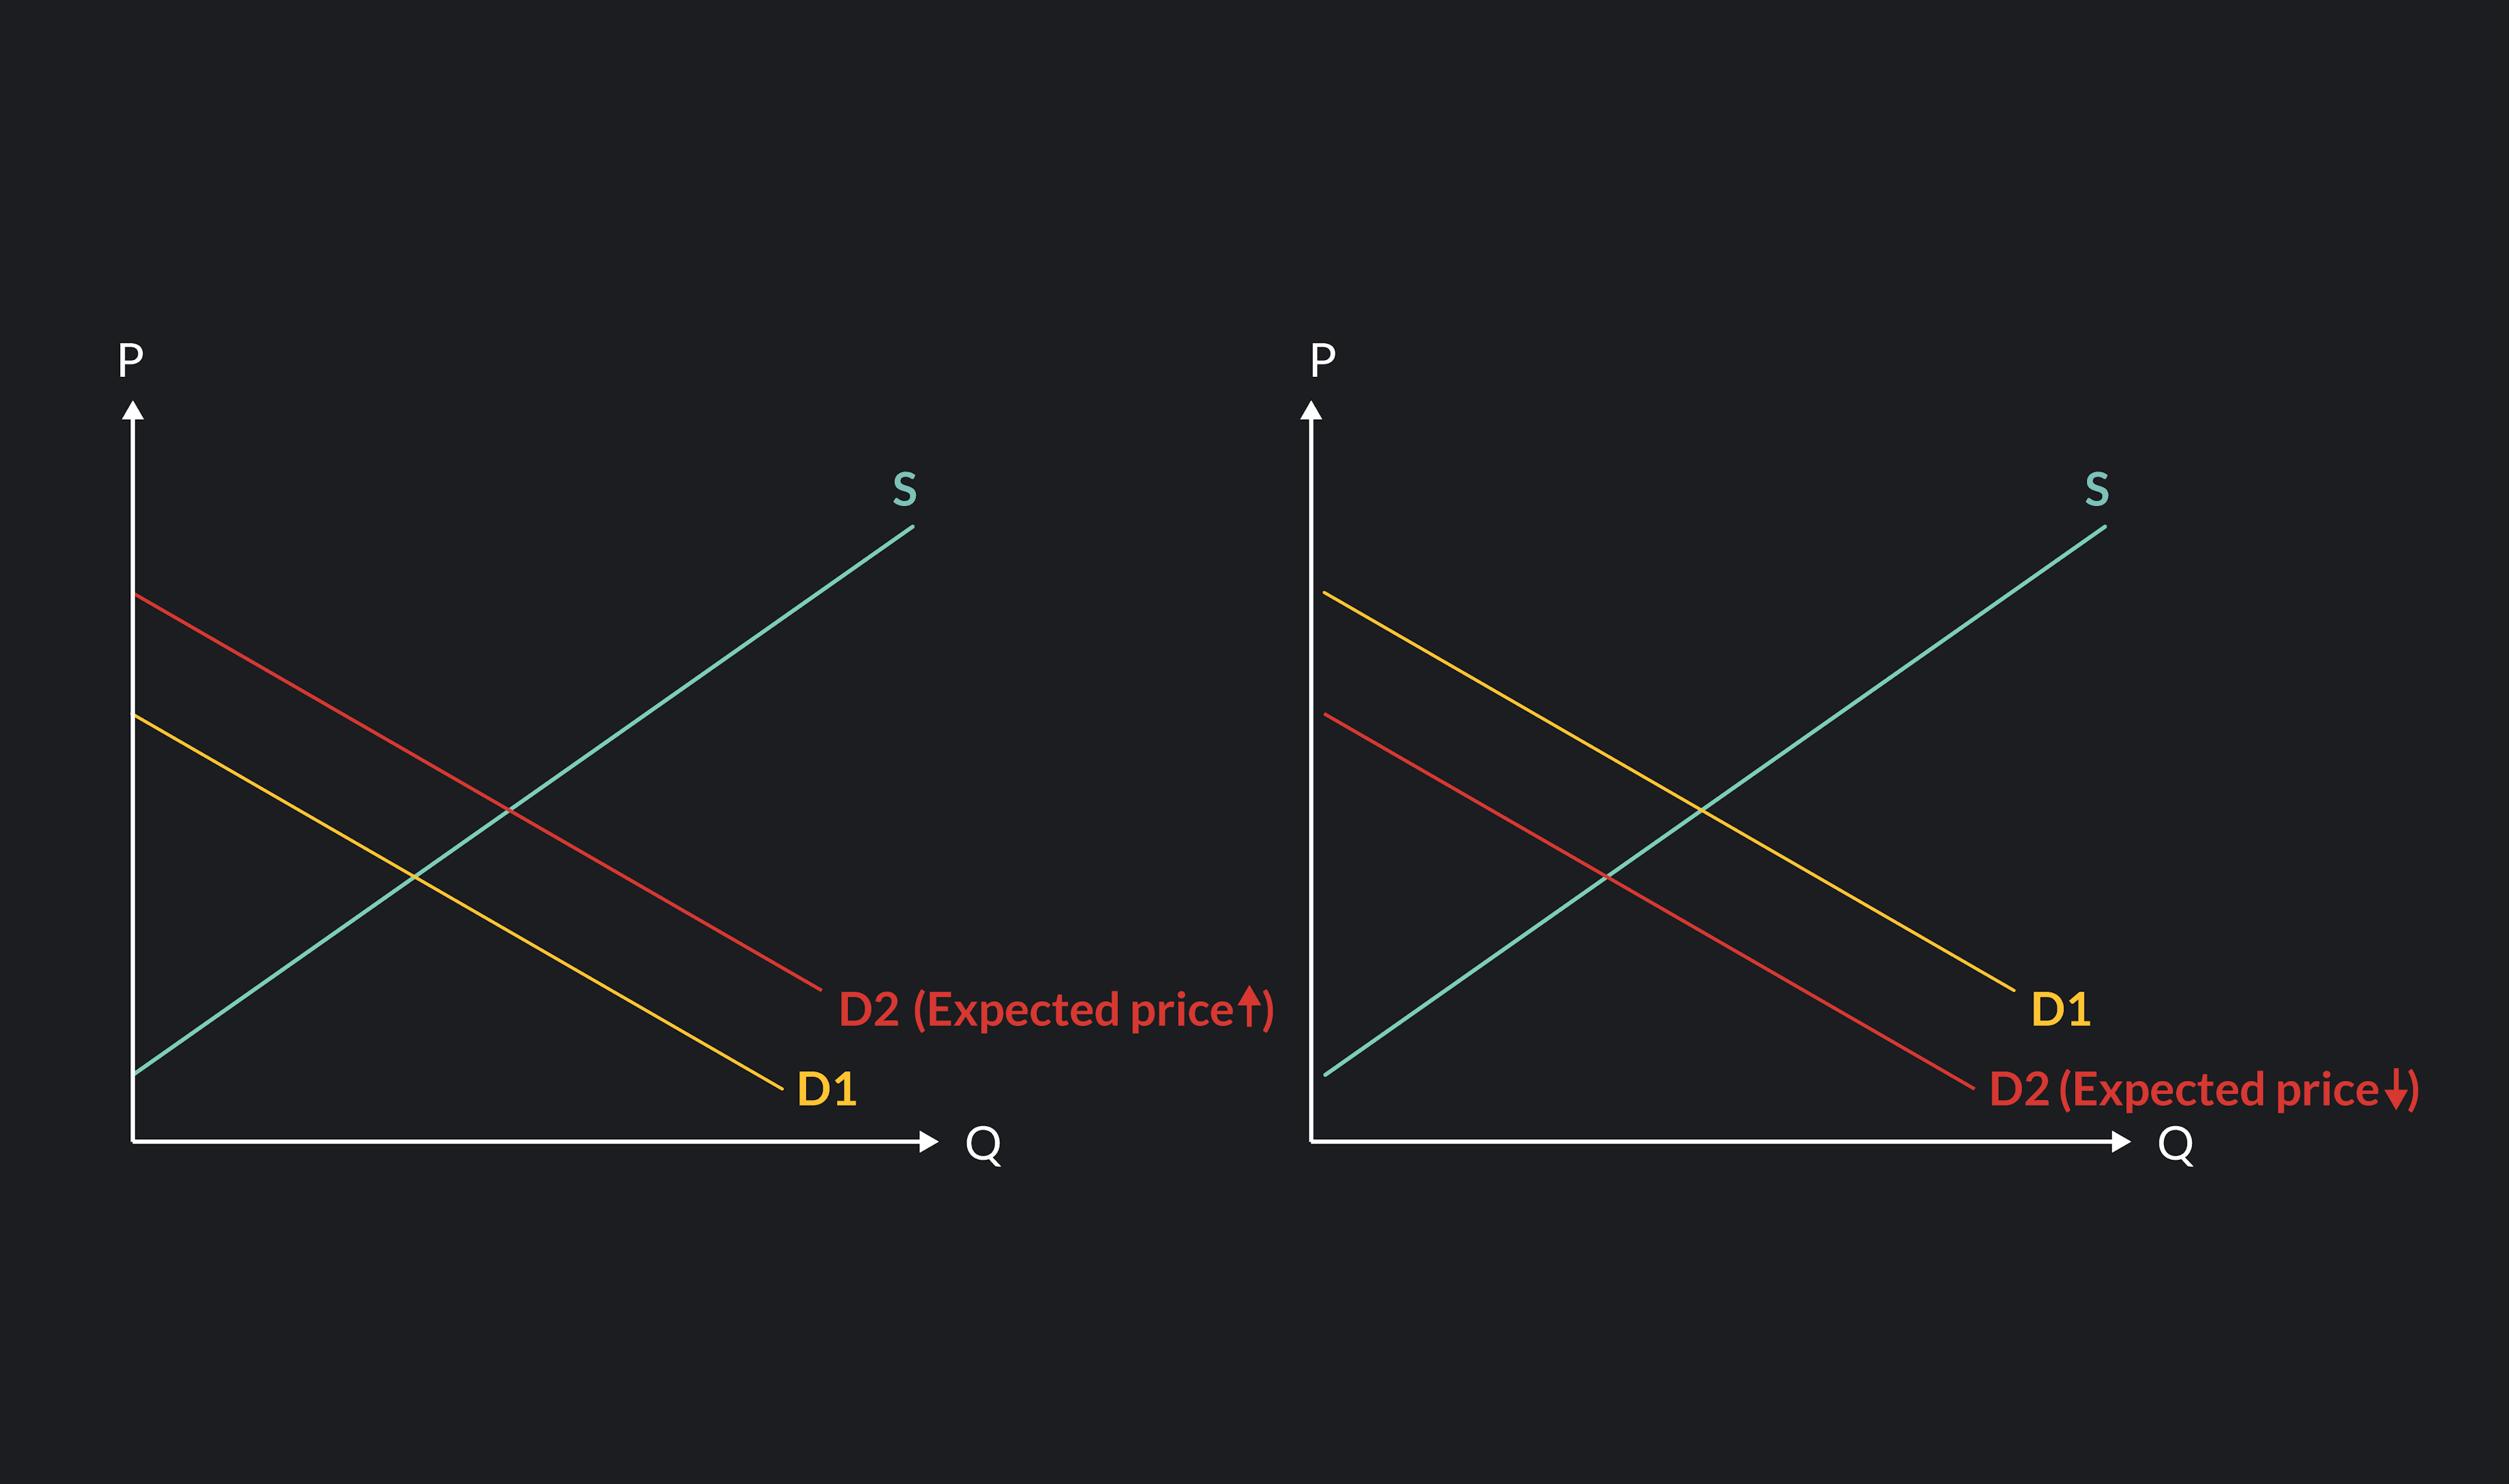
If people expect that the price of something will rise in the future, they will buy more of it today instead of at a later time when it is more expensive. This expectation of higher prices in the future causes the demand curve to shift to the right — i.e., there is more demand at each price today.
Let’s use French wine as our example and assume some law will soon go into effect that will make it more difficult to import French wine. If it will be more difficult to import wine, there will be less supply of wine and the price of wine will go up. In anticipation of this shortage of French wine, many wine store owners will buy extra wine today before the law goes into effect. This aggregate foresight then shifts the demand curve to the right, and there is an increase in demand at each price point.
The opposite would happen if people anticipate the price of something will go down in the future. Instead of buying today, they will wait for the price to go down. If many people are waiting for the price to fall, then there are fewer buyers today and the demand curve shifts to the left since there is less quantity of demand at every price.
(You can also dive further into how price plays a role in economics by reading about price floors and price elasticity of demand).
5. Change in the Income Level of Buyers
If someone's income goes up, that means they have more money to spend on buying goods or services they need or simply enjoy. So if the income level of many people goes up at the same time, there will be a lot more money people will spend and the demand curve will shift to the right.
Think about what would happen if your salary increased, while the price of goods you enjoy — like ice cream — remains the same. Chances are you will buy more of that good — ice cream — now that you have more money to spend. To sum up, if the income level of a population increases, the demand curve will shift to the right, since there is more quantity of demand at every price point.
The opposite will happen if the income level drops. Now there will be less money to spend, and the demand curve will shift to the left.
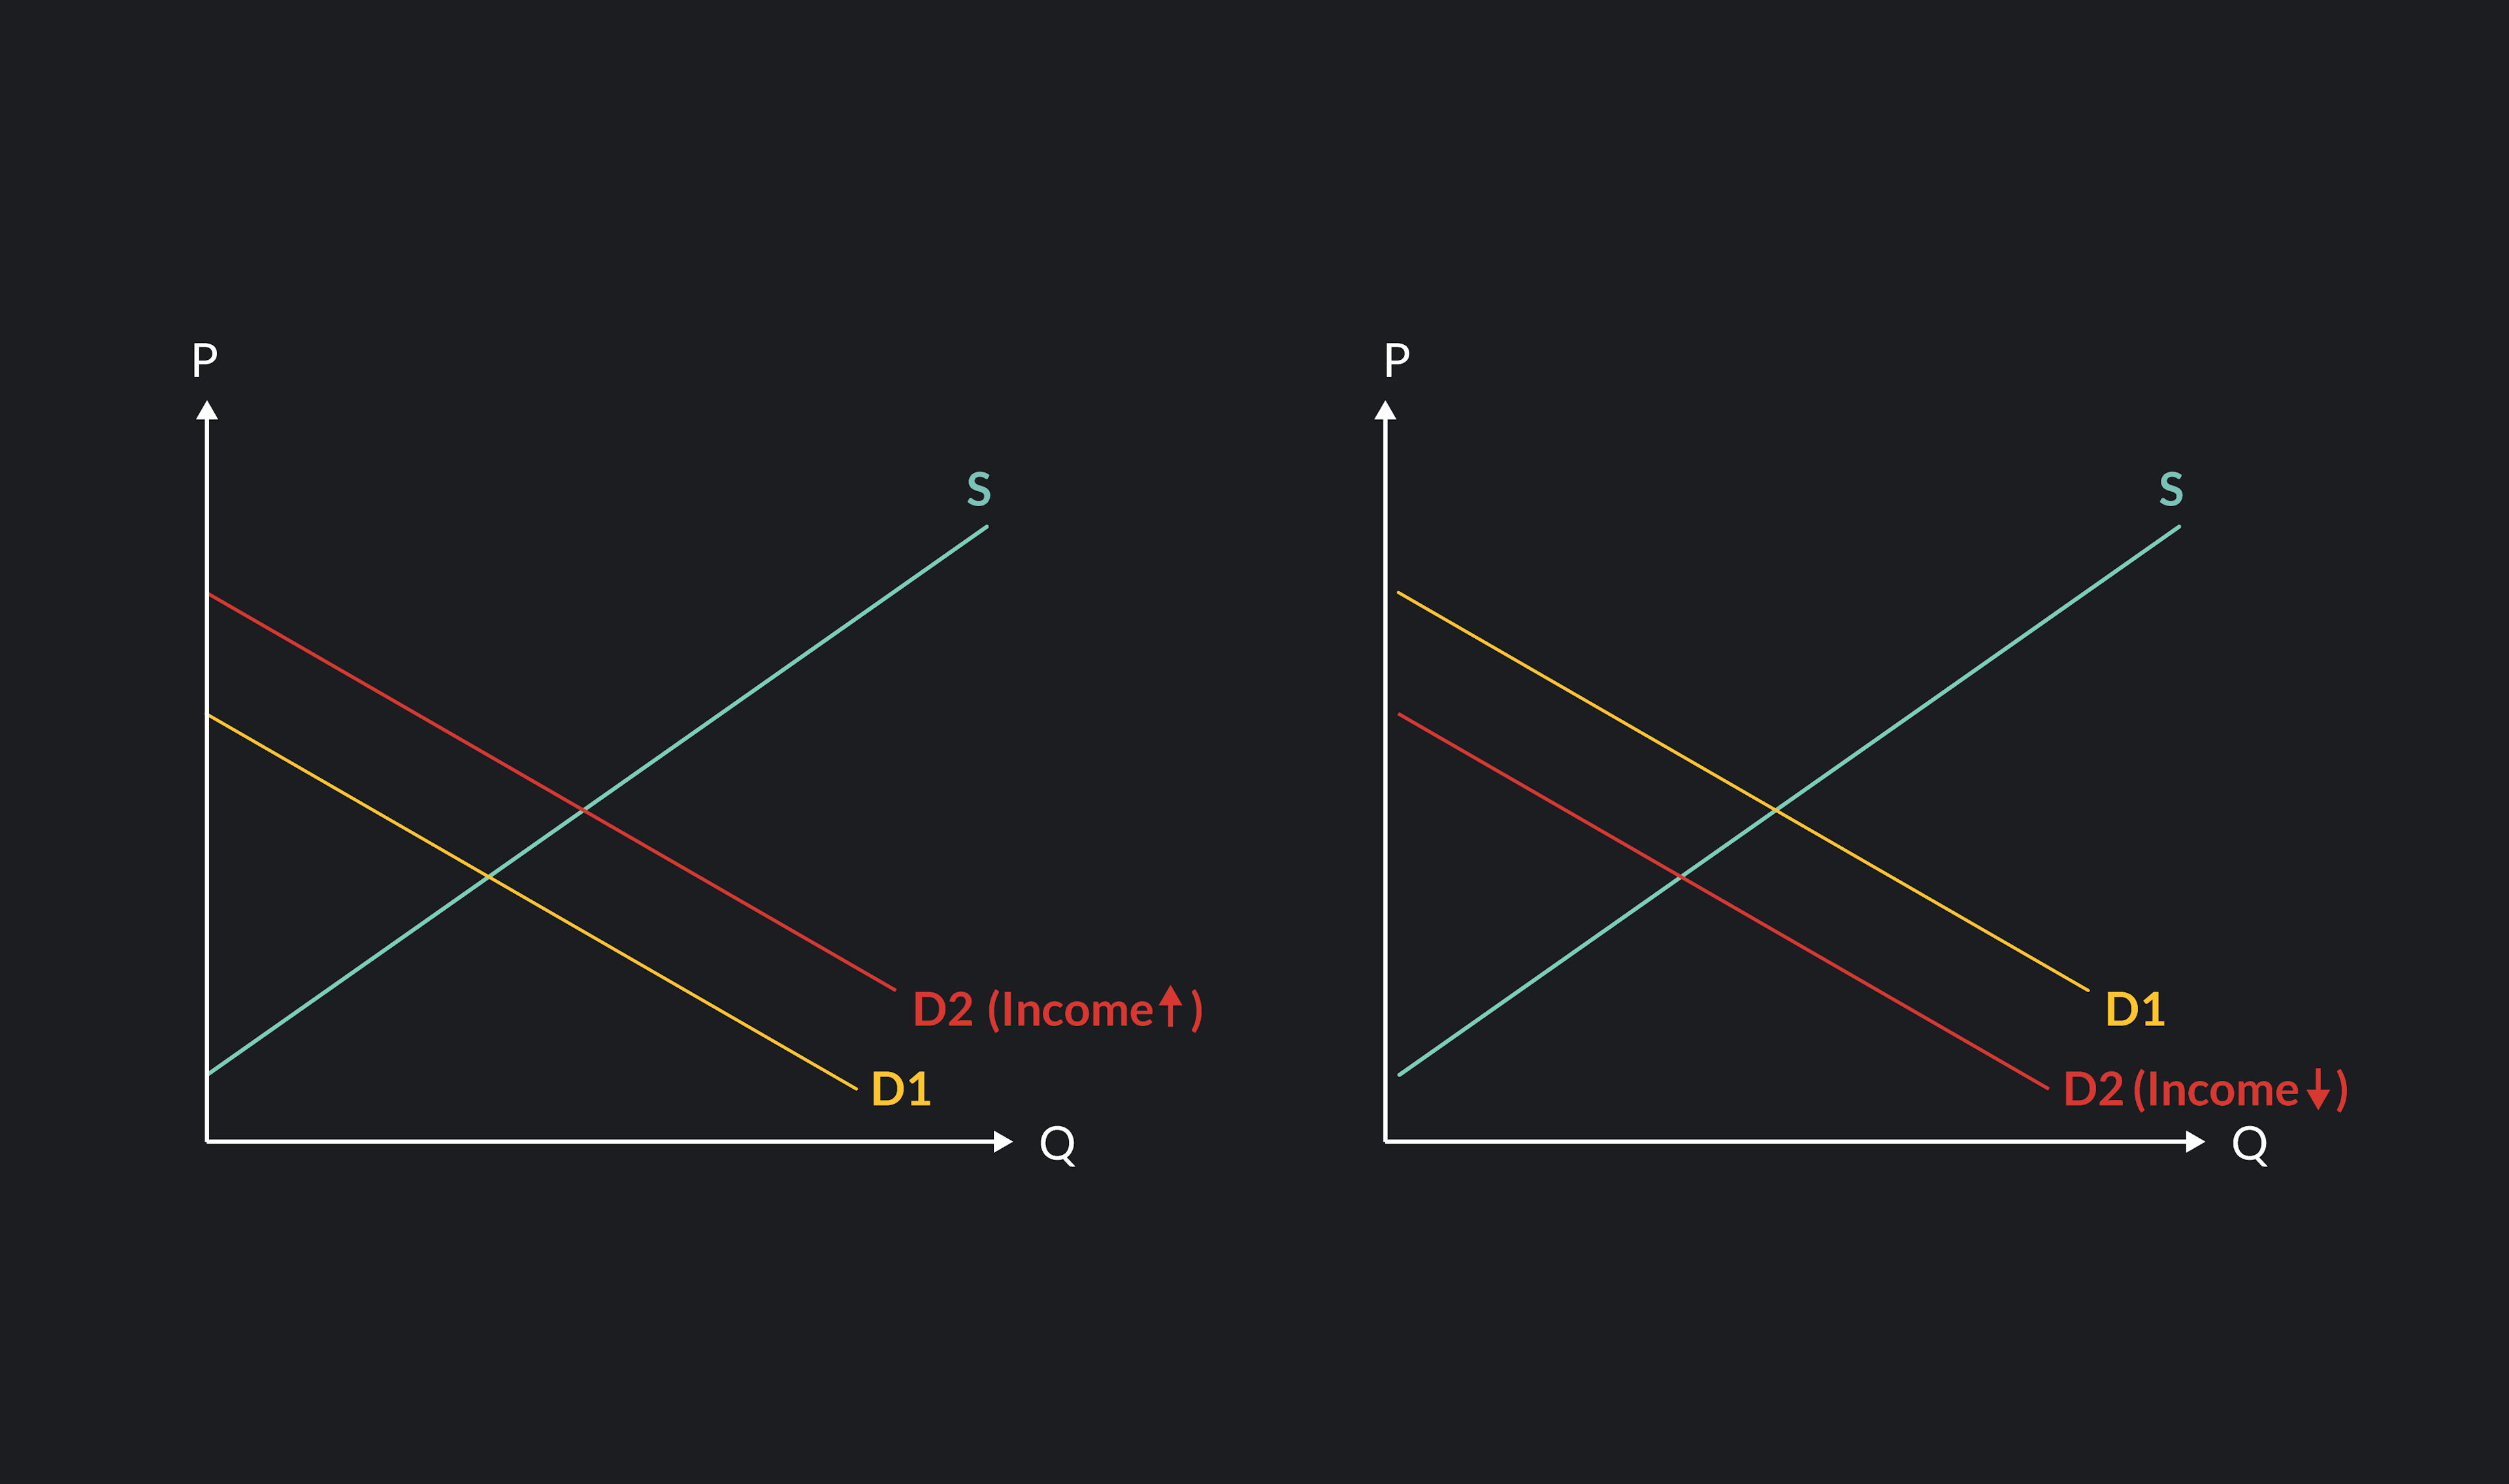
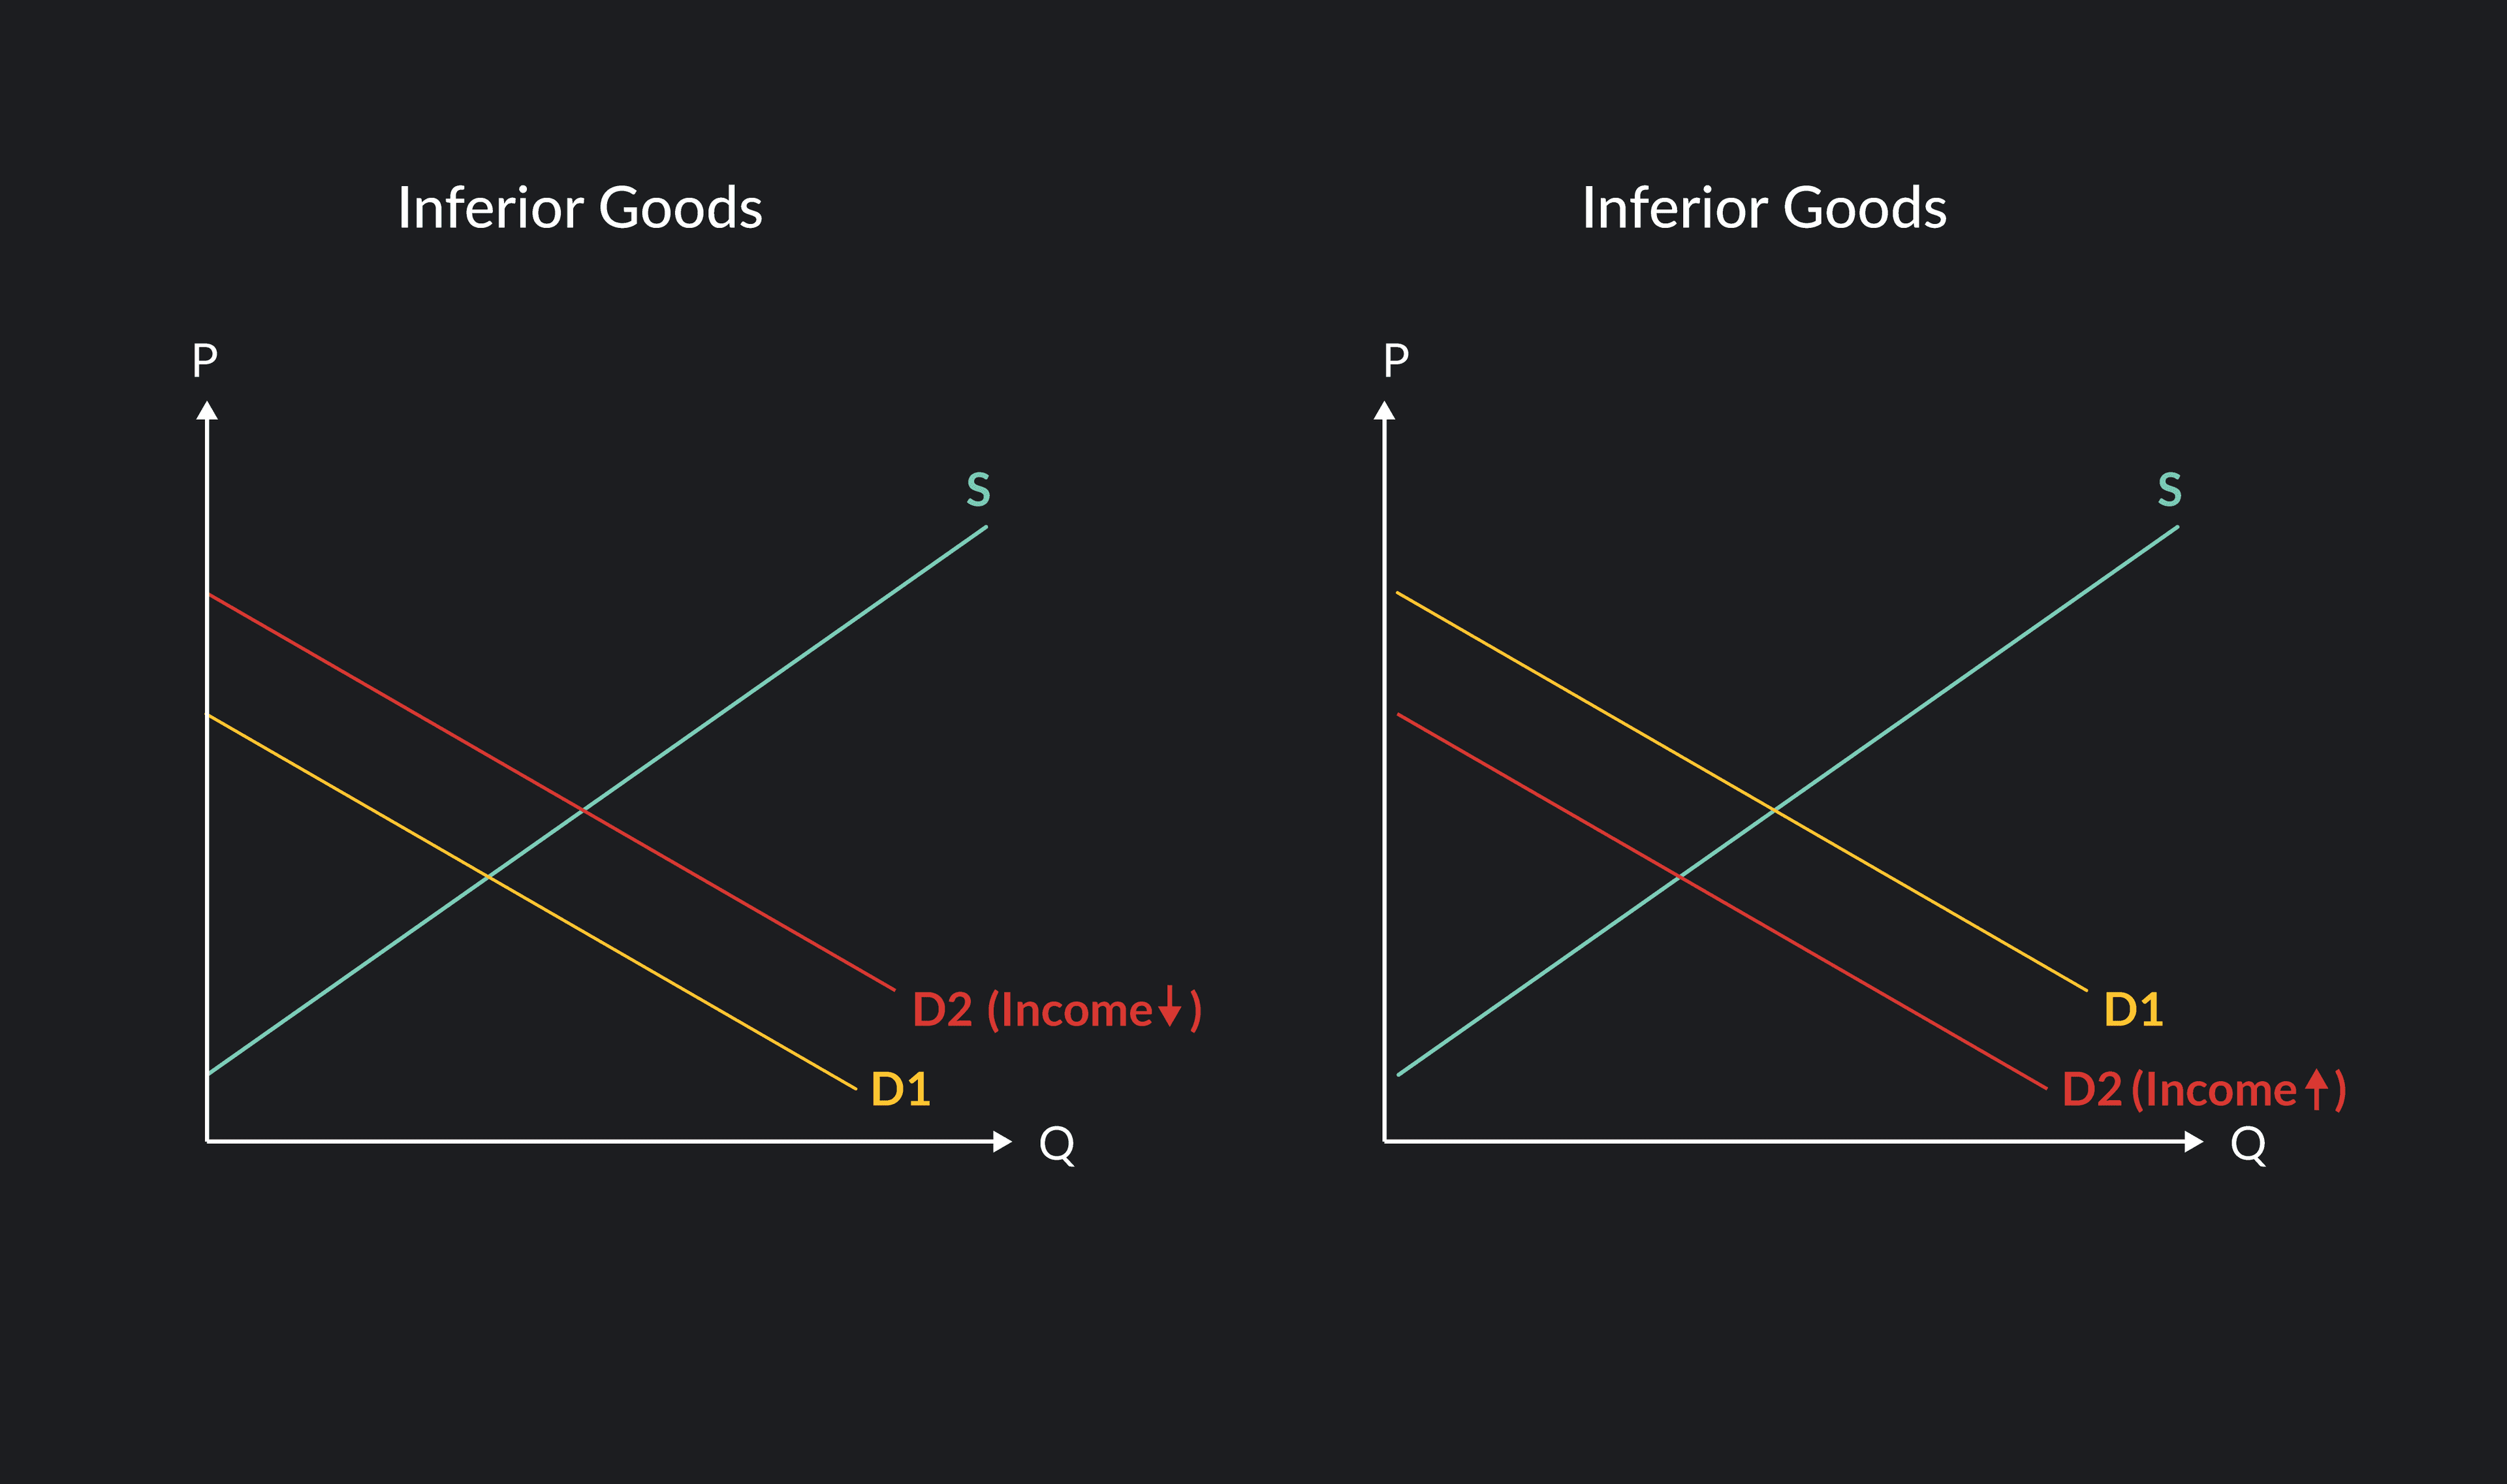
There is one interesting exception when we say a decrease in the income level causes a shift to the left, and it’s for inferior goods.
What are inferior goods? These are necessary goods that people rely on to survive when they are short on money, like basic foods (e.g., bread, rice, potatoes) or cheap clothing to stay warm. When the income level drops, the demand for such goods actually increases, so the demand shifts to the right for inferior goods. When the income level increases (or at least stabilizes), the demand for inferior will then decrease as people will once again be able to afford high quality products.
Final Demand Curve FAQs
How does income affect demand?
Let’s assume we have a demand curve for the newest Tesla car. Now imagine, the general economy is doing very well, and this causes the average income of many people to increase. The increased average income will make Tesla more affordable amongst many people without the price of Tesla changing. Meaning, the demand curve for Tesla shifts to the right.
Why should you care about the demand curve shifting?
Understanding the shift in the demand curve helps you make more accurate forecasts about the demand for any good or service. Knowing when a shift in the demand curve is likely to occur helps both buyers and sellers plan ahead. If the demand curve is likely to shift to the right, then producers will have to prepare more goods to sell.
Understanding how these five events shift the demand curve also informs us about the broader economy. Economists often combine the demand curves of all goods and services that are for sale to understand broader economic trends. Knowing when a shift is likely to occur allows us to better understand broader economic trends.
Explore Outlier's Award-Winning For-Credit Courses
Outlier (from the co-founder of MasterClass) has brought together some of the world's best instructors, game designers, and filmmakers to create the future of online college.
Check out these related courses: