In This Article
What Is the Demand Curve?
What Does a Shift of the Demand Curve Mean?
Implications of a Demand Shift
What Does Movement Along a Demand Curve Mean?
How Are Shift and Movements Different?
What Are the Determining Factors?
Can They Both Happen at the Same Time?
What Is the Demand Curve?
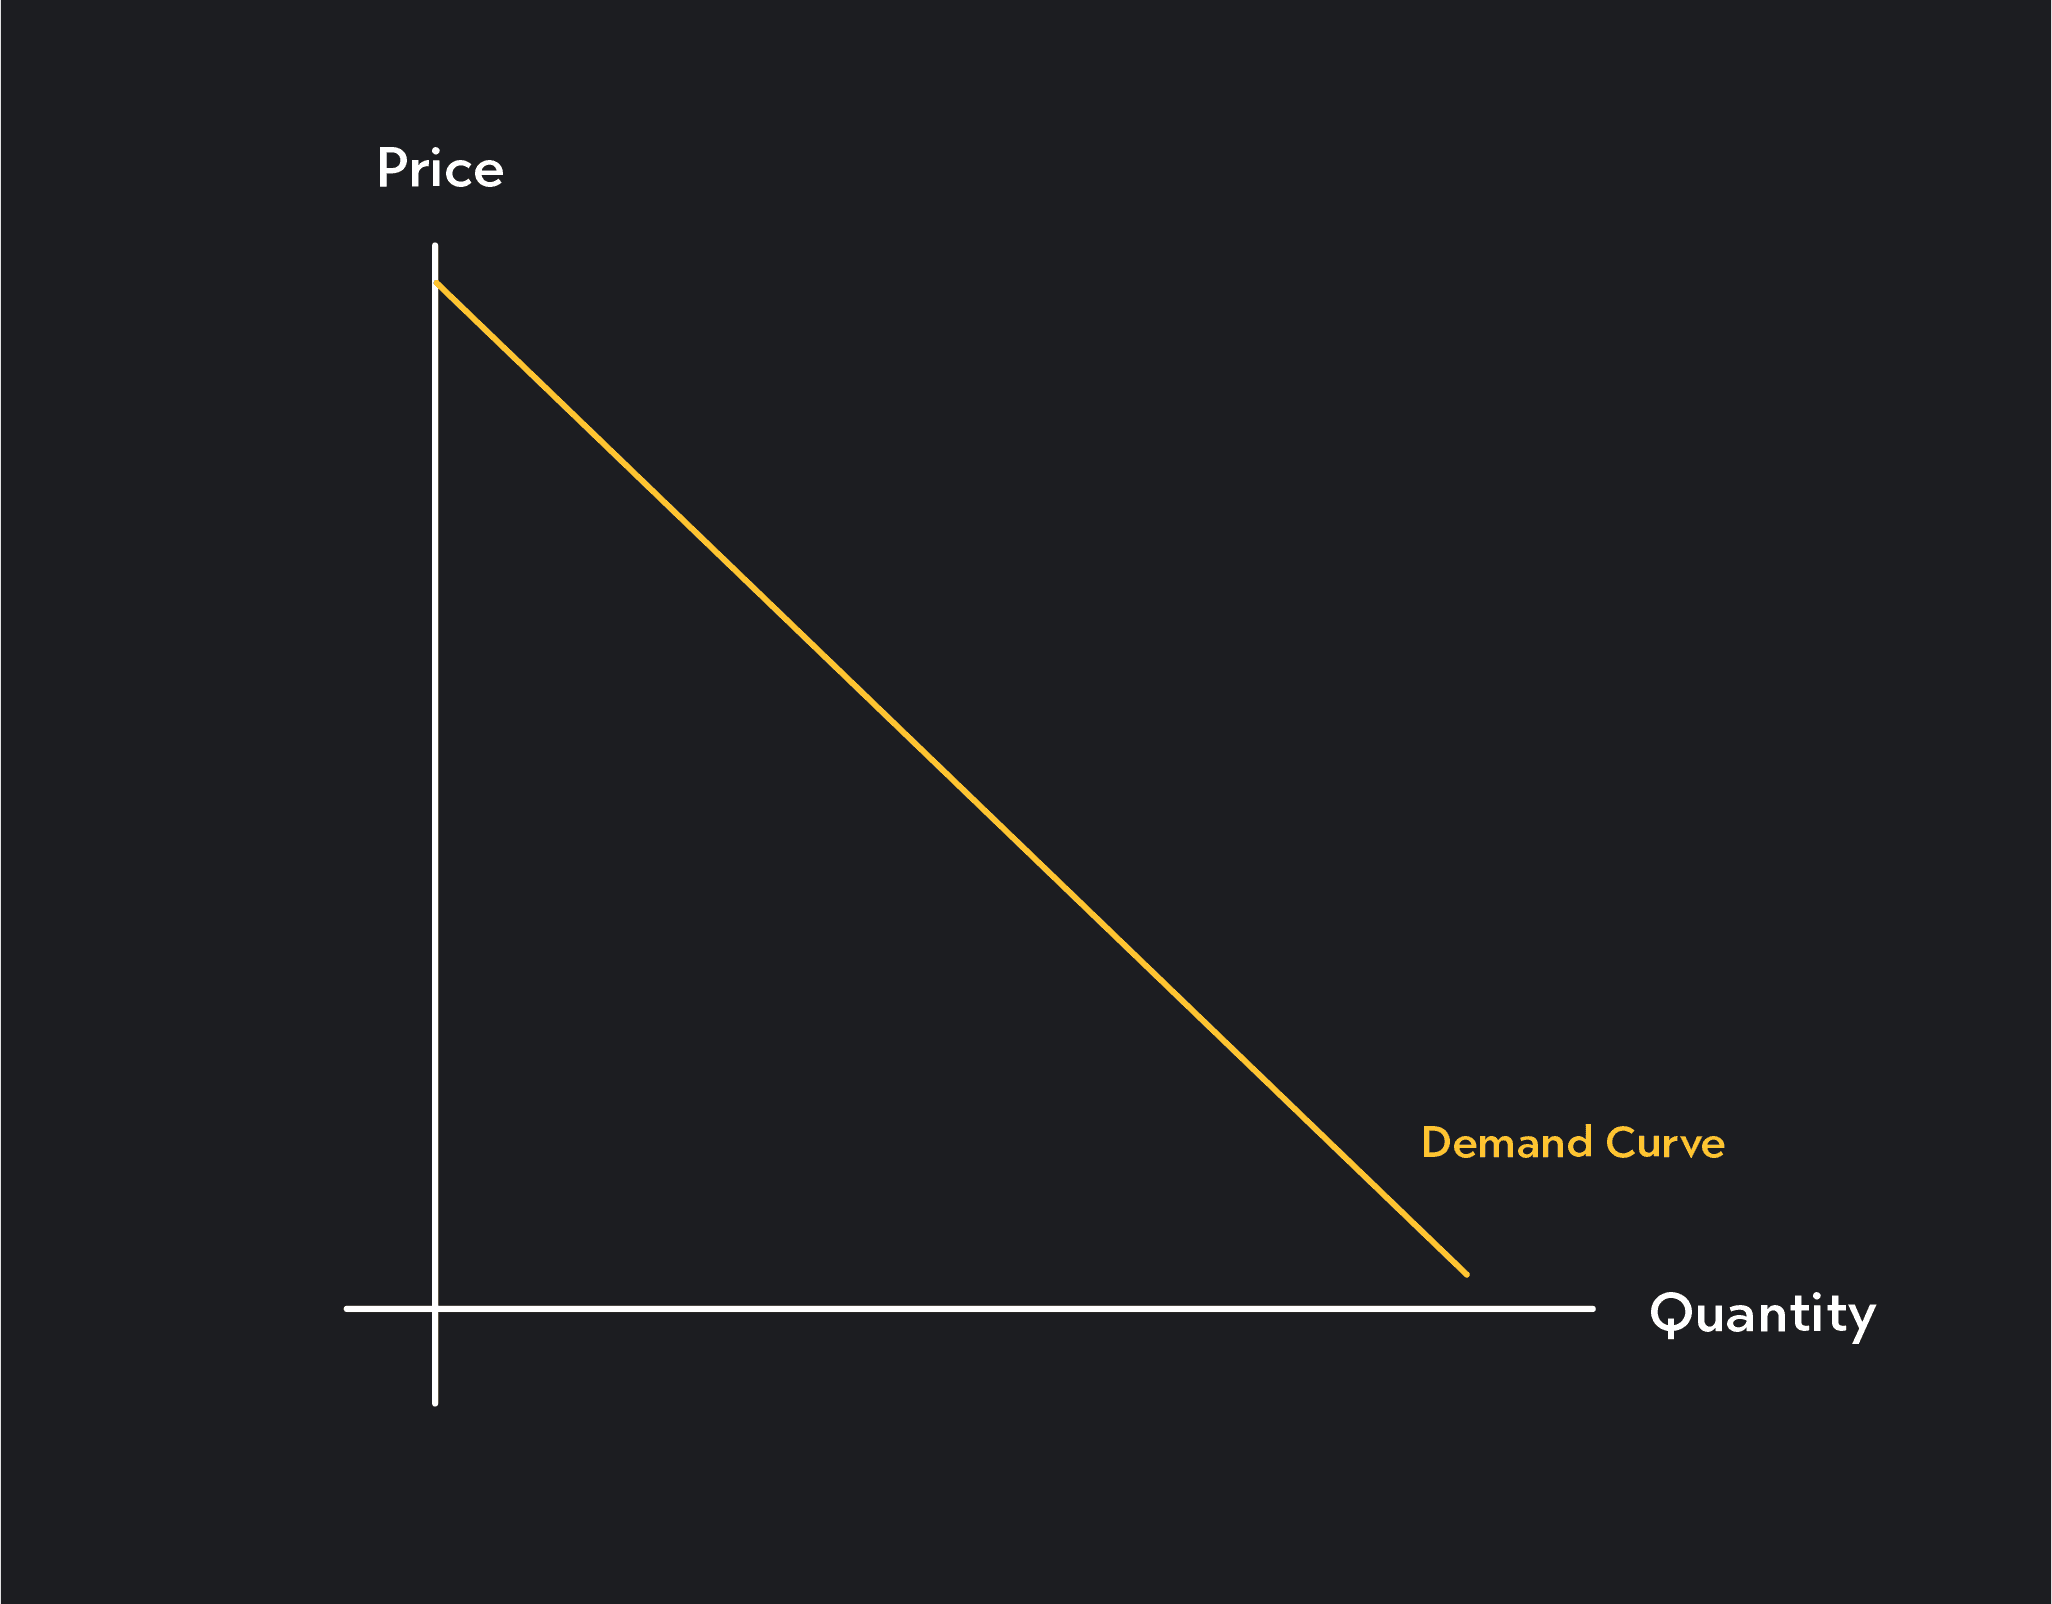
In economics, a demand curve is a graph summarizing the behavior of buyers in a market. More specifically, the demand curve shows the relationship between the quantities of a good or service consumers are willing to buy at various per-unit prices.
In a demand graph, prices are plotted on the vertical axis, and quantities are plotted on the horizontal axis. The curve typically slopes downward from left to right following the law of demand—the observation that price and quantity demanded have an inverse relationship. All else being equal, consumers typically demand smaller quantities at higher prices and greater quantities at lower prices.
What Does a Shift of the Demand Curve Mean?
A shift of the demand curve is when the entire demand curve shifts to the right or the left.
When Demand Shifts Right
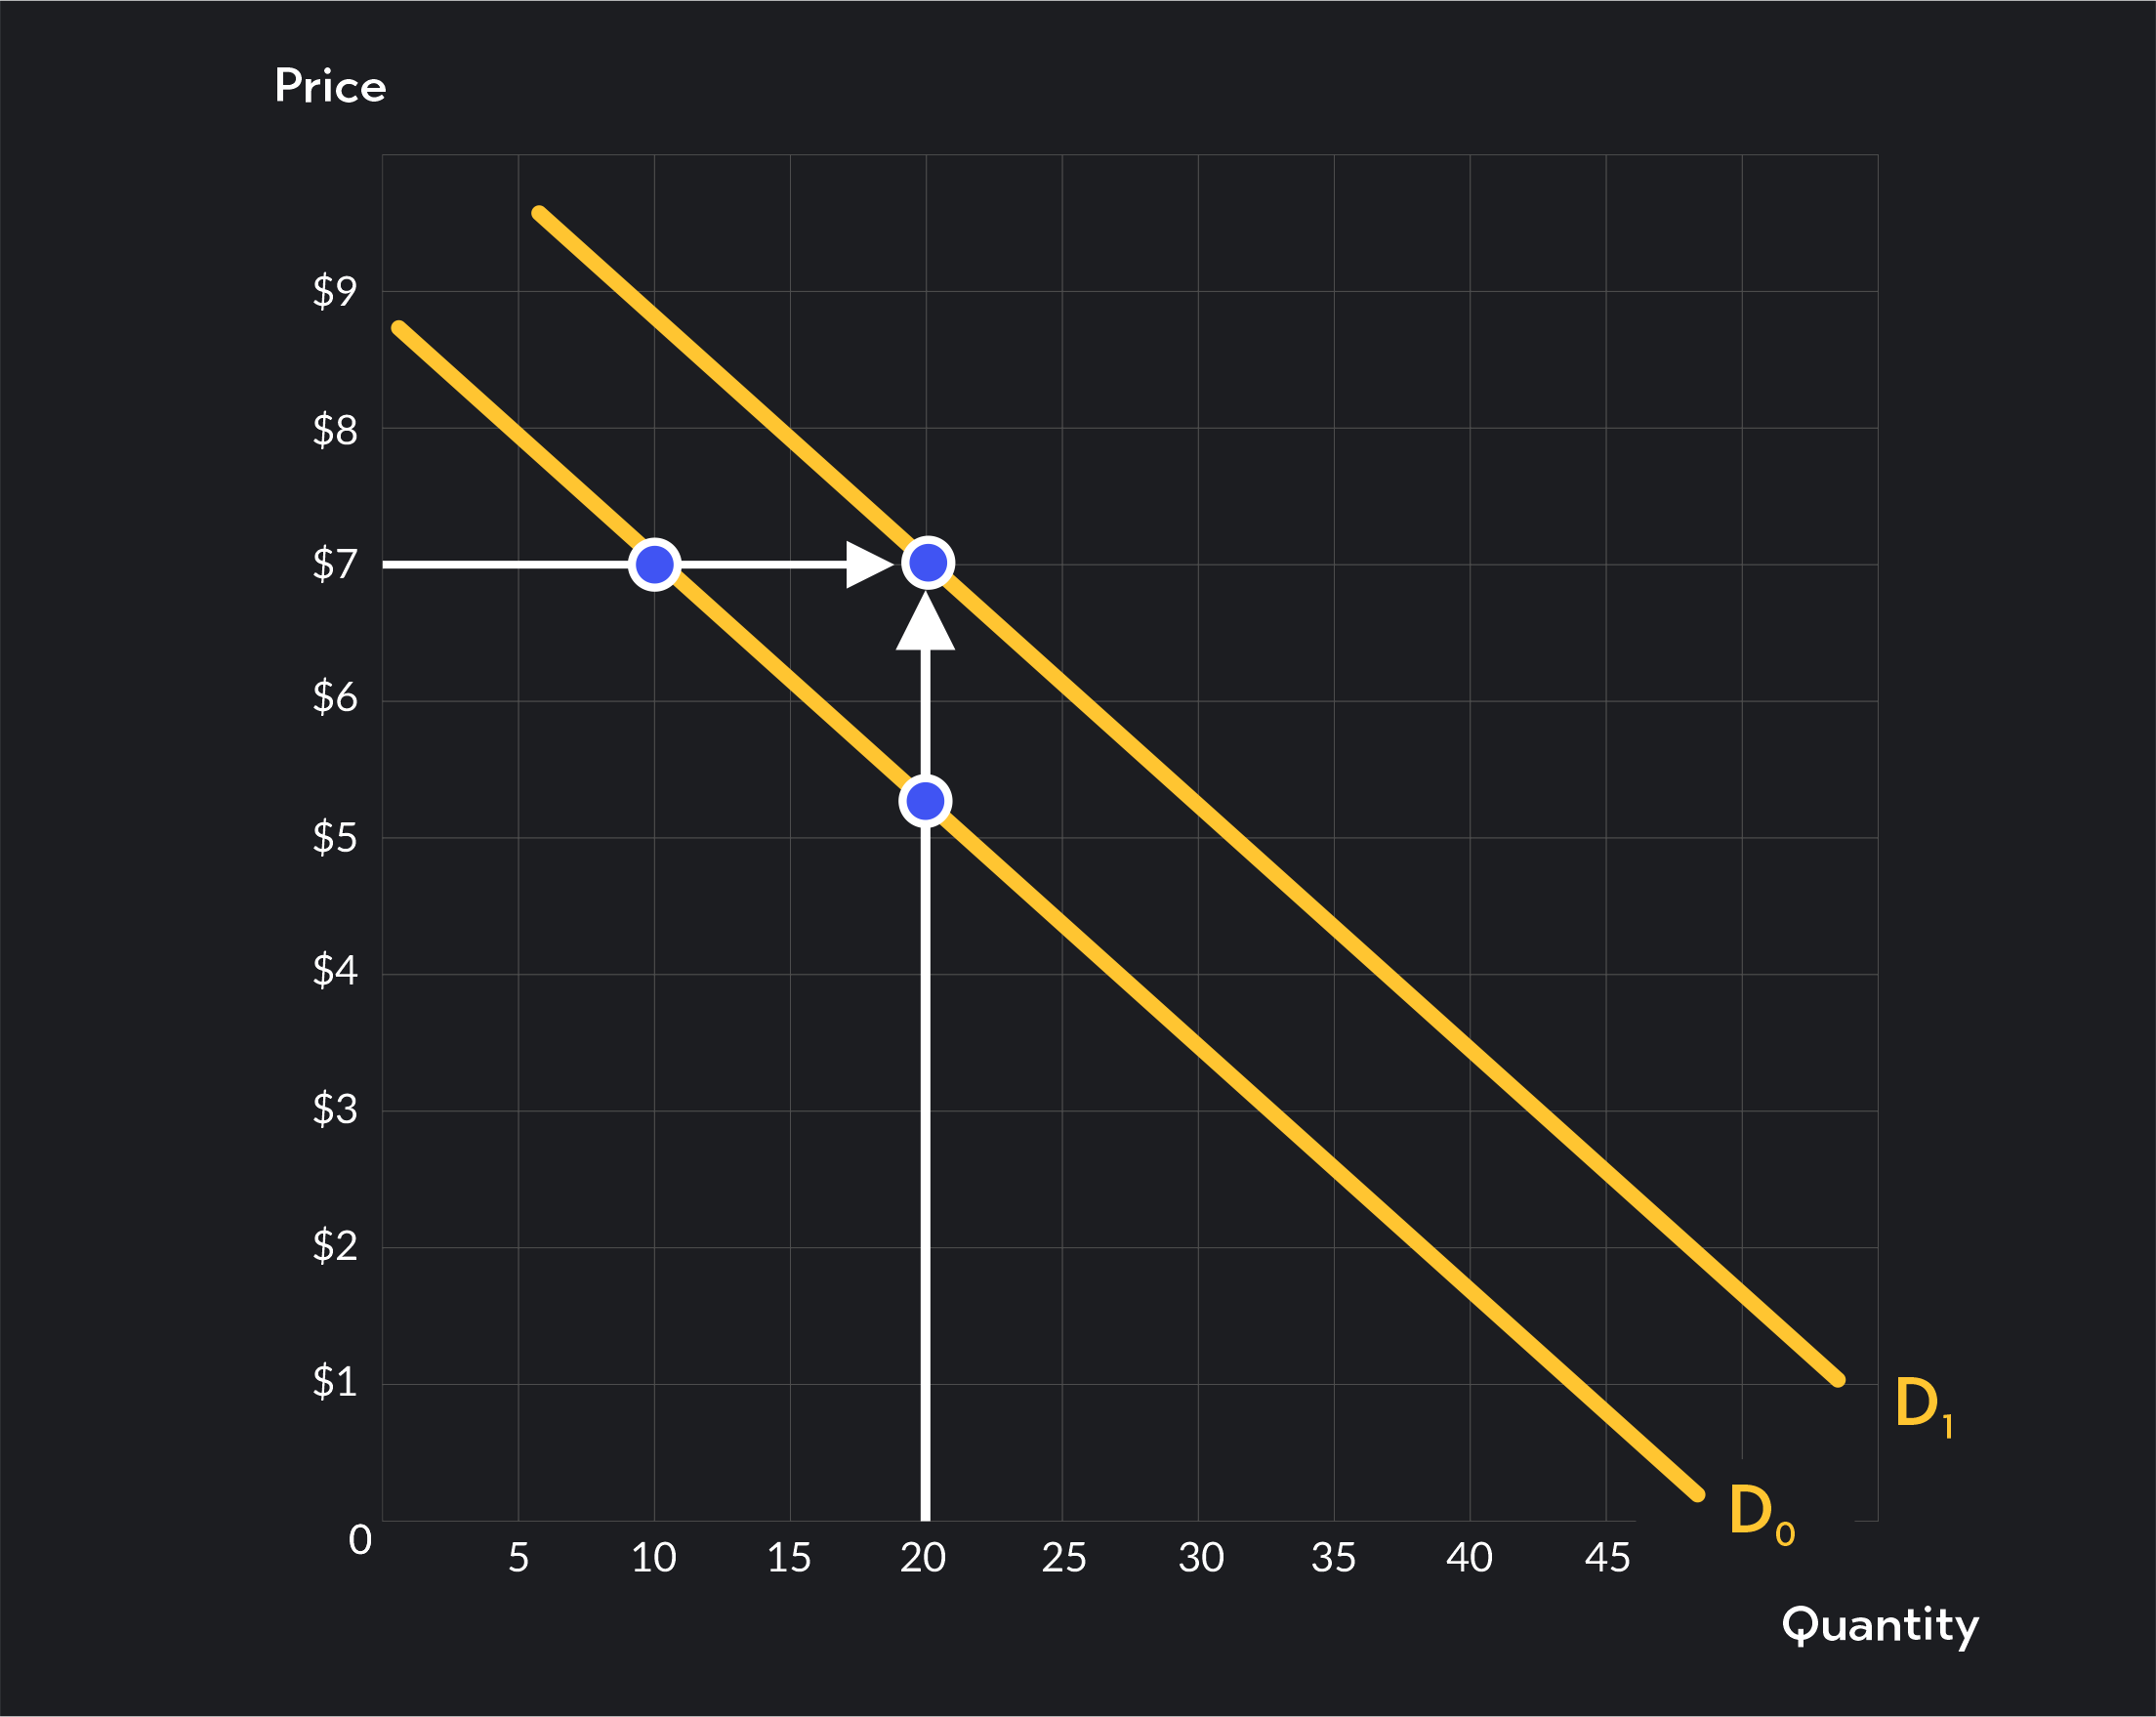
A rightward shift of the demand curve represents an overall increase in demand. It shows you how at every price, the quantities consumers demand has increased.
In the figure below, the demand curve has shifted from Do to D1. At any given price, the quantity demanded has increased. For example, at a price of $7, quantity demanded has increased from 10 units to 20 units.
Similarly, for any given quantity, consumers are now willing to pay a higher price. The maximum price consumers were willing to pay for 20 units was about $5.35 before the shift and increased to $7 after the shift.
When Demand Shifts Left
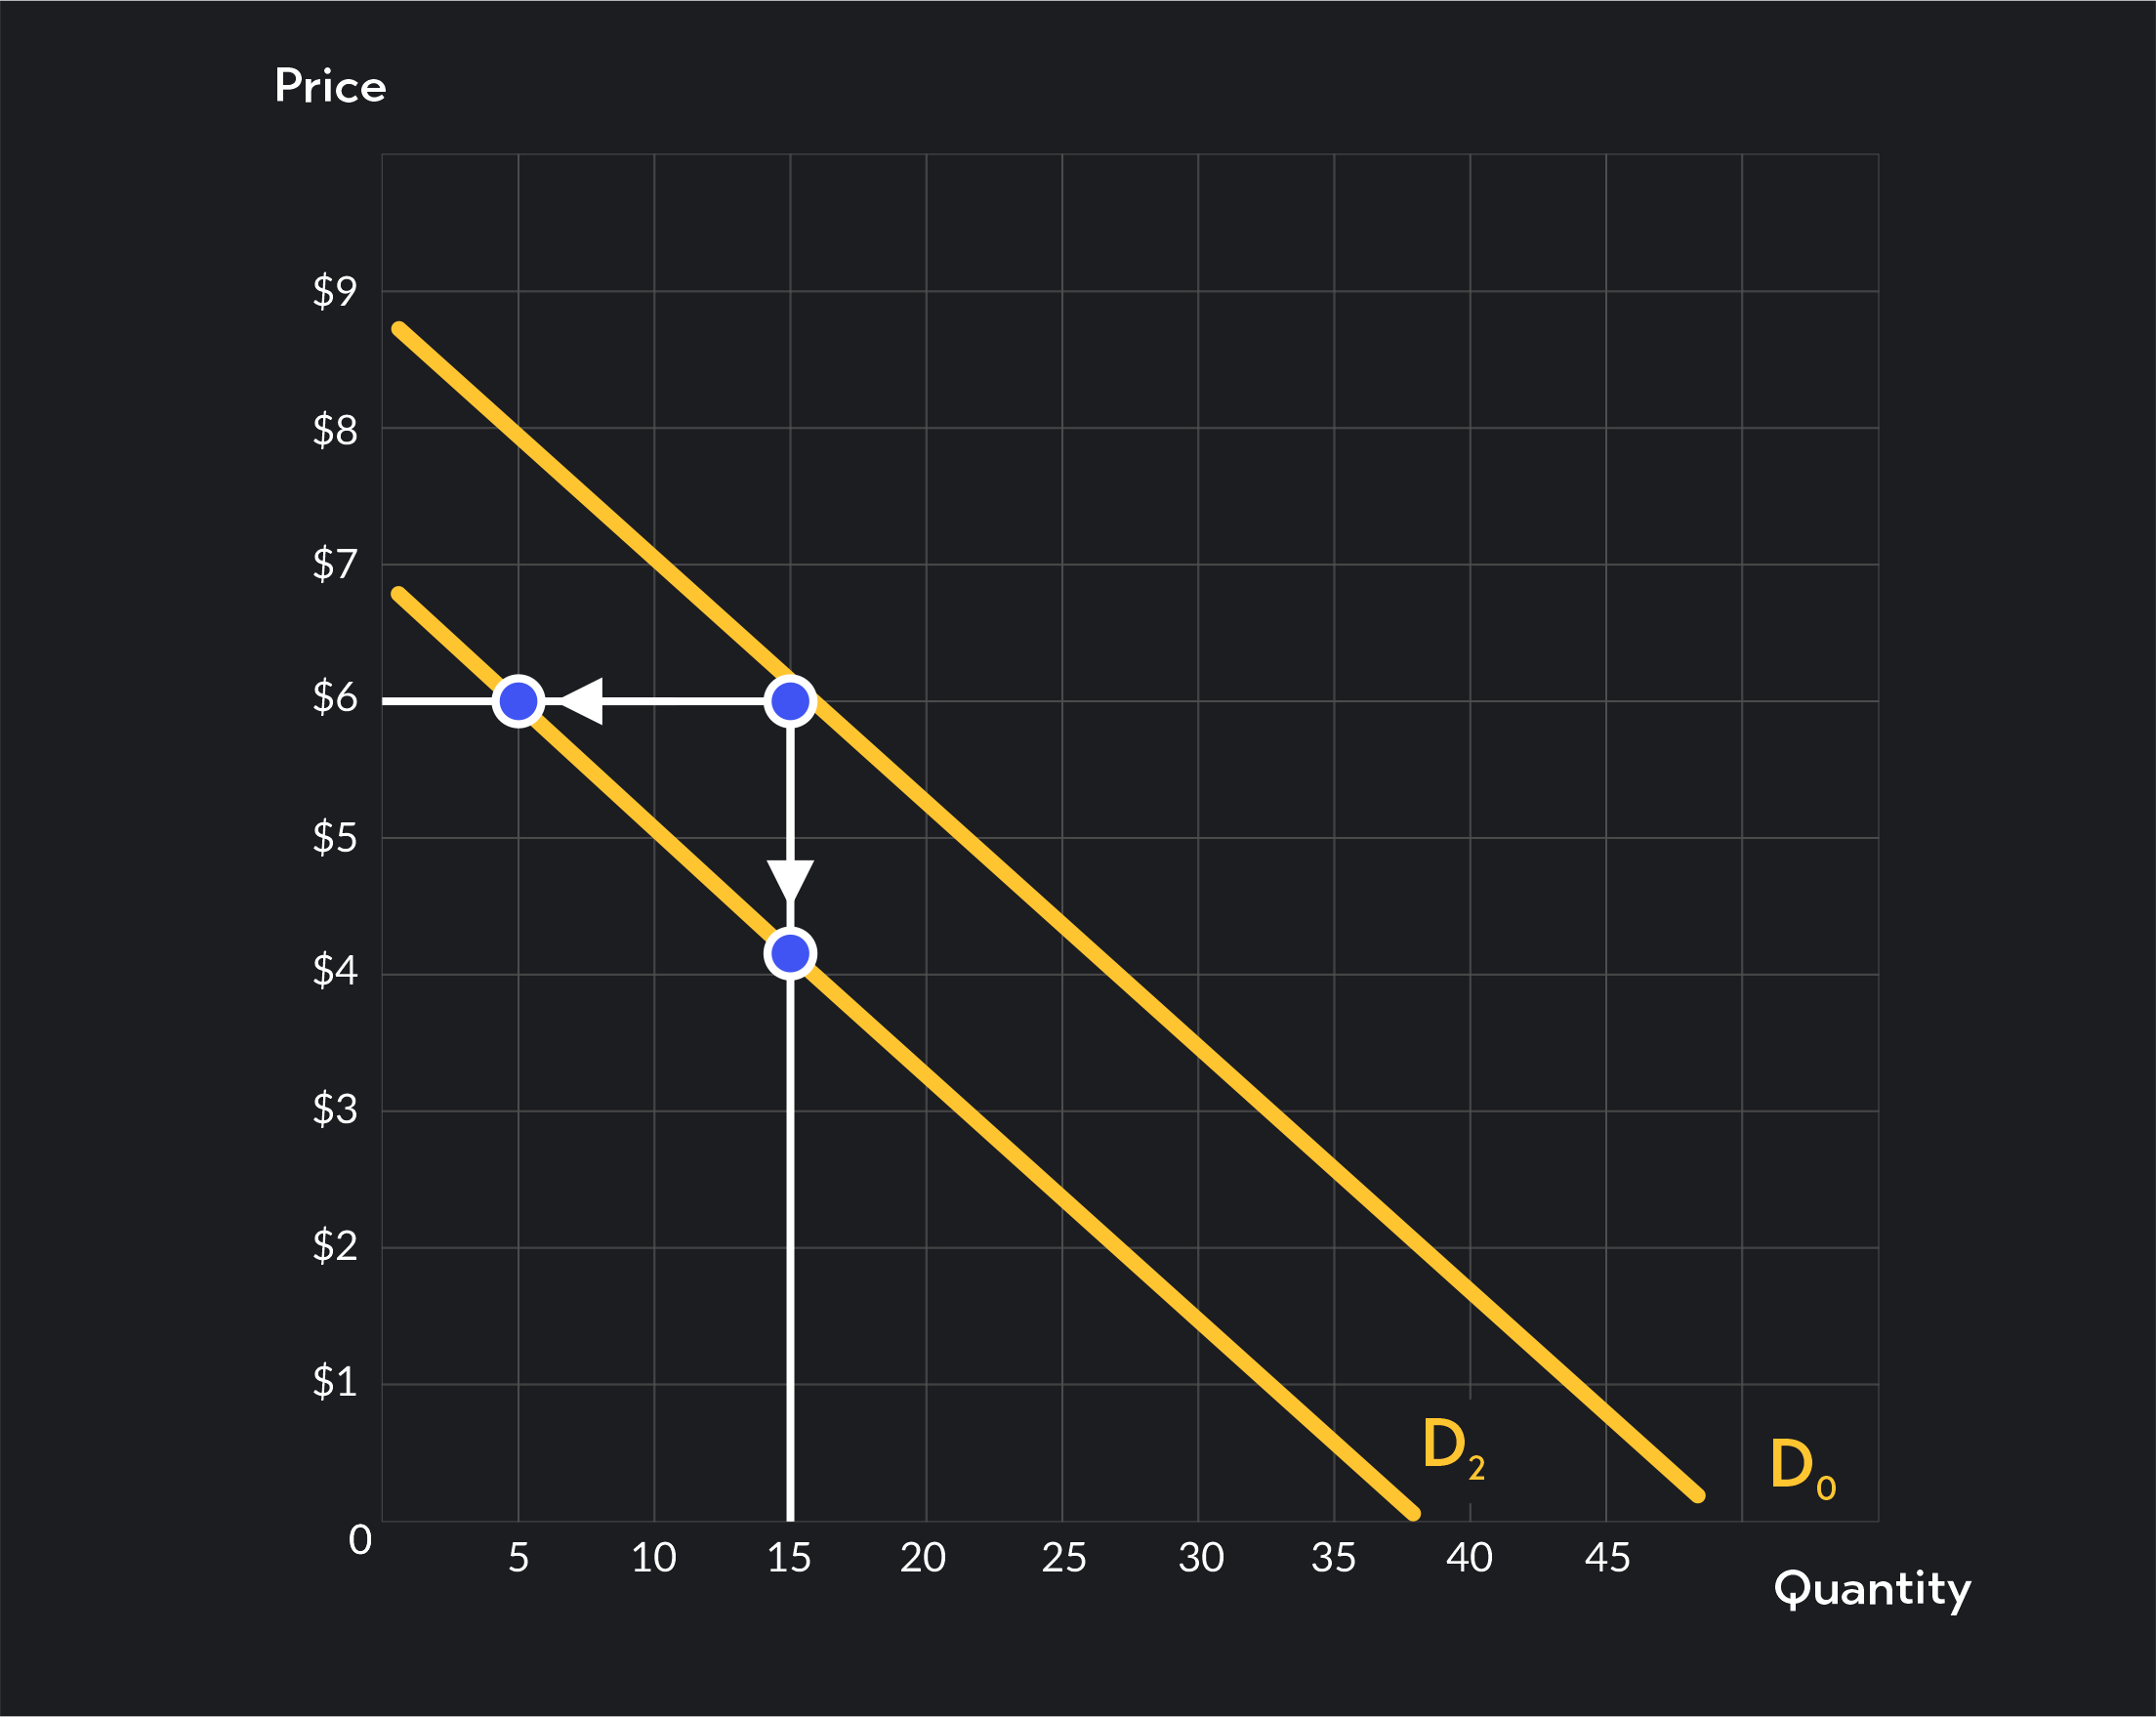
A leftward shift of the demand curve represents an overall decrease in demand. When demand shifts left, the quantities consumers demand will fall at every price.
In the figure below, the demand curve has shifted from Do to D2. At any given price, the quantity demanded has decreased. For example, at a price of $6, the quantity demanded has decreased from 15 units to 5 units. The change can also be observed in the buyers’ decreased willingness to pay for each quantity. For 15 units, the buyers’ willingness to pay has decreased from $6 to about $4.10.
Implications of a Demand Shift
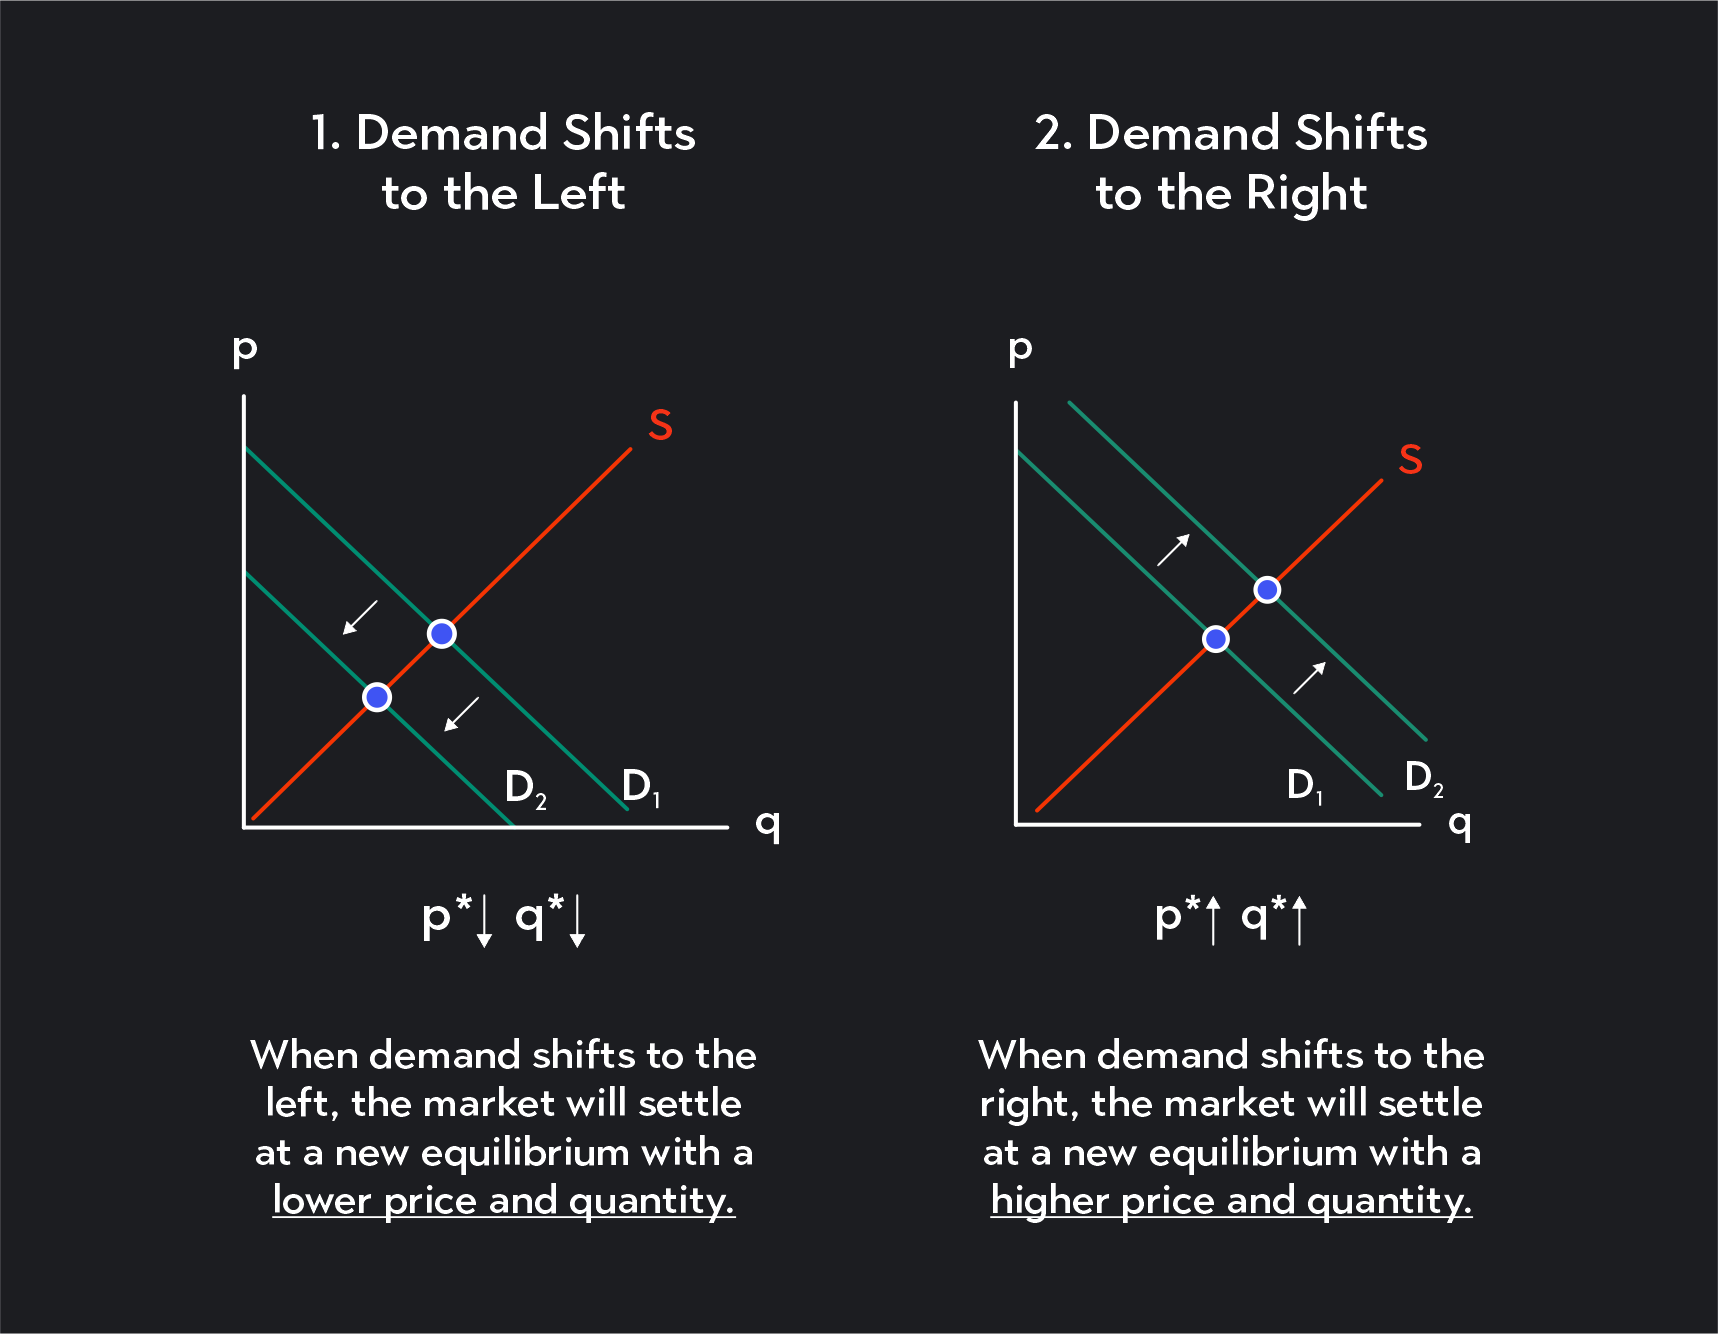
In a supply and demand model with perfect competition, the market equilibrium is found at the intersection of the demand and supply curves. If the demand curve shifts, the competitive equilibrium will change as a result.
Rightward Shift
If demand increases, the equilibrium price and quantity will both increase.
Leftward Shift
If demand decreases, the equilibrium price and quantity will both decrease.
What Does Movement Along a Demand Curve Mean?
A movement along a demand curve describes a change shown on a single demand curve. A movement tells you how quantities consumers demand respond to price changes. It’s important to remember these movements along a demand curve occur under the ceteris paribus assumption—the assumption that all relevant factors (other than price) are being held constant. Anything else that could cause the demand curve to shift is assumed to be unchanging.
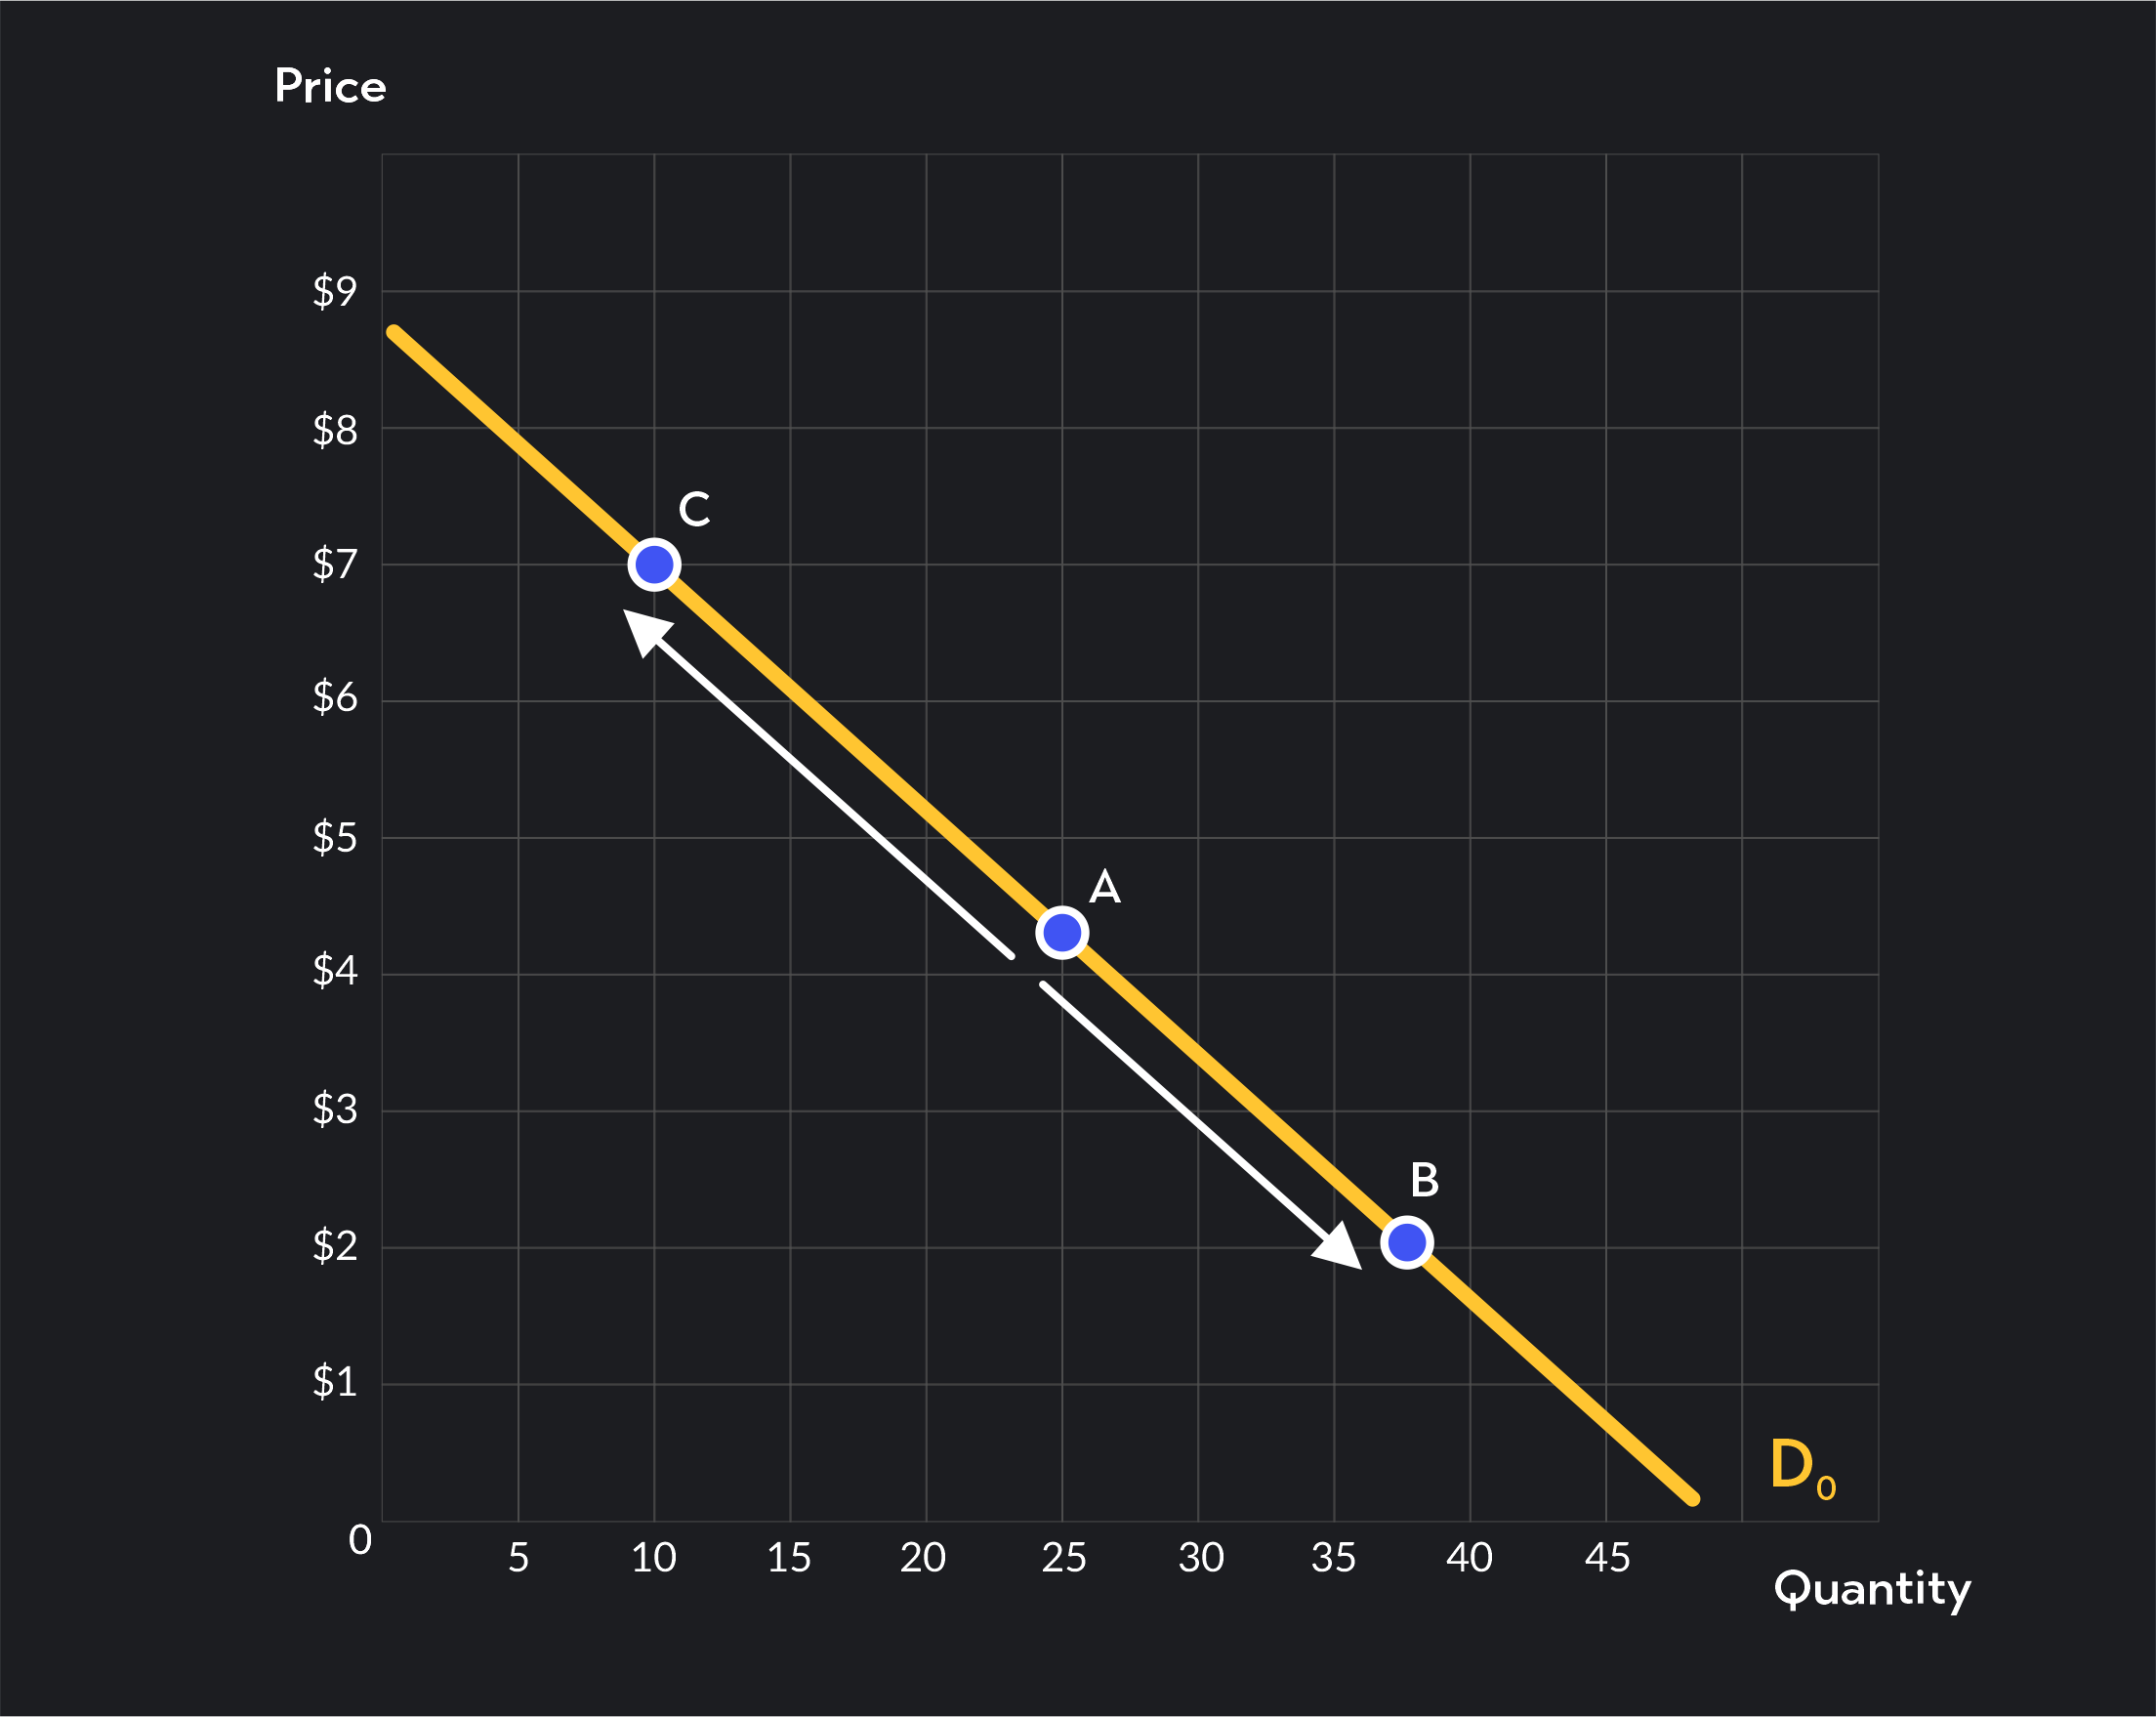
The figure below shows two examples of movements along a demand curve.
First, take a look at the downward movement from Point A to Point B. On this demand curve, a price of $4.30 corresponds to a quantity demanded of 25 units. The movement from Point A to Point B tells you that: all else being equal (ceteris paribus), if the price falls from $4.30 to $2.00, the quantity demanded will increase from 25 to 37 units.
Next, take a look at the movement from Point A to Point C. This shows an upward movement along the demand curve as price increases. This movement tells you that: ceteris paribus, if the price increases from $4.30 to $7.00, quantity demanded will decrease from 25 units to 10 units.
You could choose any two points along the demand curve and describe similar movements.
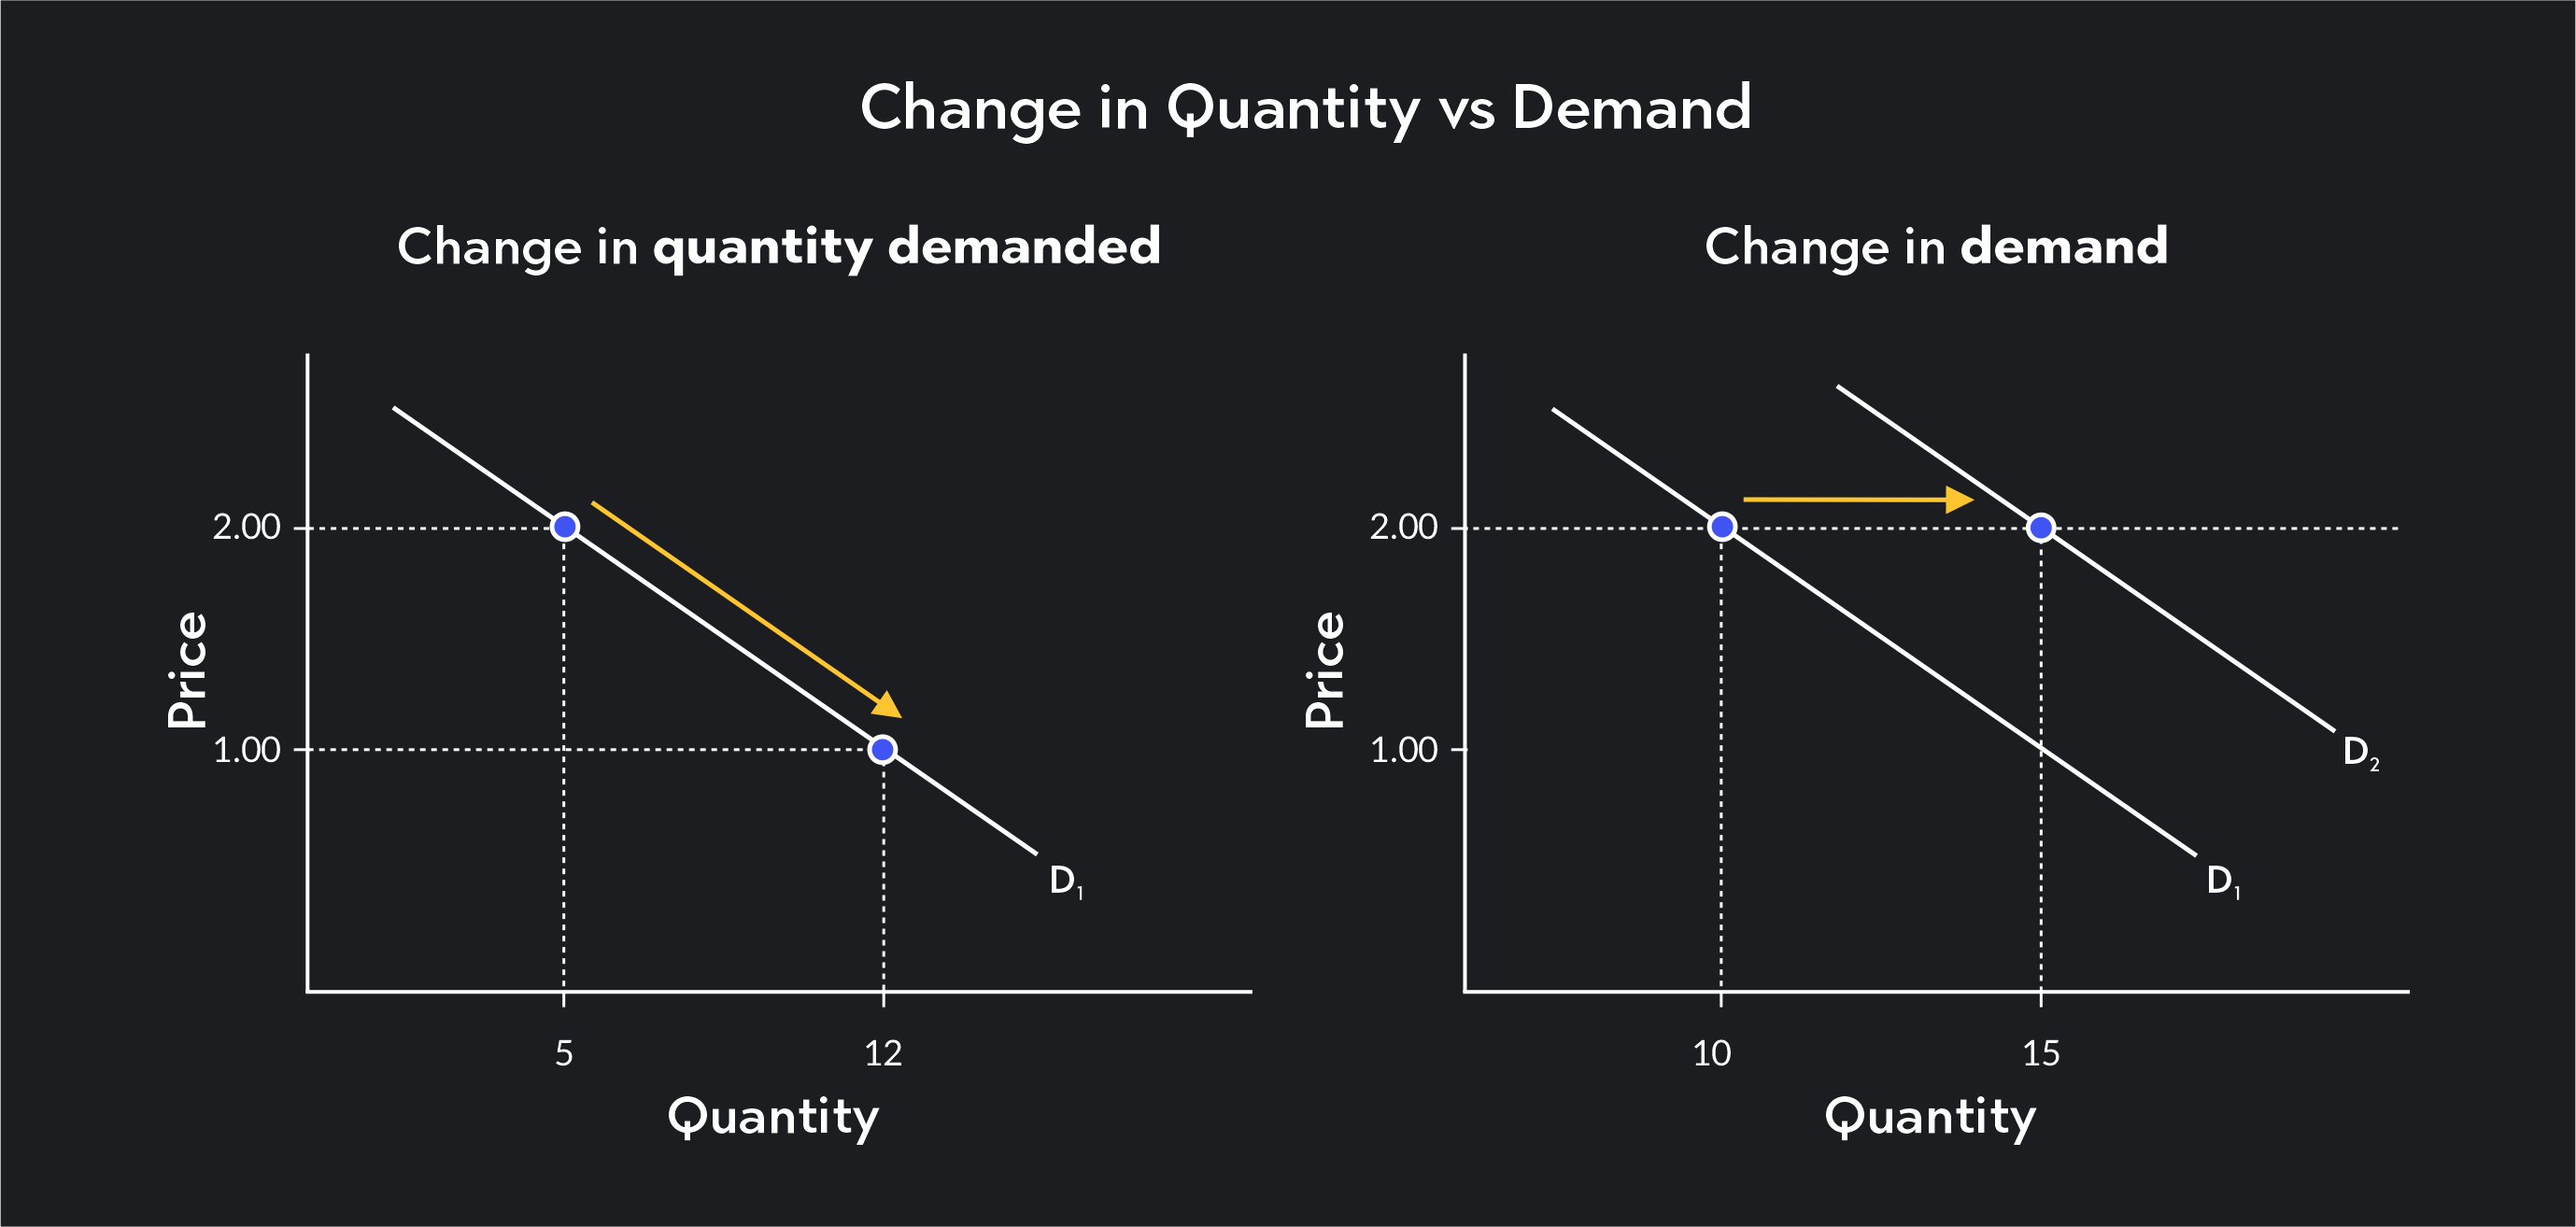
How Are Shift and Movements Different?
The main difference between a movement and a shift of the demand curve is that a shift describes a change in overall demand. In contrast, a movement describes a ceteris paribus change in quantity demanded.
The terms demand and quantity demanded may sound similar, but in fact, they describe different things. When economists talk about demand, they refer to an entire demand curve—the full set of quantities and prices shown by the curve. Quantity demanded refers to a single quantity associated with a particular price (or a particular point) on the demand curve.
What Are the Determining Factors?
A change in price always causes movements along a demand curve. When we talk about movements along a demand curve, only two variables change: price and quantity demanded. Everything else is held constant.
Factors other than price cause shifts of the demand curve. When these other factors change, consumer behavior is affected in a way that buyers demand more or fewer goods at every price. As a result, the entire demand curve moves. Changes in any of the following non-price determinants can affect demand and cause the demand curve to shift:
Consumer Preferences
If a good becomes more popular, demand will increase (shift to the right). If a good becomes less popular, demand will decrease (shift to the left).
Income or Budgets
For most goods, an increase in consumer incomes or budgets will lead to increased demand (a shift to the right). These goods are called normal goods. If a good is instead an inferior good, demand will decrease (shift to the left) as incomes increase.
Demographics
Demand increases (shifts to the right) if a demographic change leads to an increase in the number of buyers, and demand decreases (shifts to the left) if, instead, the number of buyers decreases.
Prices of Related Goods and Services
The price of related goods and services can impact demand. Complements are products that are often consumed together, while substitute goods are products that can be consumed in place of another. If the price of complementary goods increase/decrease, demand will shift to the left/right. If the price of substitutes increases/decreases, demand will shift to the right/left.
Expectations About the Future
Demand can shift to the right or to the left as consumer expectations change. For example, if buyers think the future price of a good will be lower, they may put off buying the good, and demand will temporarily shift to the left. Similarly, if they think an item will be more expensive or no longer available in the future, they may rush to the store, pushing demand to the right.
Can They Both Happen at the Same Time?
Shifts in demand and movements along a demand curve may happen in succession, but they cannot happen simultaneously.
Remember, a movement along a demand curve describes a change in quantity demanded that occurs when all factors other than price are held constant. A shift can only occur if one of those other factors does change.
Explore Outlier's Award-Winning For-Credit Courses
Outlier (from the co-founder of MasterClass) has brought together some of the world's best instructors, game designers, and filmmakers to create the future of online college.
Check out these related courses: