In This Article
What Is Supply and Demand?
The Law of Supply and the Law of Demand
What Are the Equilibrium Price and Equilibrium Quantity?
Surpluses and Shortages
Shifts in Demand and Supply
Shifts in Demand and Supply vs Movement
Factors That Cause Demand and Supply Curves To Shift
5 Steps To Predict Changes in Equilibrium Price and Quantity
Predicting Changes When Both Supply and Demand Shift
Practice Questions
What do the following headlines mean?
“Europe’s electricity prices are soaring”
“Store shelves are no longer bare, but baby formula remains in short supply”
“Changing consumer habits pose a new challenge for retailers”
You can explain each of these headlines using supply and demand. Let’s find out how.
What Is Supply and Demand?
Supply and demand is a model of how buyers and sellers interact in a market.
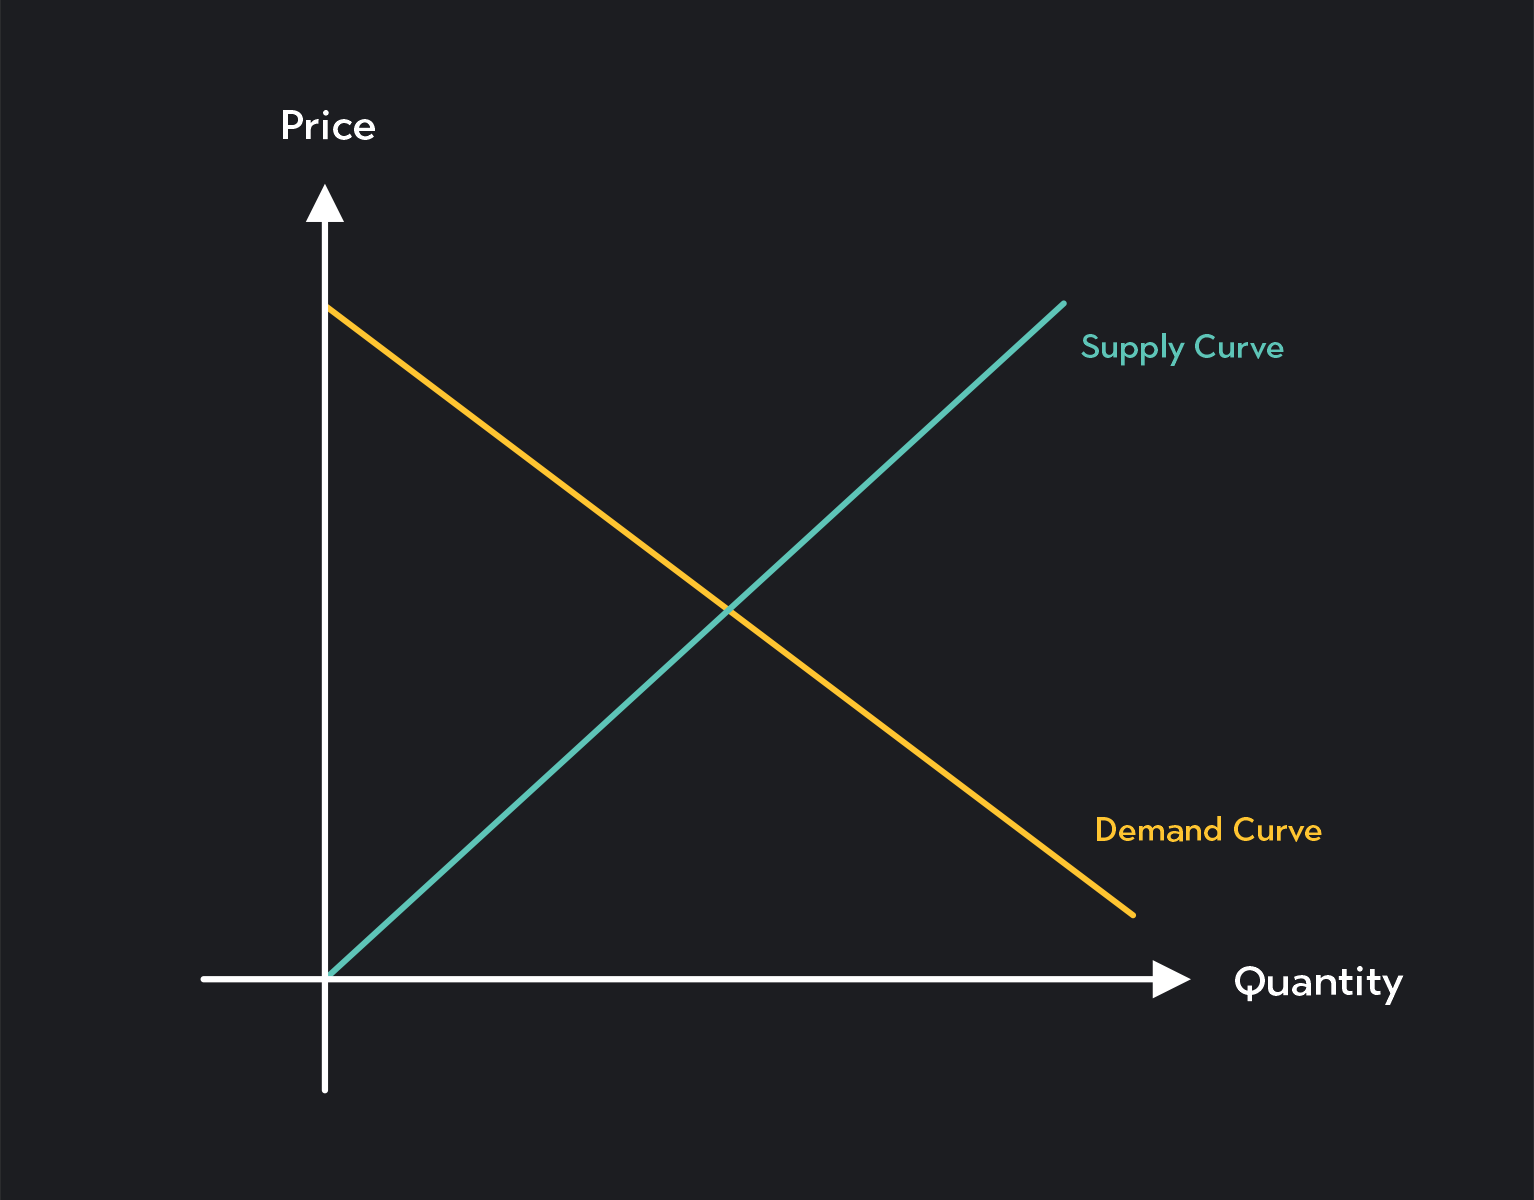
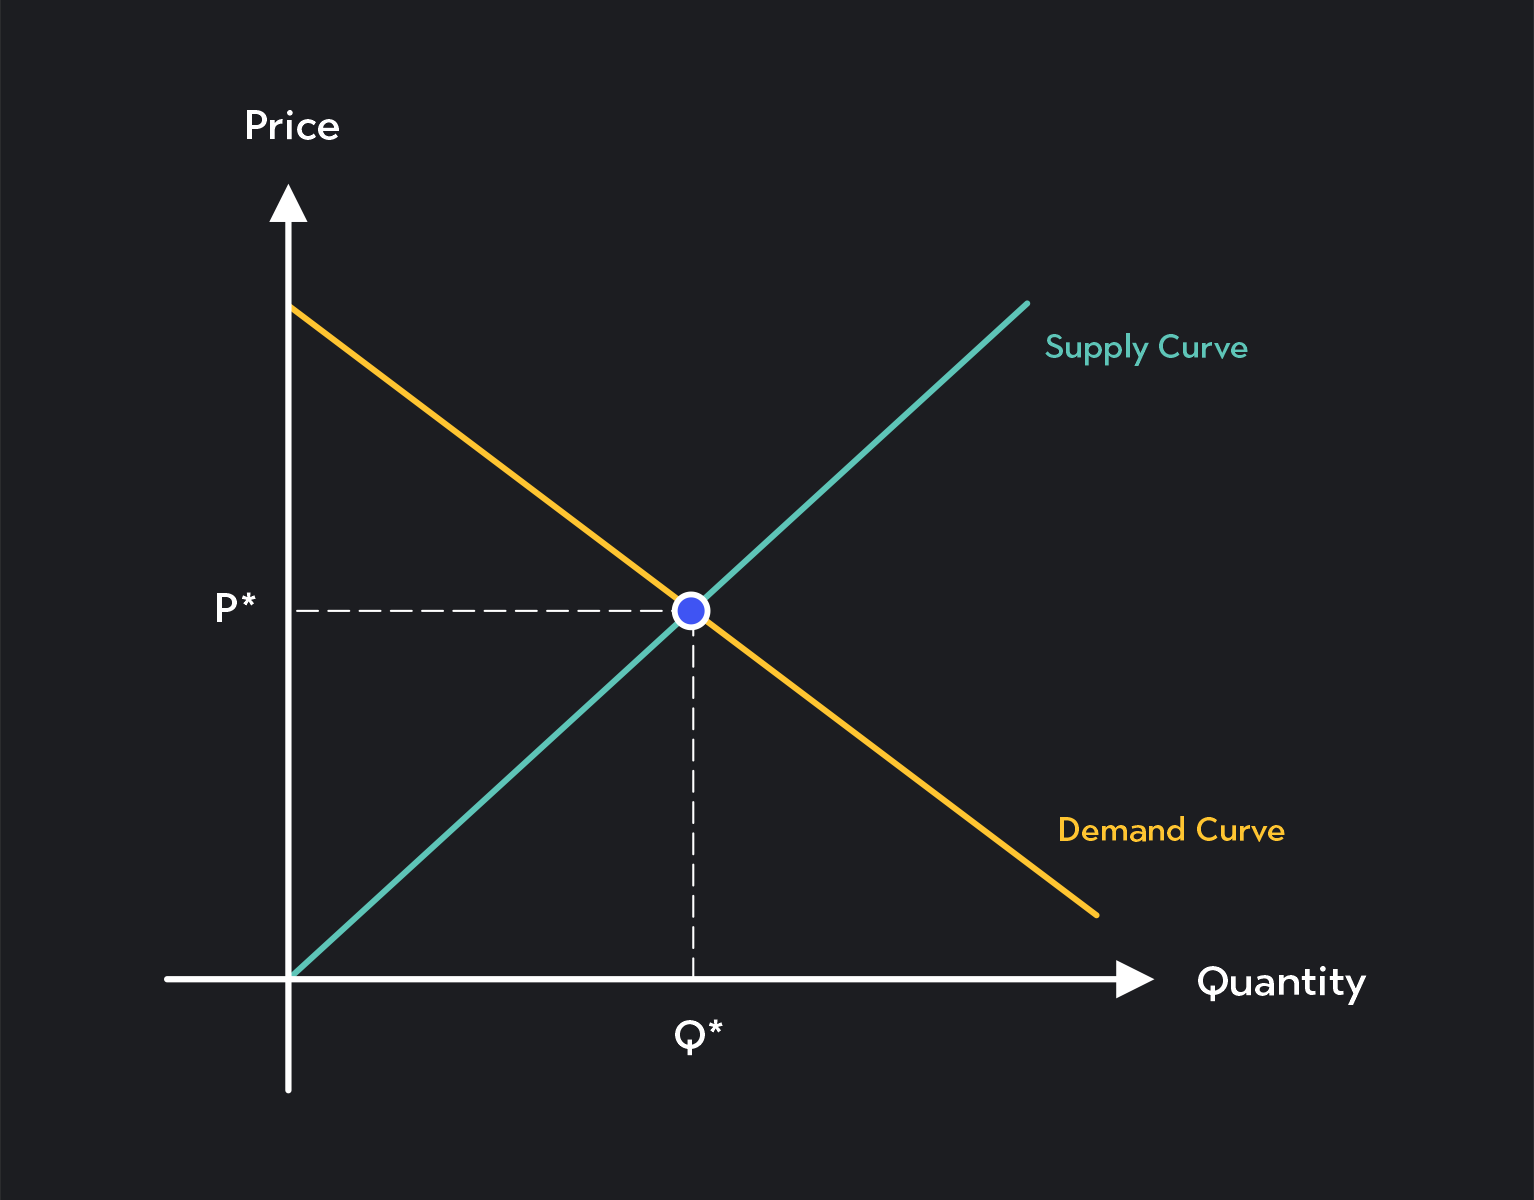
A supply and demand model graphically consists of two lines or curves: a demand curve and a supply curve. Below, price is on the vertical axis and quantity on the horizontal axis.
The supply curve represents the producer or seller’s side of the market and tells you the quantity of a good or service that sellers are willing to produce at various prices.
The demand curve represents the consumer or buyer’s side of the market. It tells you the quantity of a good or service that buyers are willing to purchase at various prices.
Every point along the supply and demand curves is associated with a particular price and quantity. We often refer to the specific quantity as the quantity demanded for a demand curve and the quantity supplied for a supply curve.
The Law of Supply and the Law of Demand
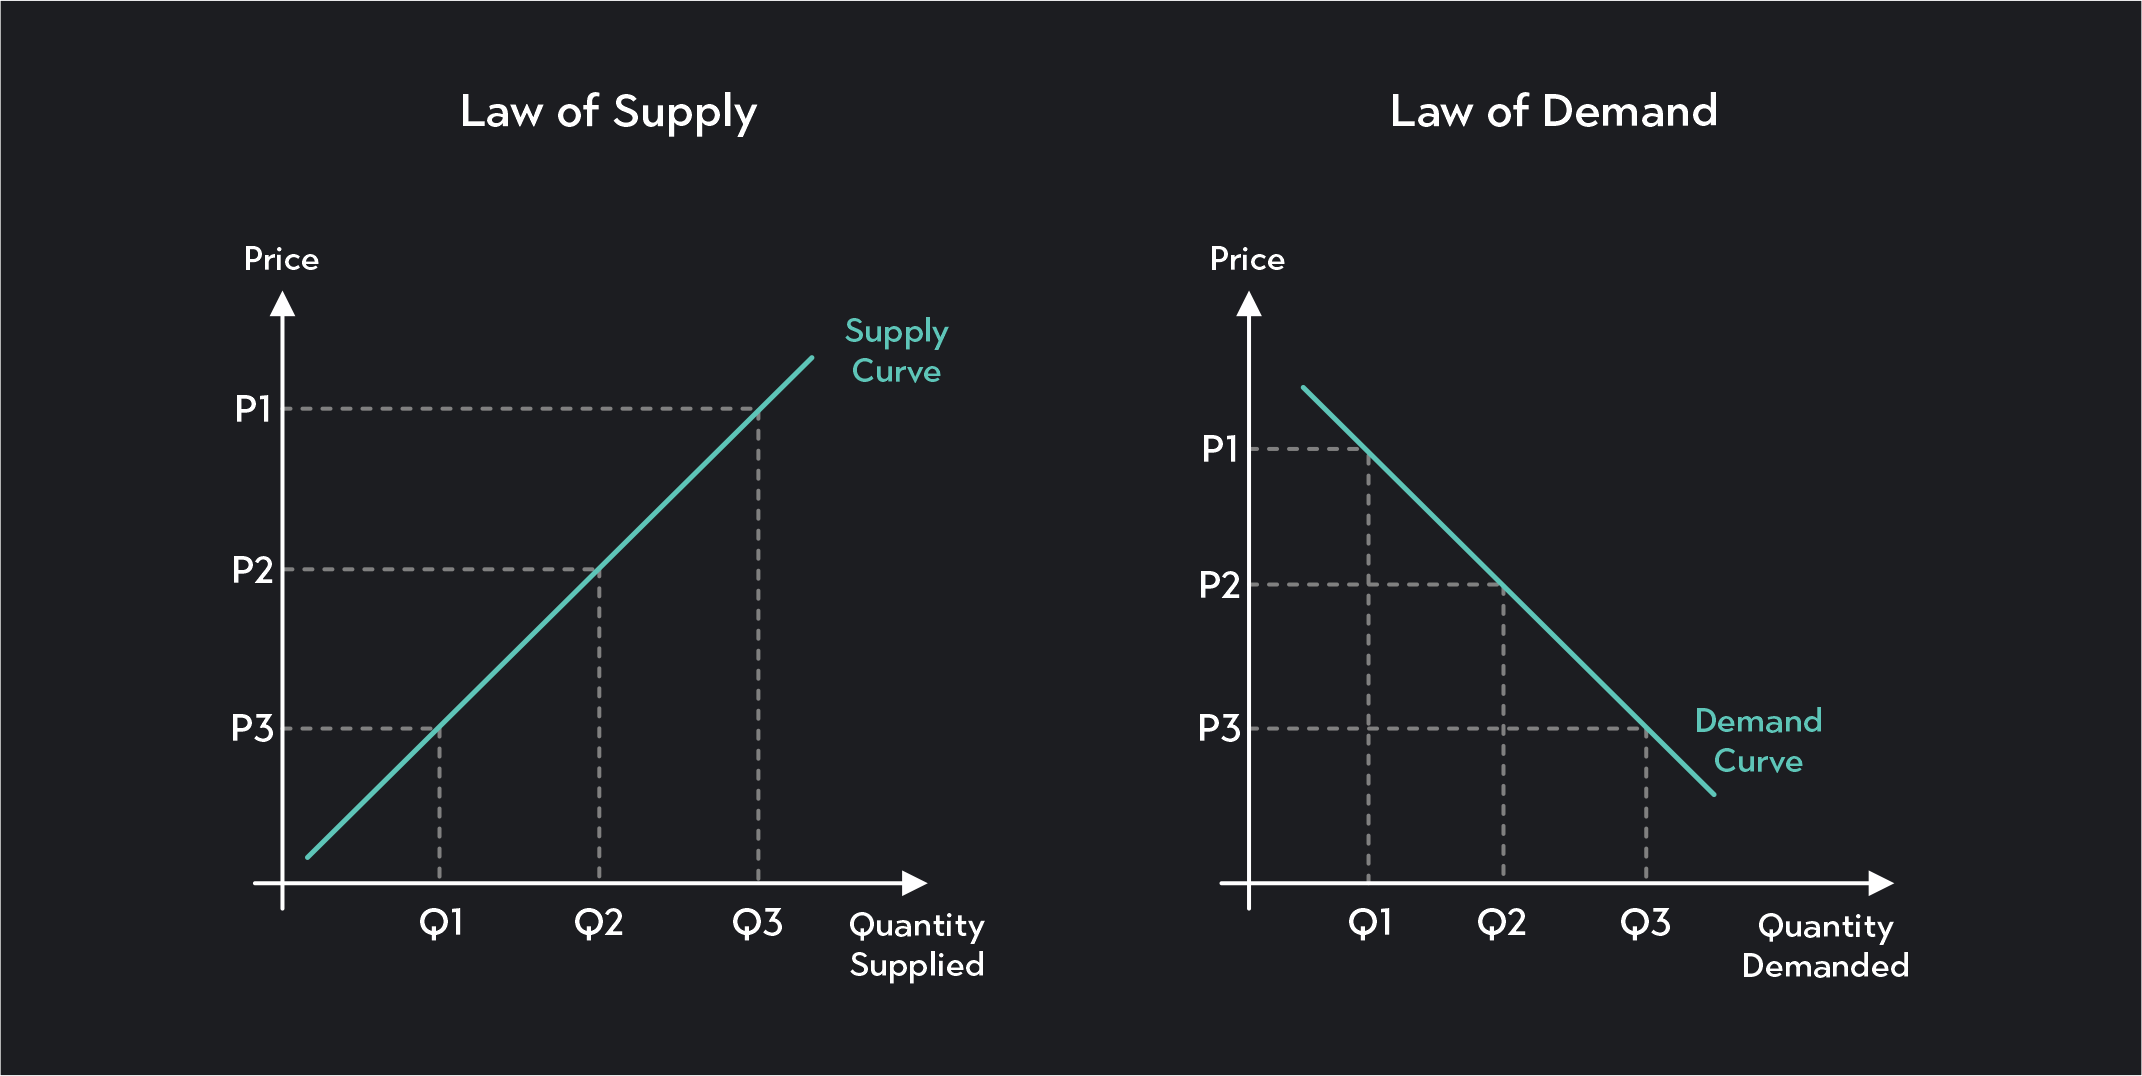
Notice that in the supply and demand model, the supply curve slopes upward, and the demand curve slopes downward. This is almost always the case. Two guiding principles in economics explain why: the law of supply and the law of demand.
The law of supply states that all other things being equal, producers want to produce more of a good at higher prices and less of the good at lower prices.
The law of demand states that consumers respond to price changes in the opposite direction. All else being equal, consumers demand less of a good when the price is high and more of a good when the price is low.
What Are the Equilibrium Price and Equilibrium Quantity?
When modeling markets, economists make assumptions about the characteristics of the market they are studying. Depending on these assumptions, their model's predicted outcomes will differ.
The most basic version of the supply and demand model is perfect competition. In a model of perfect competition, the key assumptions are:
There are many buyers and sellers in the market
There is free entry and exit in and out of the market
A homogenous product is being bought and sold (each product is identical)
Buyers and sellers have perfect information about the product
No individual seller can unilaterally change the market price (sellers are price takers)
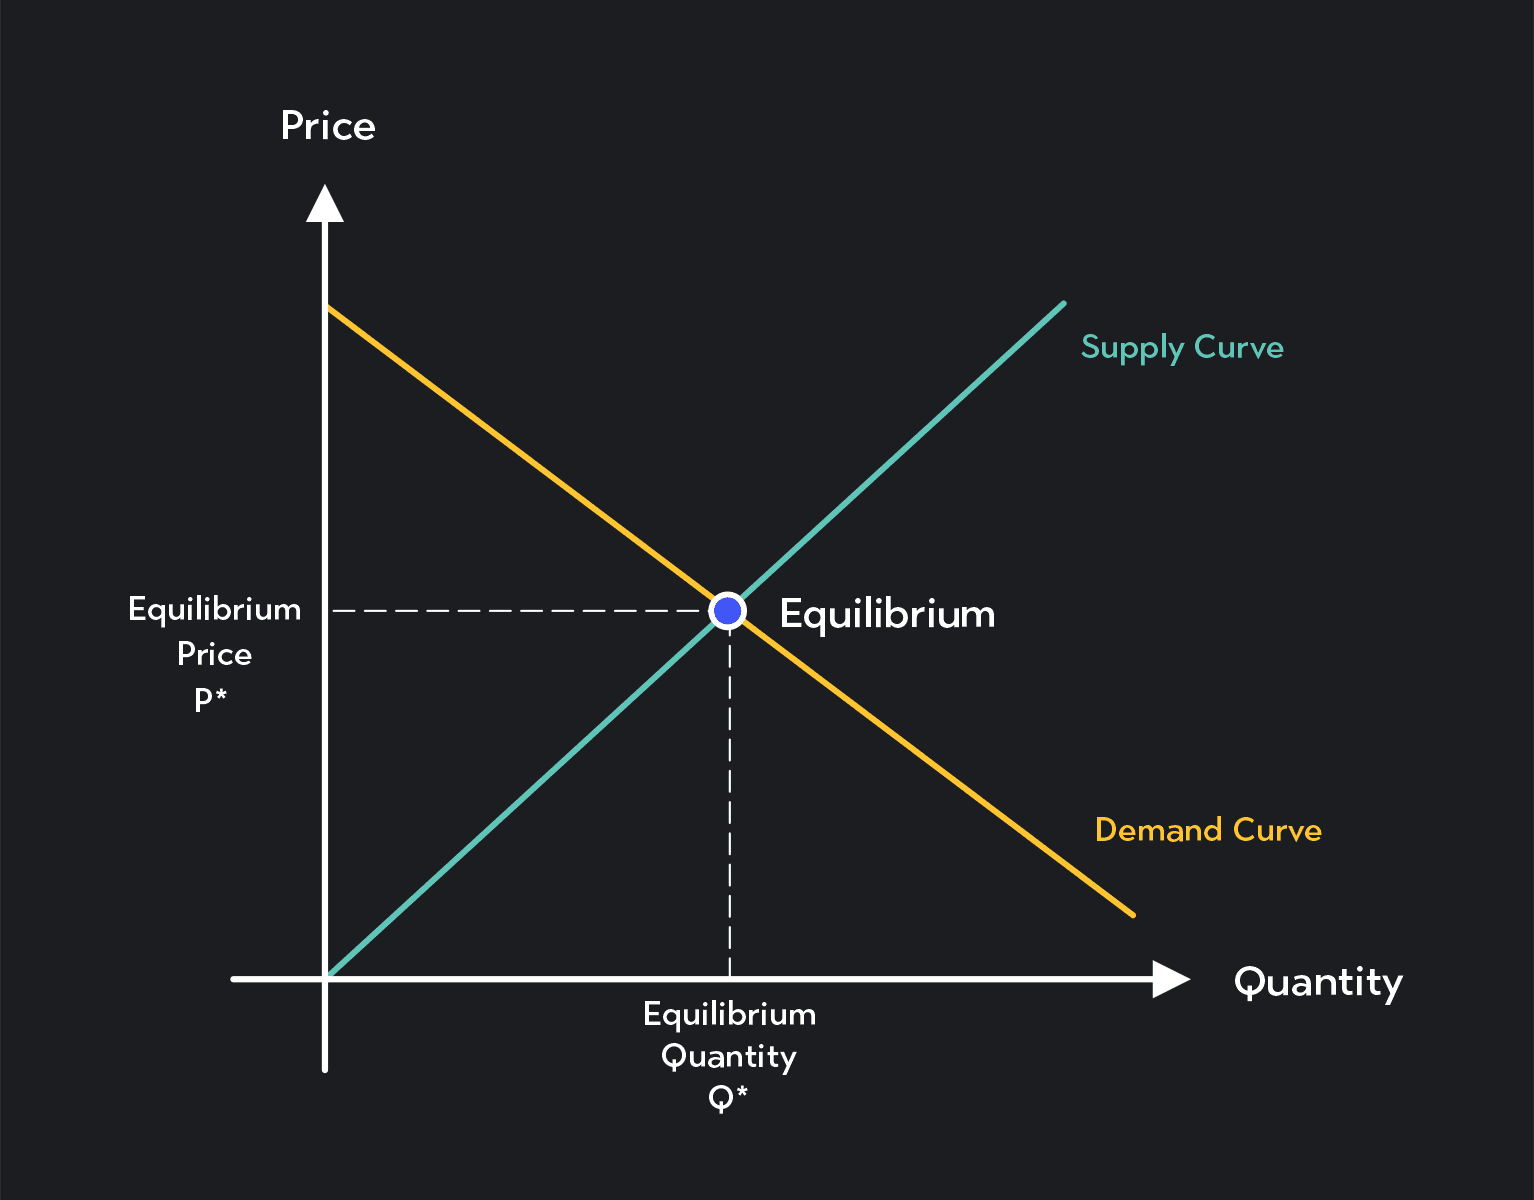
Under these assumptions, the market will gravitate toward a competitive market equilibrium where supply equals demand. This equilibrium occurs at the intersection of the supply and demand curves. The equilibrium is associated with an equilibrium price, P*, and an equilibrium quantity, Q*.
Surpluses and Shortages
To understand why price and quantity move toward the equilibrium, consider what happens when the price is above or below the equilibrium price.
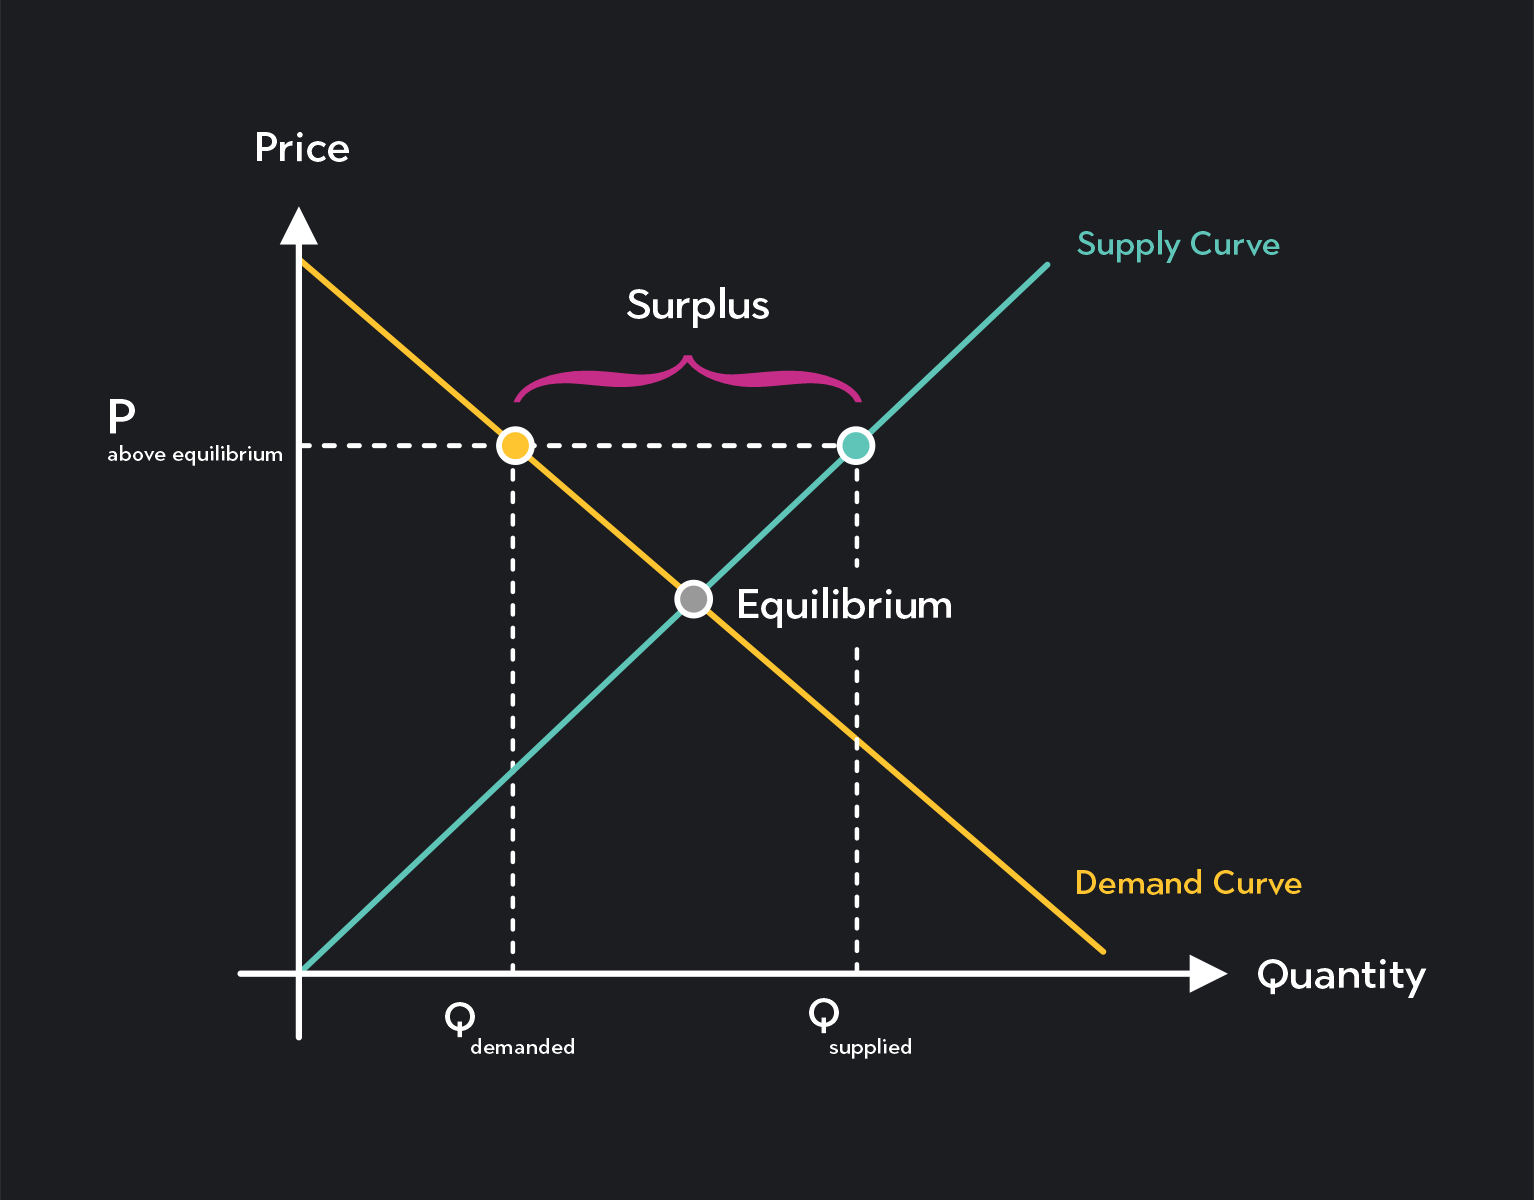
When the price is above equilibrium, the quantity sellers would like to produce exceeds the quantity consumers demand. There will be a surplus (or excess supply) of goods in the market.
If this is the case, sellers can’t sell all the goods they produce and will start cutting prices to attract more buyers. As a result, the market price will gradually fall, and the gap between quantity demanded and quantity supplied will get narrower and narrower until the quantities are equal.
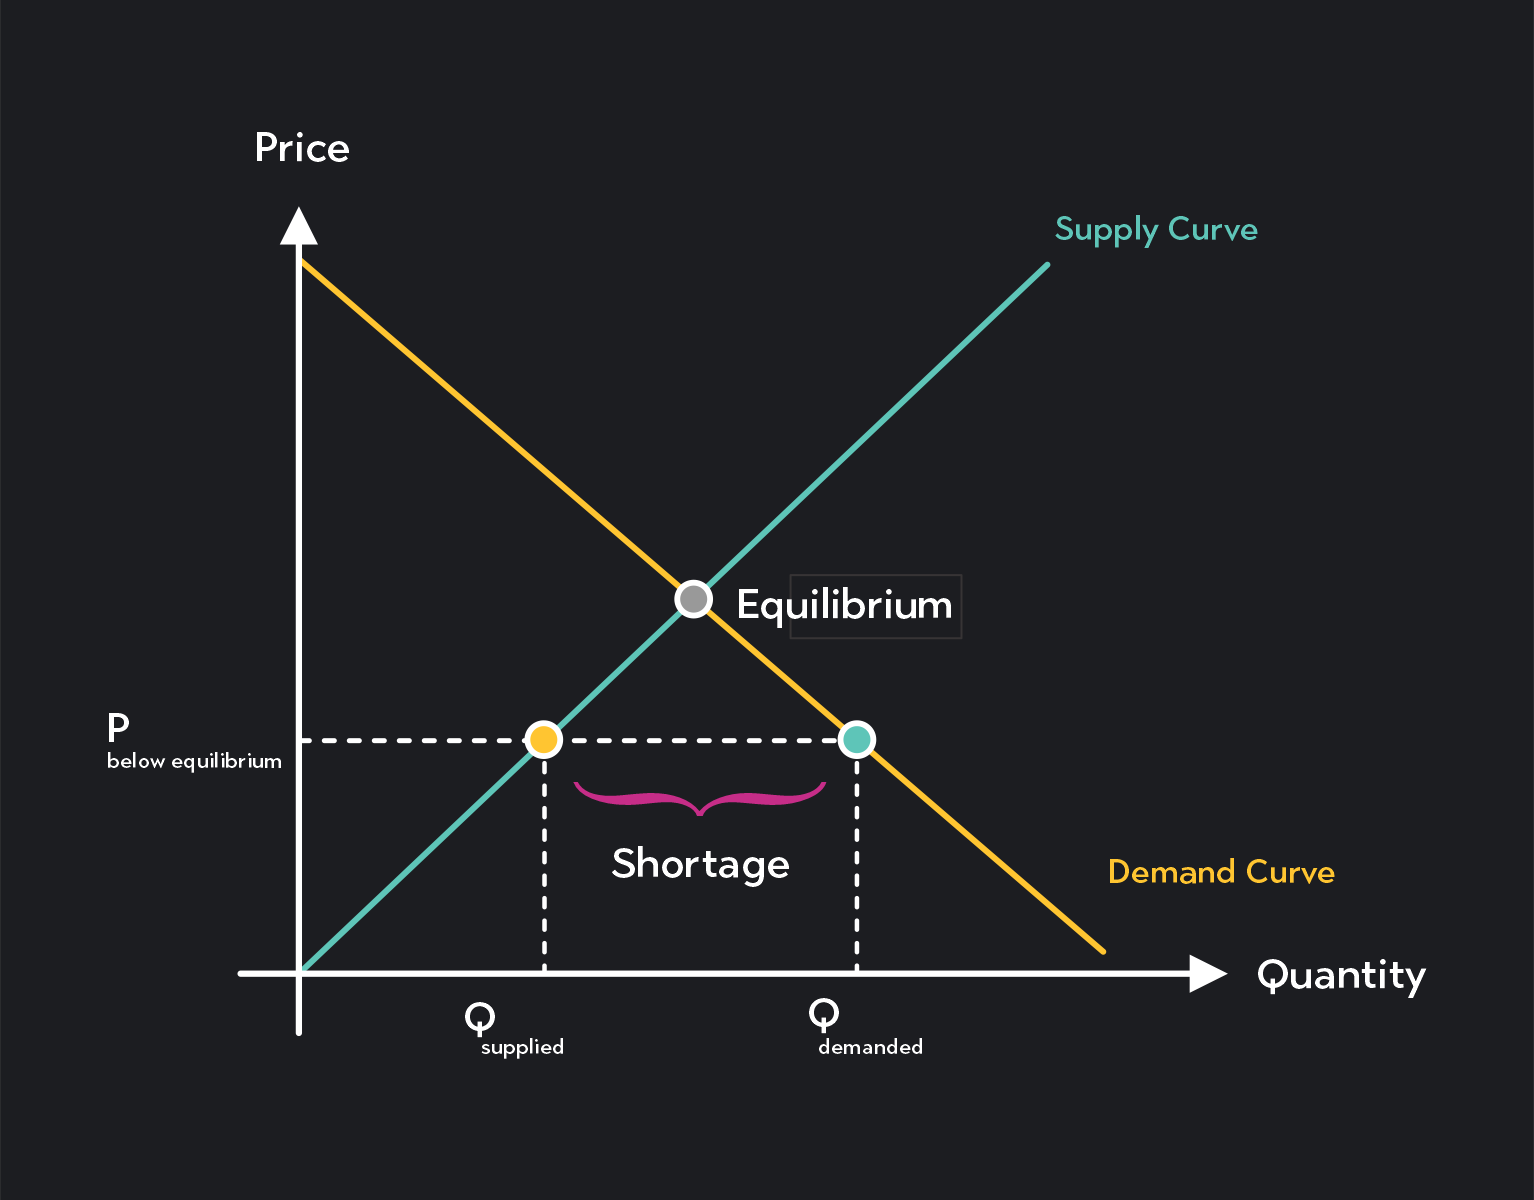
What about when the price is below equilibrium? When the price is below equilibrium, the quantity supplied by sellers is less than the quantity demanded by consumers. This means there is a market shortage (or excess demand). Some buyers who want to make a purchase will not be able to.
When this is the case, eager and desperate buyers will start offering to purchase the good being sold at a higher price than what sellers have priced it at. As a result, the market price gradually increases. Quantity supplied and quantity demanded move closer together until they are equal.
In either of these cases, the market adjusts toward equilibrium. Once the market is in equilibrium, the equilibrium price and quantity will not change unless some external factor causes the entire supply or demand curve to shift.
Shifts in Demand and Supply
A shift of the demand curve represents an increase or decrease in demand at every single price. Similarly, a shift in supply represents an increase or decrease in quantity supplied at every price.
There are four ways that supply and demand curves can shift:
The supply curve shifts to the right (supply increases)
The supply curve shifts to the left (supply decreases)
The demand curve shifts to the right (demand increases)
The demand curve shifts to the left (demand decreases)
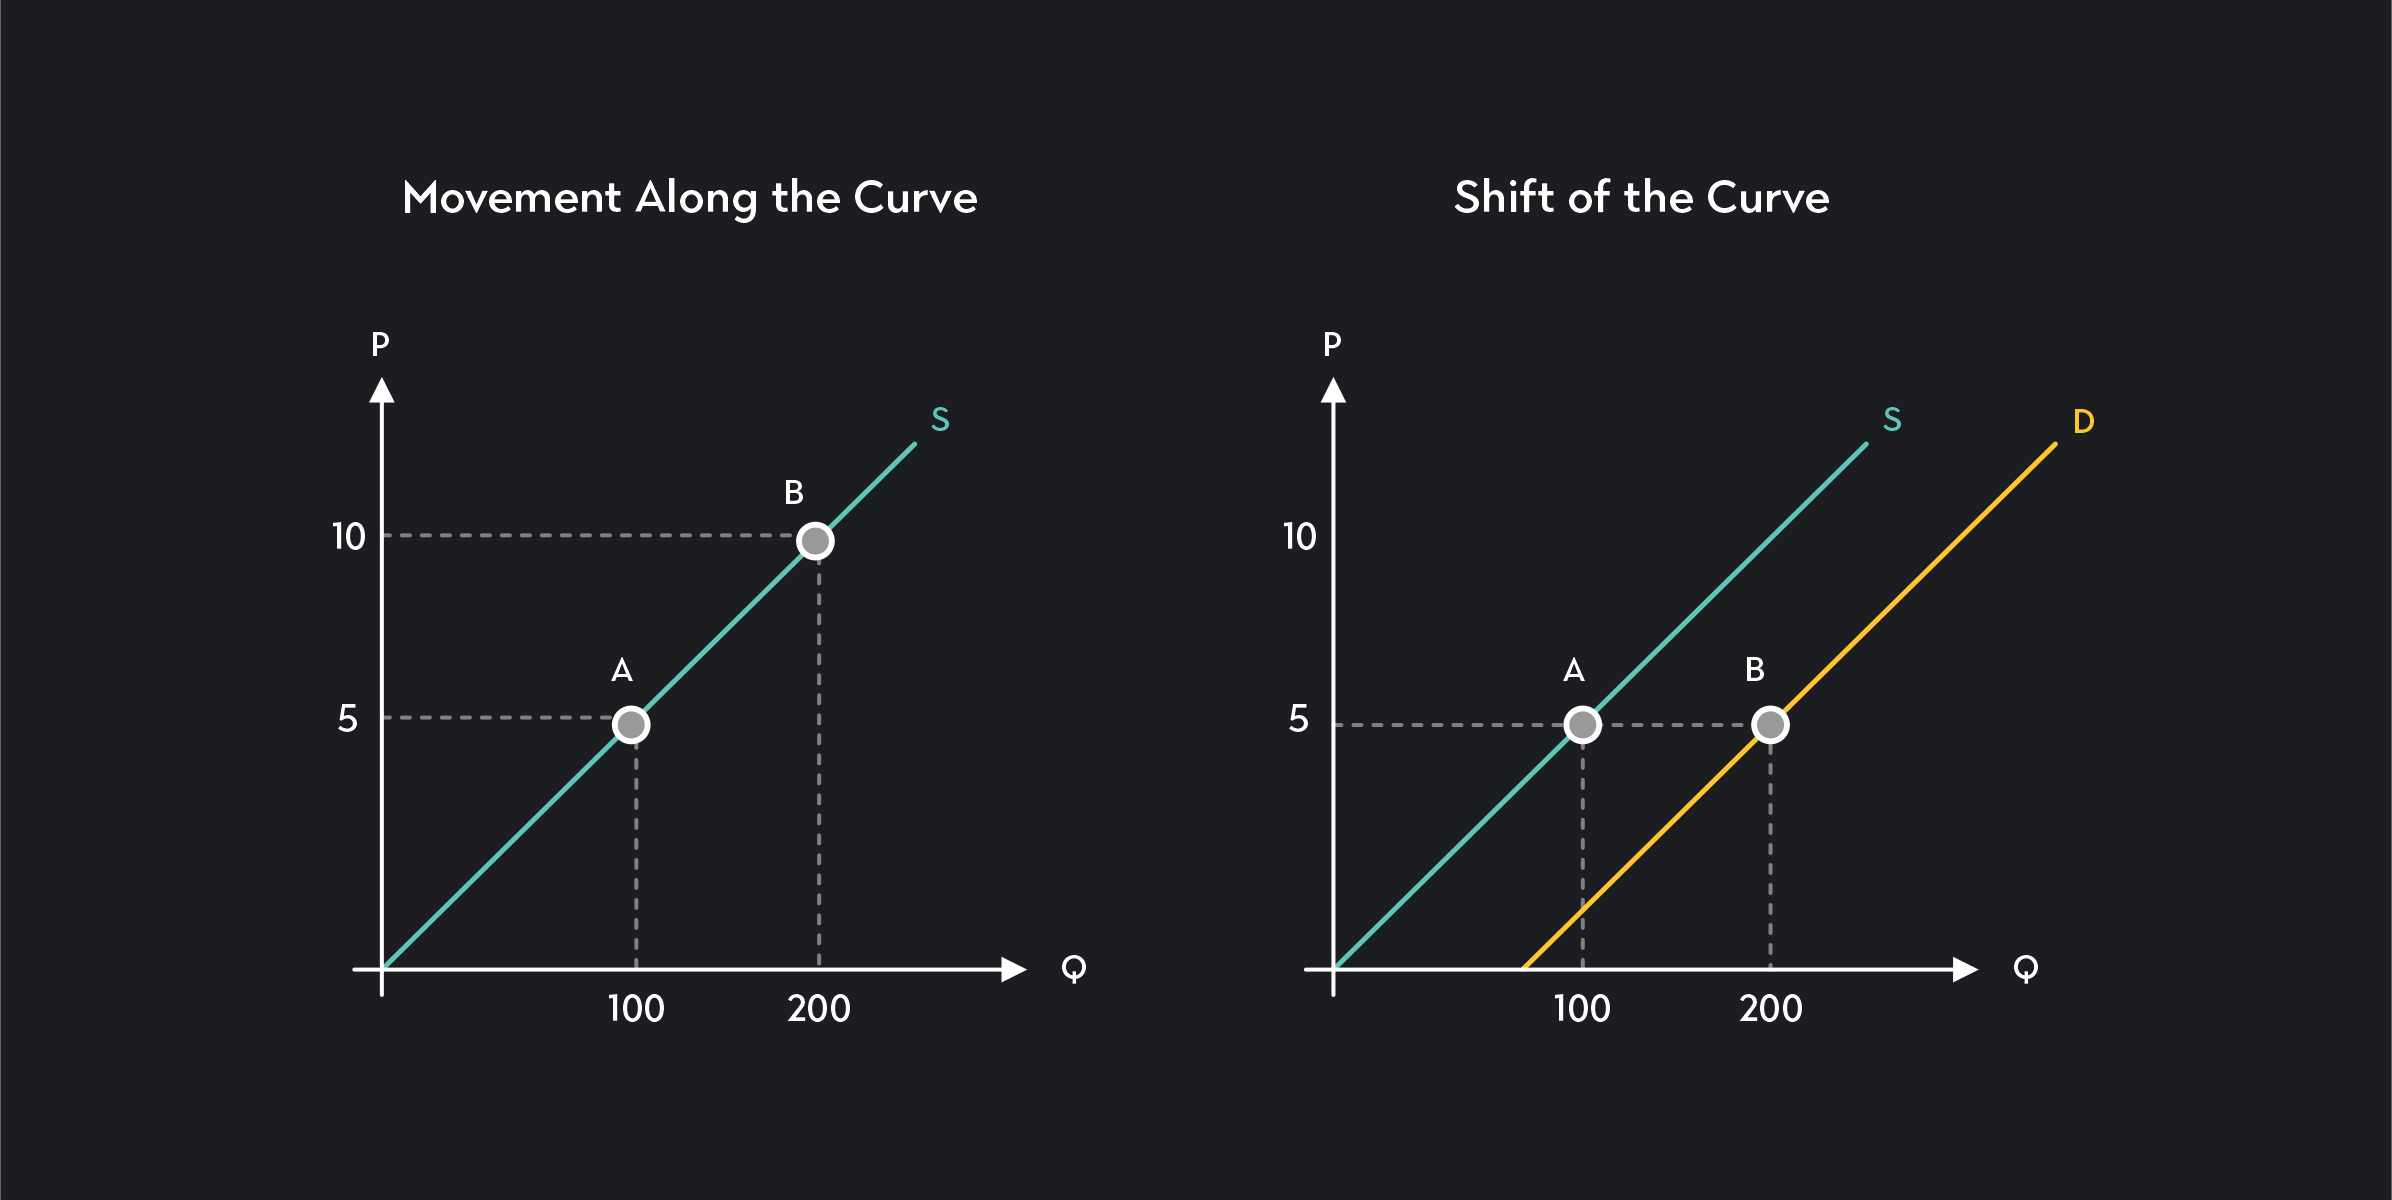
Shifts in Demand and Supply vs Movement
A shift of the supply or demand curve is distinct from movements along the supply or demand curve. A curve shift represents an overall increase or decrease at every price point. In contrast, a movement along the curve represents a change in quantity demanded or supplied as the price increases or decreases.
Factors That Cause Demand and Supply Curves To Shift
The main factors that cause supply and demand curves to shift are below. These are not the only factors that can shift supply and demand, but they are the causes that are most frequently observed.
Six main causes of supply shifts:
A change in the price of related goods or services
A change in input prices (inputs are the materials and resources used to produce the good)
Technological innovations or disruptions that improve or hinder the production process
Natural events such as bad weather, wars, and pandemics
The number of sellers in the market
Expectations about the future
Five main causes of demand shifts:
Changes in consumer preferences
Changes in consumer income
Changes in the demographics of consumers
Changes in the price of related goods (goods that are substitutes or complements)
Changes in expectations about the future
5 Steps To Predict Changes in Equilibrium Price and Quantity
When something causes supply or demand to shift, how are the equilibrium price and quantity impacted? You can answer this question in five steps.
Step 1. Start by drawing a basic supply and demand model
The first step in any supply and demand analysis is to draw out the supply and demand diagram.
Step 2. Does the event affect supply or demand?
Next, you need to determine whether the event you’re analyzing affects supply or demand.
For this example, let’s suppose that a labor strike affects the number of packages a delivery company can deliver in a day. Labor is an input in the production of package deliveries, so the strike will affect the supply side of the market.
Step 3. Does the event lead the curve to shift right or shift left?
As you consider whether supply or demand is affected, you also need to consider how it is affected. Will the curve shift to the left, which indicates a decrease? Or will it shift to the right, which indicates an increase?
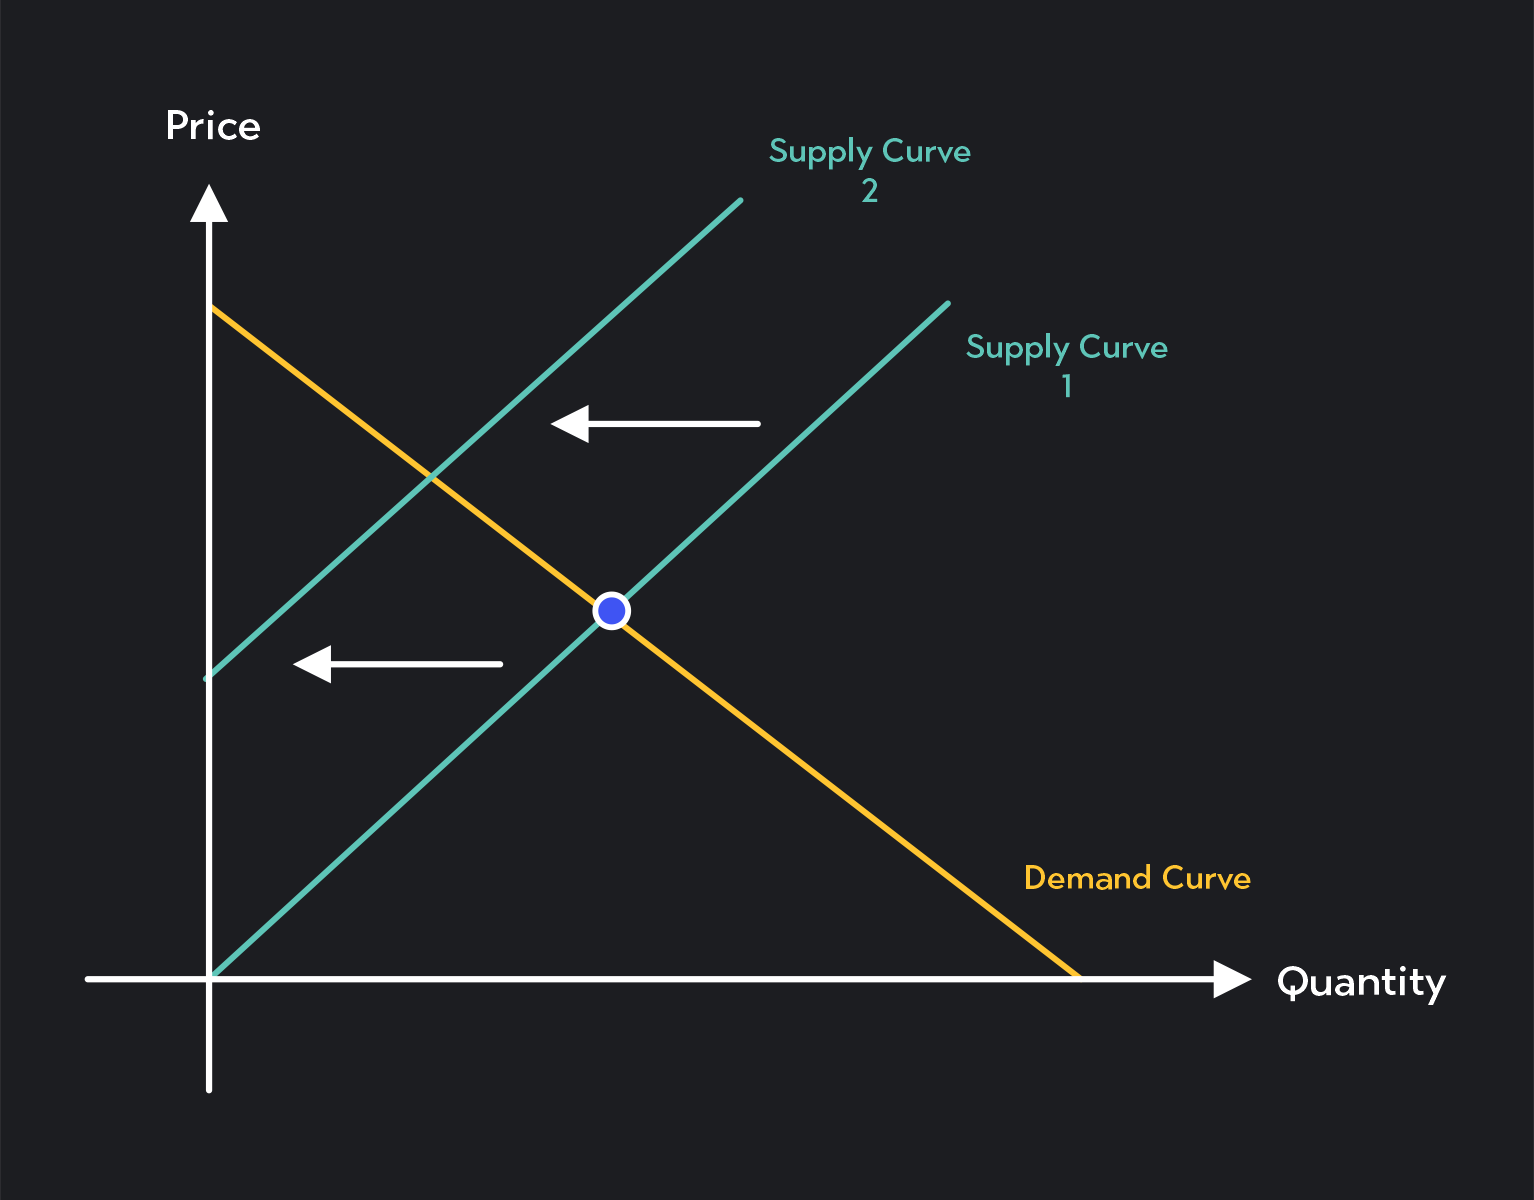
If workers go on strike, fewer workers will be available to deliver packages. Therefore, in this case, supply will decrease and shift to the left.
Step 4. Draw the shift of the curve in your supply and demand diagram
Now that you know which side of the market is affected and how, add the new (shifted) curve to your supply and demand model.
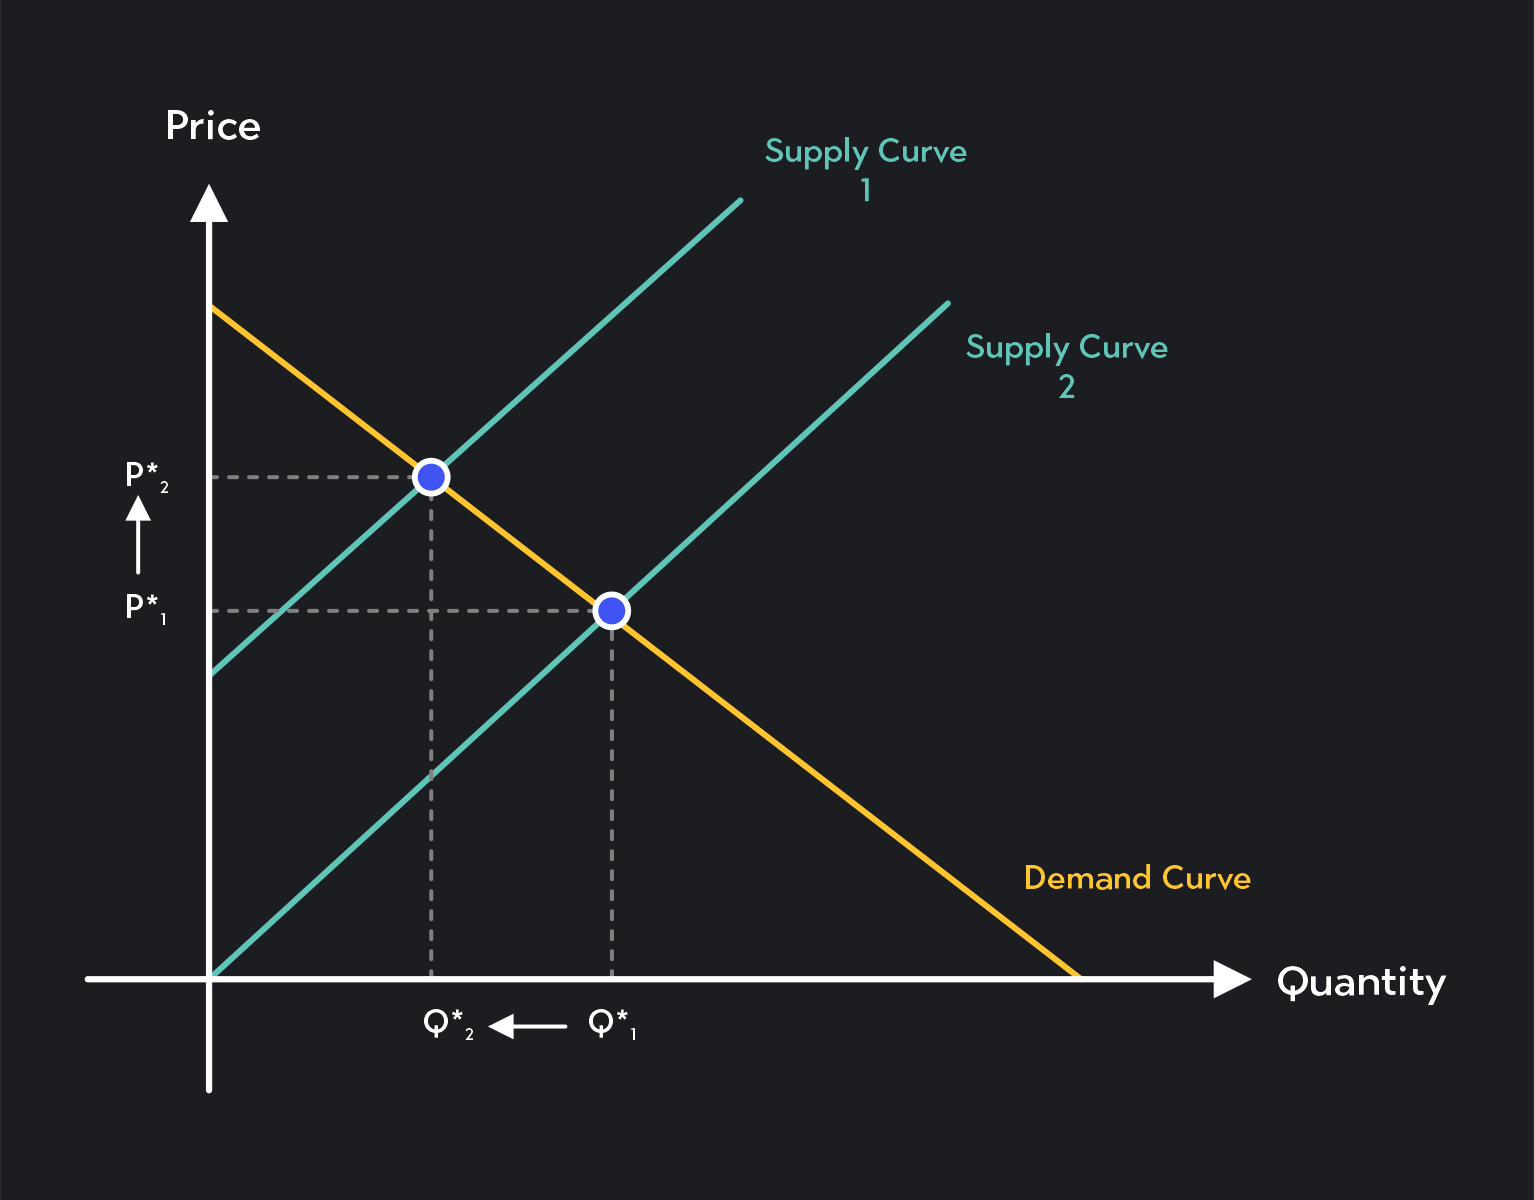
Step 5. Identify the new equilibrium point and compare it to the initial equilibrium
All that’s left to do is to look for the new equilibrium price and quantity and compare it to the original equilibrium price and quantity.
In this example, the new equilibrium is the intersection of the original demand curve and the shifted supply curve (Supply Curve 2). The new equilibrium price is higher than the original equilibrium price, and the new equilibrium quantity is lower than the original equilibrium price.
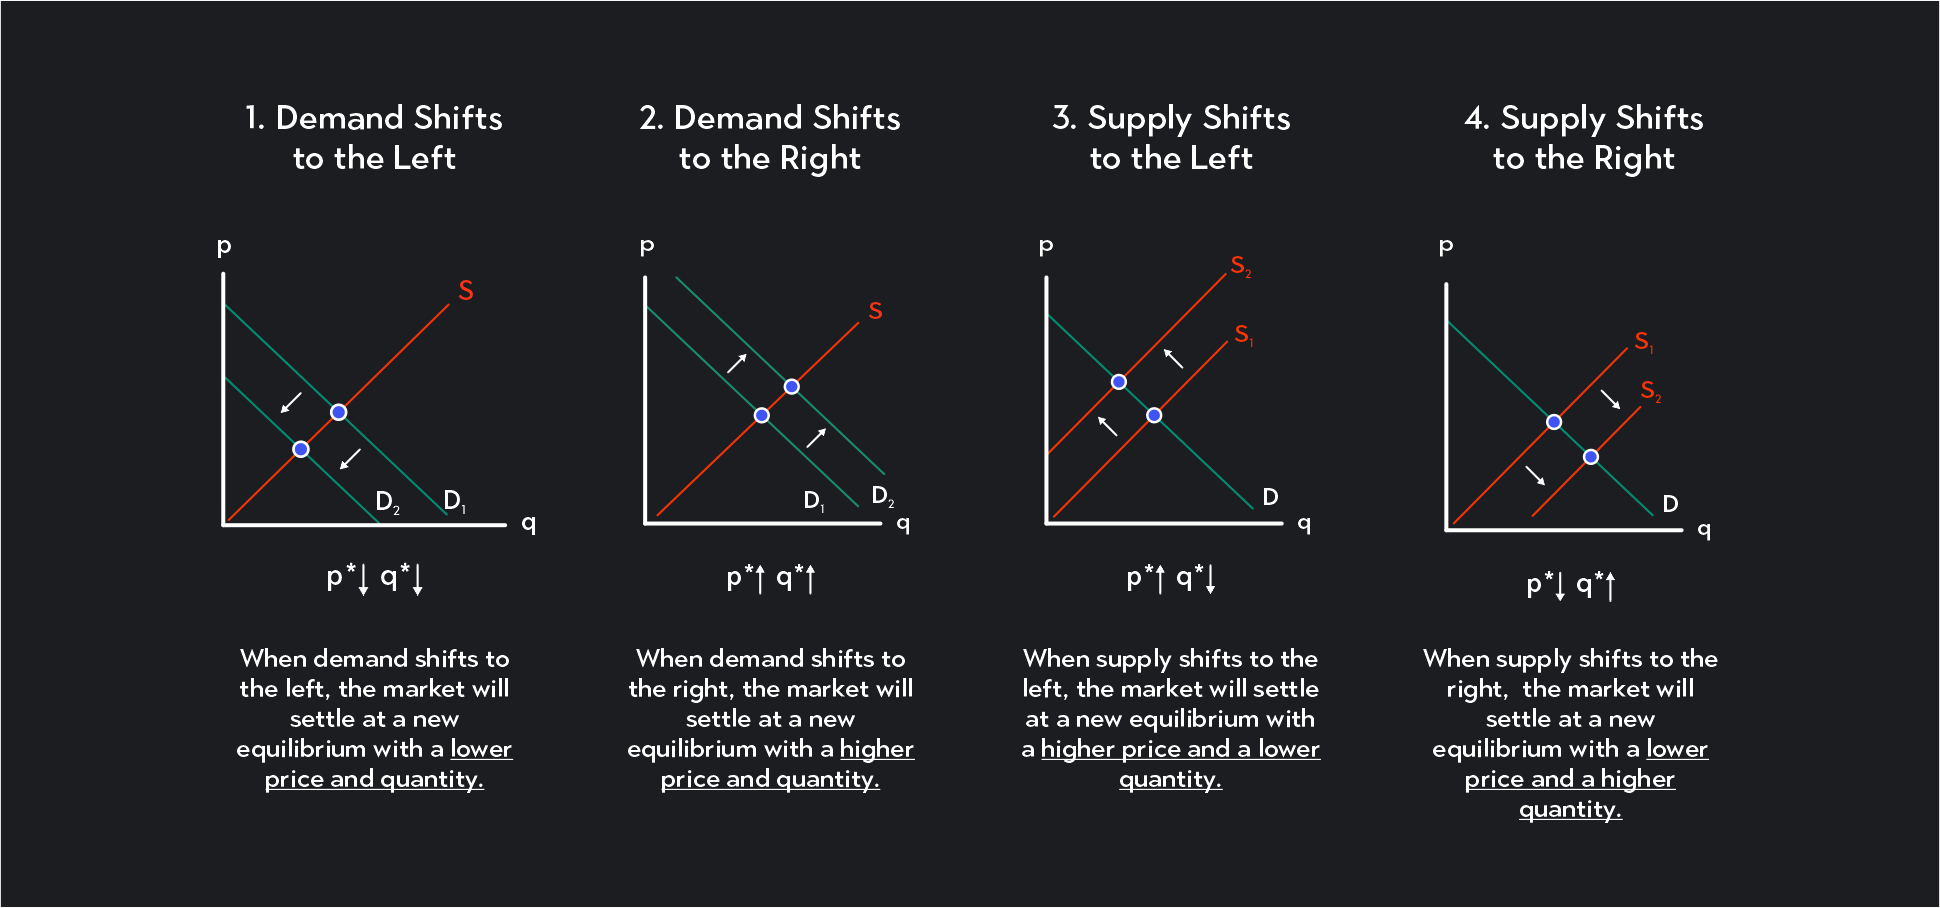
Summary of How Supply and Demand Shifts Impact Equilibrium
In the example above, we showed how a decrease in supply resulted in a higher equilibrium price and a lower equilibrium quantity. The figures below show how the other types of shifts affect the equilibrium quantity and price.
Predicting Changes When Both Supply and Demand Shift
We’ve analyzed so far when either supply or demand shifts. But what happens when a shift in supply occurs together with a shift in demand?
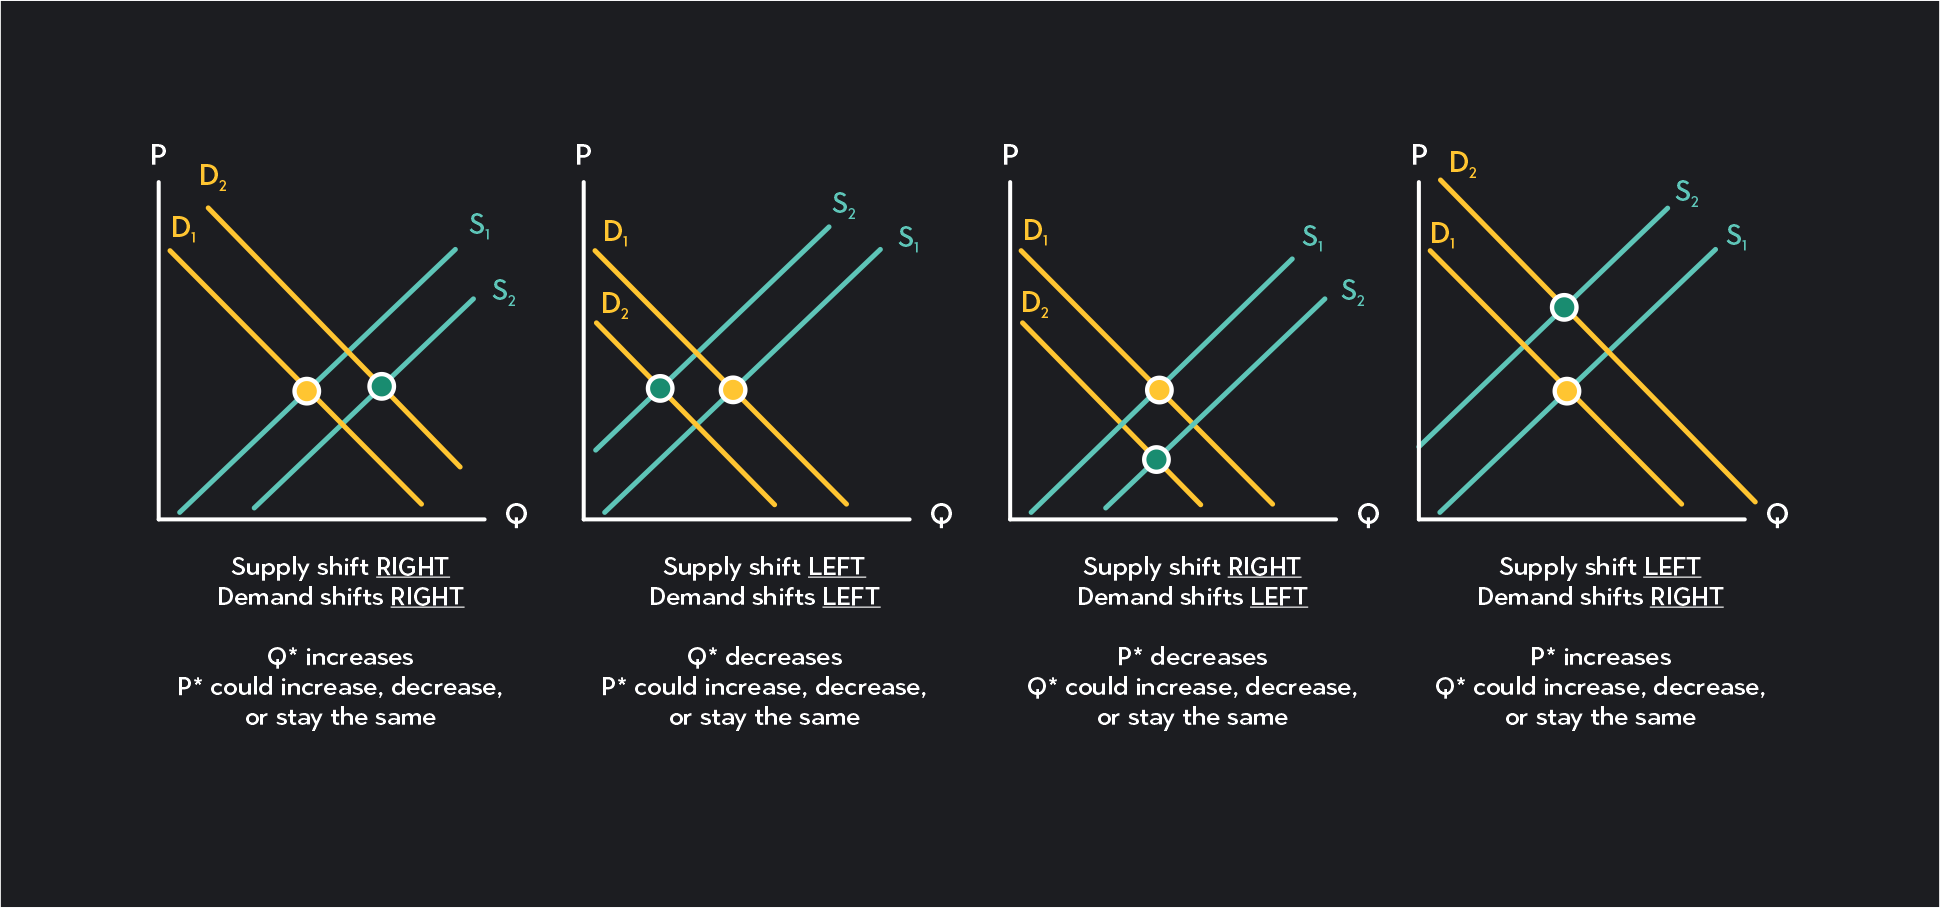
There are four combinations of how the supply and demand curves can shift simultaneously. You can see these in the figure below:
You’ll see from these figures that when both curves shift in the same direction (to the right or to the left), there is an unambiguous change in the equilibrium quantity. The effect on price, however, can’t be determined unless you know the magnitude (or size) of each shift. This is because an increase in supply puts downward pressure on price, while an increase in demand puts upward pressure on price. Similarly, a decrease in supply puts upward pressure on price, while an increase in demand puts downward pressure on price.
When supply and demand curves shift in opposite directions, one to the right and one to the left, the effect on price is unambiguous, but the effect on quantity depends on the magnitude of each shift.
As a result, when dealing with shifts of both curves, you will always be able to determine the effect on either price or quantity, but you cannot assess the impact on both price and quantity without knowing how large each shift is.
Practice Questions
In each of these questions, assume that the market is perfectly competitive.
Question 1
Suppose a city builds a pedestrian and bike-friendly walkway that loops around the entire metropolitan area, linking several of the city’s largest neighborhoods. All else being equal, how will this impact the market for taxi and rideshare services in the metropolitan area?
Answer: In this scenario, more people will start walking and biking to their destinations, so the demand for taxi and rideshare services will decrease (shift to the left). Both the equilibrium price and quantity will decrease.
Question 2
Suppose chia seeds suddenly become popular due to a string of viral videos showing celebrities making chia seed pudding. All else being equal, how would this affect the market for chia seeds?
Answer: In this scenario, the viral videos increase consumer preferences for chia seeds so that the demand curve will shift to the right. Both the equilibrium price and the equilibrium quantity will decrease.
Question 3
Suppose the outbreak of a war causes the destruction and closure of many of the world’s largest wheat farms. All else being equal, how will this impact the wheat market?
Answer: In this scenario, the number of wheat suppliers will fall, which will cause a decrease in supply. The supply curve will shift to the left, resulting in a higher equilibrium price and lower equilibrium quantity.
Question 4
Suppose a new technological breakthrough allows companies to produce residential solar panels at half the cost. All else being equal, how will this affect the market for residential solar panels?
Answer: The technological innovation reduces the cost of producing solar panels, so supply will shift to the right. The equilibrium price will fall, and the equilibrium quantity will increase.
Question 5. Suppose the number of chia seed farmers increases at the same time that a year-long chia seed fad fades. All else being equal, how will these two changes impact the market for chia seeds?
Question 5
Suppose the number of chia seed farmers increases at the same time that a year-long chia seed fad fades. All else being equal, how will these two changes impact the market for chia seeds?
Answer: This scenario combines an increase in supply with a decrease in demand. Equilibrium price will definitely decrease, but the impact on the equilibrium quantity depends on which change is greater. The equilibrium quantity will increase if the rightward shift in supply is greater than the leftward shift in demand. However, if the shift in demand is greater than the shift in supply, equilibrium quantity will fall.
Do you now better understand the headlines you see in the news? What else can you find that supply and demand can explain?
Explore Outlier's Award-Winning For-Credit Courses
Outlier (from the co-founder of MasterClass) has brought together some of the world's best instructors, game designers, and filmmakers to create the future of online college.
Check out these related courses: