
Economics
5 Things That Can Shift a Demand Curve
This article is a comprehensive guide on the causes for a demand curve to change. Included are five common demand shifter examples.
Mendy Wolff
Subject Matter Expert
Economics
07.01.2022 • 8 min read
Subject Matter Expert
This article explains what equilibrium means in microeconomics. Learn what equilibrium looks like in the economic model of supply and demand under perfect competition.
In This Article
Have you ever stopped to consider why the price of soda is $2.50 and not $1 or $10? Who decides the cost? The U.S. government doesn’t. Yet, as of June 2022, soda companies have set around $2.50 as the right price for a 2-liter soda bottle. But why?
Let’s uncover pricing more and its relation to equilibrium.
In economics, equilibrium is the balanced state of a model. It describes a point where all forces described by the model are in balance. A model only deviates from equilibrium if a change disrupts its steady state.
In introductory microeconomics, you will encounter equilibrium in:
The supply and demand model for perfectly competitive markets
The monopolist’s market model
Game theory models
In introductory macroeconomics, you will encounter equilibrium in:
Labor market models
The aggregate demand and aggregate supply model
Models of interest rates and money supply
Game theory models
We’ll look at only one of these.
Let’s inspect equilibrium in supply and demand under perfect competition.
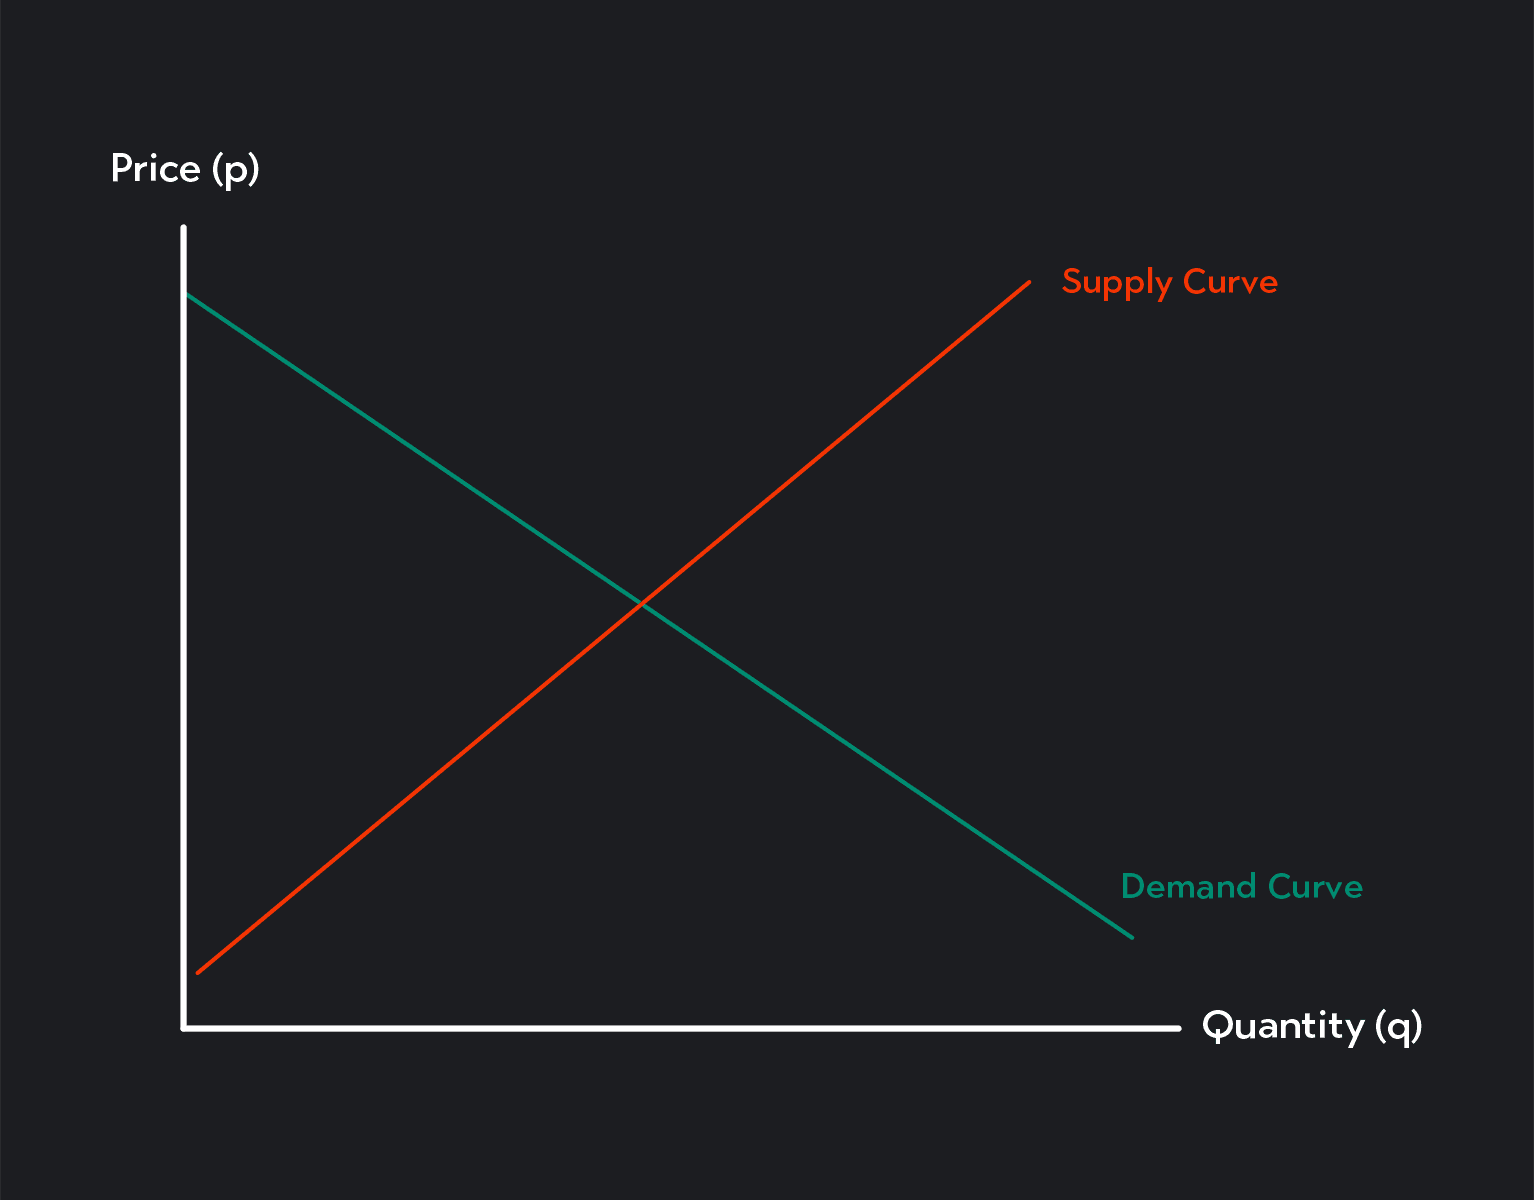
In a supply and demand model, there are two economic forces at play: supply and demand.
Supply is the number of goods or services that producers are willing to sell at different prices.
An upward-sloping line or curve represents supply. The supply curve slopes upward due to the law of supply. This is when producers are willing to supply more of their product at higher prices and less at lower prices.
Demand is the number of goods or services that consumers are willing to buy at those prices.
A downward sloping line or curve represents demand. The demand curve slopes downward due to the law of demand. This is when consumers are generally willing to buy less of a good at higher prices and more at lower prices.
Competitive equilibrium is another name for the equilibrium in perfect competition. You may also hear it called “market equilibrium.”
Where does equilibrium occur in a perfectly competitive supply and demand model? It occurs where the supply and demand curves intersect.
Supply equals demand at this point.
In this model, the equilibrium represents an efficient allocation of goods.
Two key terms to note: consumer surplus and producer surplus. Consumer surplus refers to consumer benefits in the market. Producer surplus refers to producer benefits in the market. At equilibrium, both are maximized.
Not all equilibria have this characteristic though.
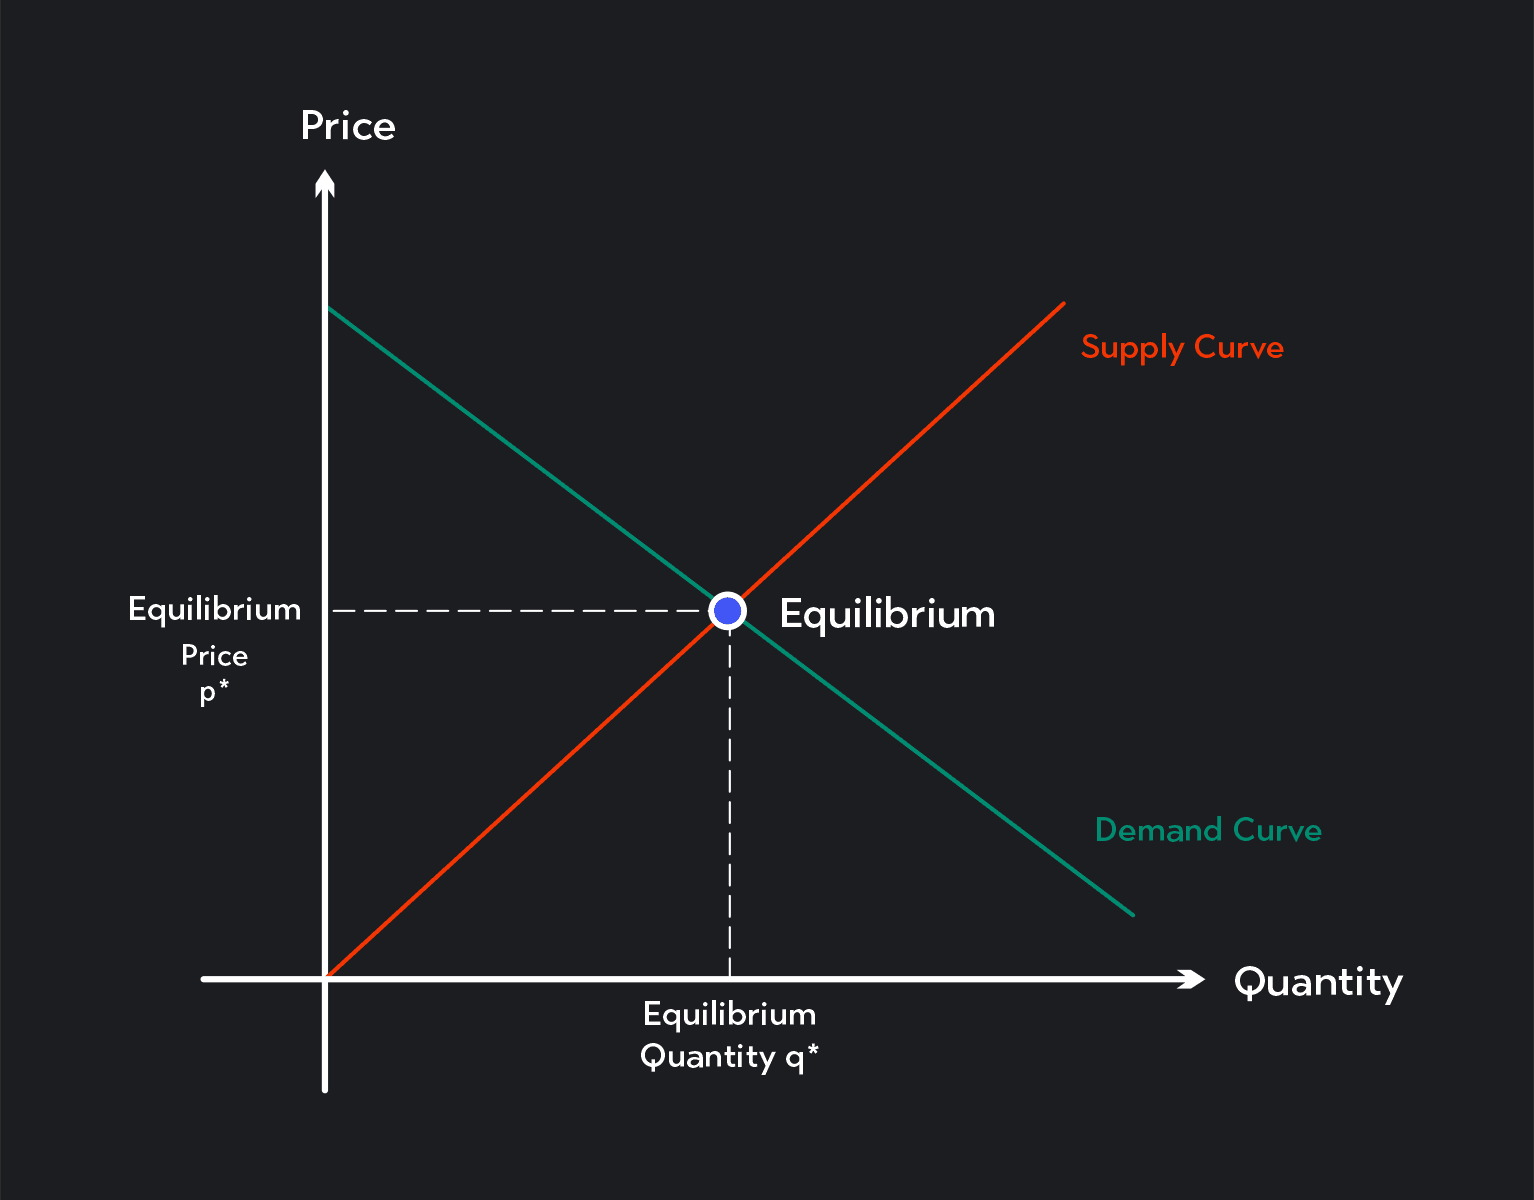
In the graph, p* is the equilibrium price or market-clearing price. The q* is the equilibrium quantity or market-clearing quantity.
Why is the intersection of supply and demand an equilibrium? Consider whether the sellers or buyers in a market have any incentive to change their behavior when the market is in equilibrium.
When supply is equal to demand, every seller in the market can find a buyer. Likewise, every ready-to-spend consumer will find a seller. The market forces of supply and demand are in balance. For any other price offered in the market, this is not the case.
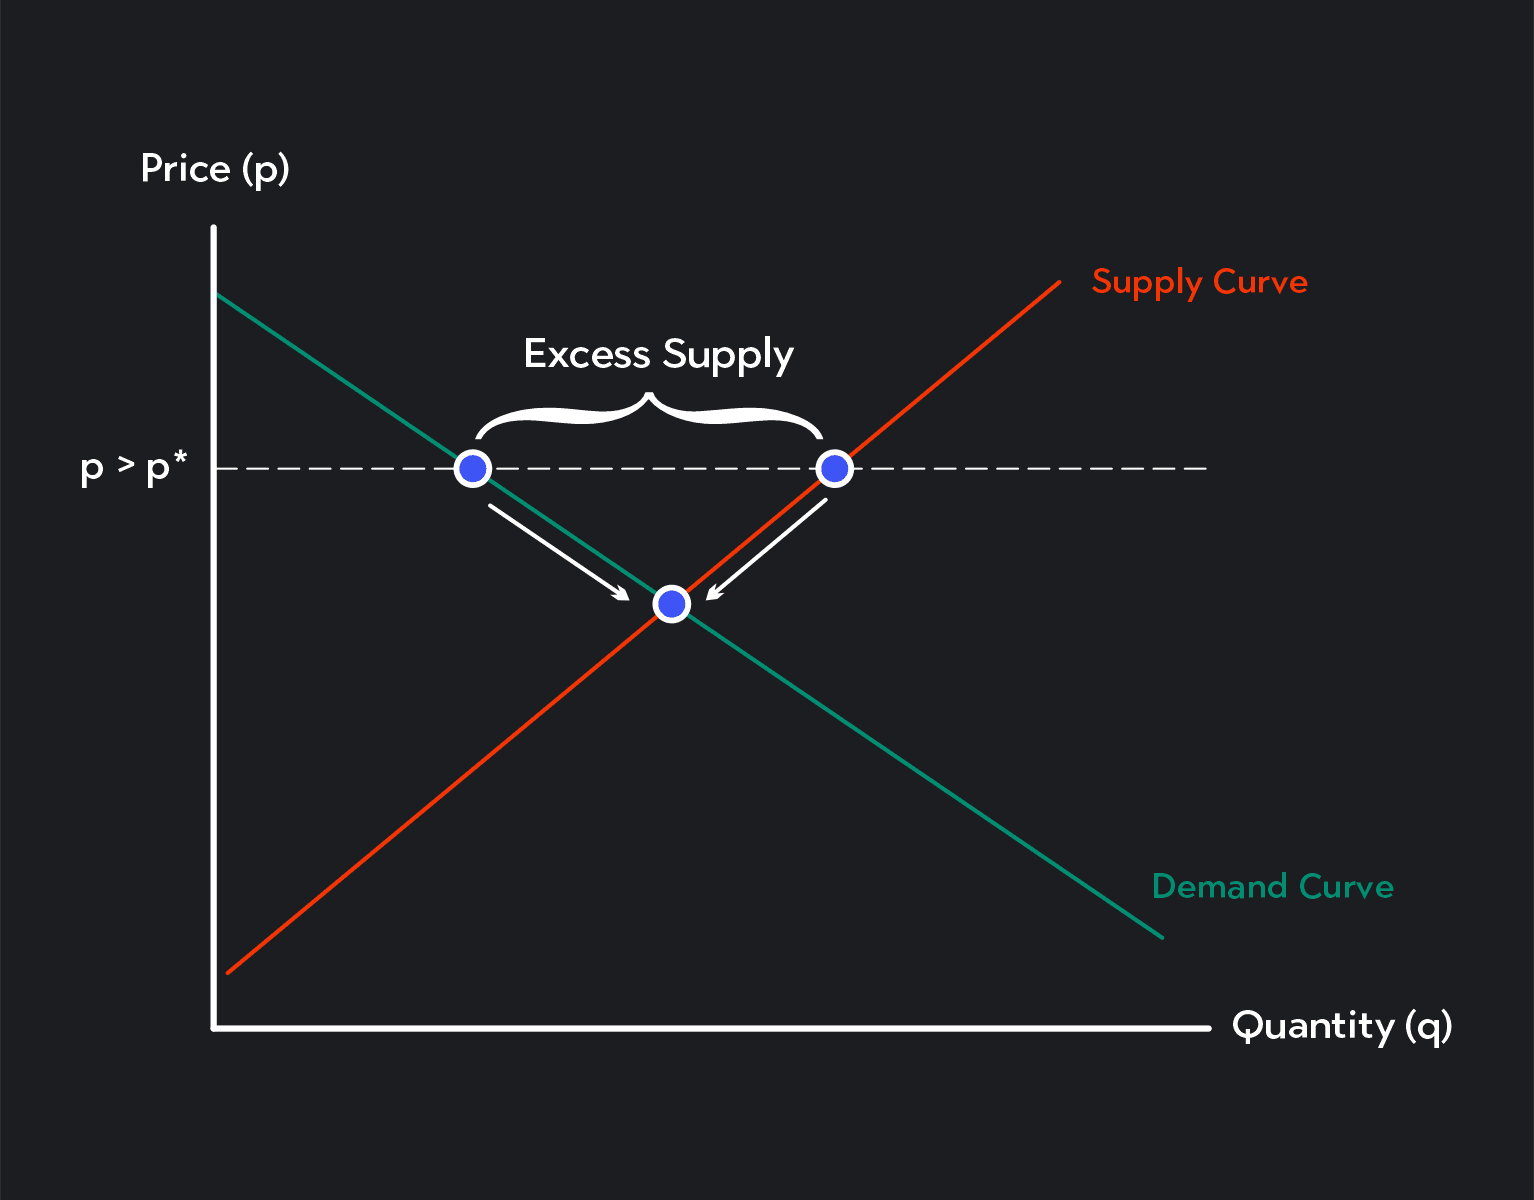
At prices above the equilibrium, the quantity that sellers want to supply exceeds the quantity that consumers demand. The market is in a state of disequilibrium. A subset of sellers will not find buyers for some or all of their products. As a result, these sellers will either leave the market or reduce the quantity they produce. The market price and the quantity supplied will fall until the point where supply is equal to demand. This point is equilibrium.
At prices below the equilibrium, the number of goods that consumers demand will exceed the quantity of goods suppliers want to supply. There will be buyers in the market competing for a limited supply of goods. This puts upward pressure on prices. Higher prices will encourage new sellers to enter the market and existing suppliers to ramp up production. The market price and the market quantity supplied will keep increasing until they reach equilibrium.
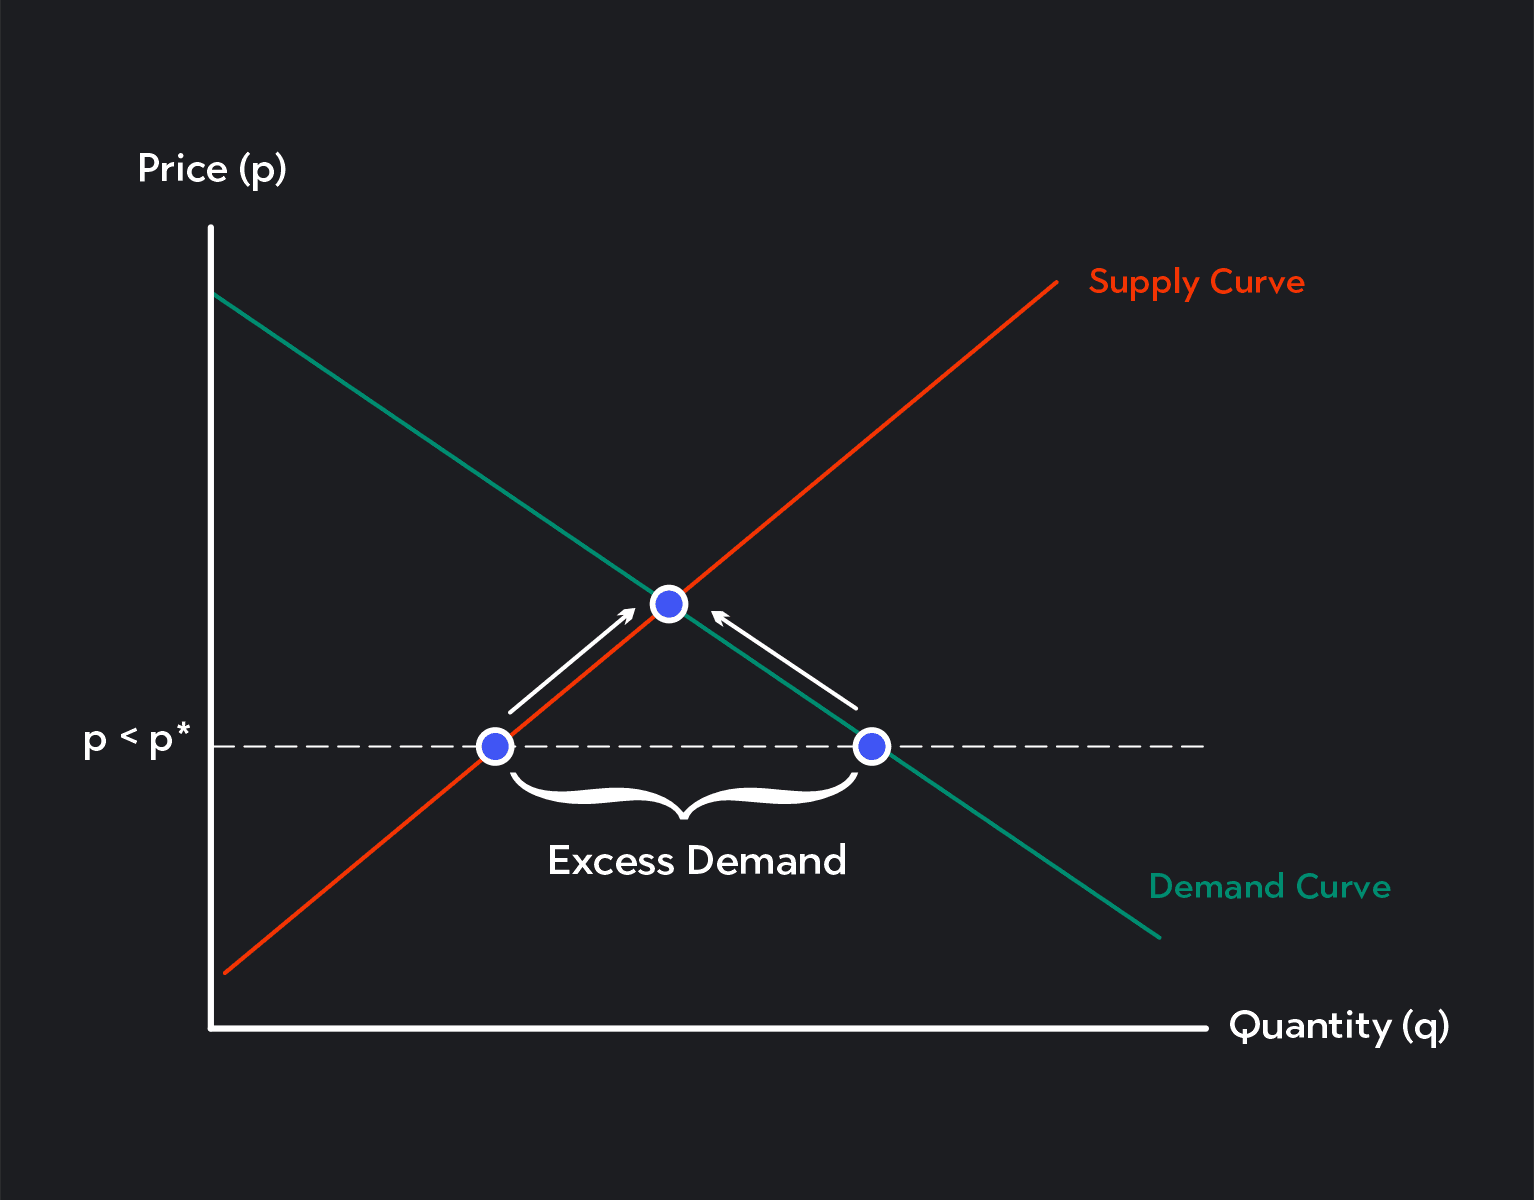
Perfectly competitive markets will stay in equilibrium. But for how long? A change in supply or demand can temporarily throw the market out of equilibrium and into a state of disequilibrium. Given some time, the market recalibrates and settles at a new equilibrium price and quantity.
Let’s take a look at how these types of changes occur.
A leftward shift of the demand curve represents an overall decrease in demand. At any given price, consumers will demand fewer goods than they did before the shift. This kind of change can occur for reasons including:
A change in consumer preferences
A drop in the price of substitute goods
An increase in the price of complementary goods
Changing expectations about the future
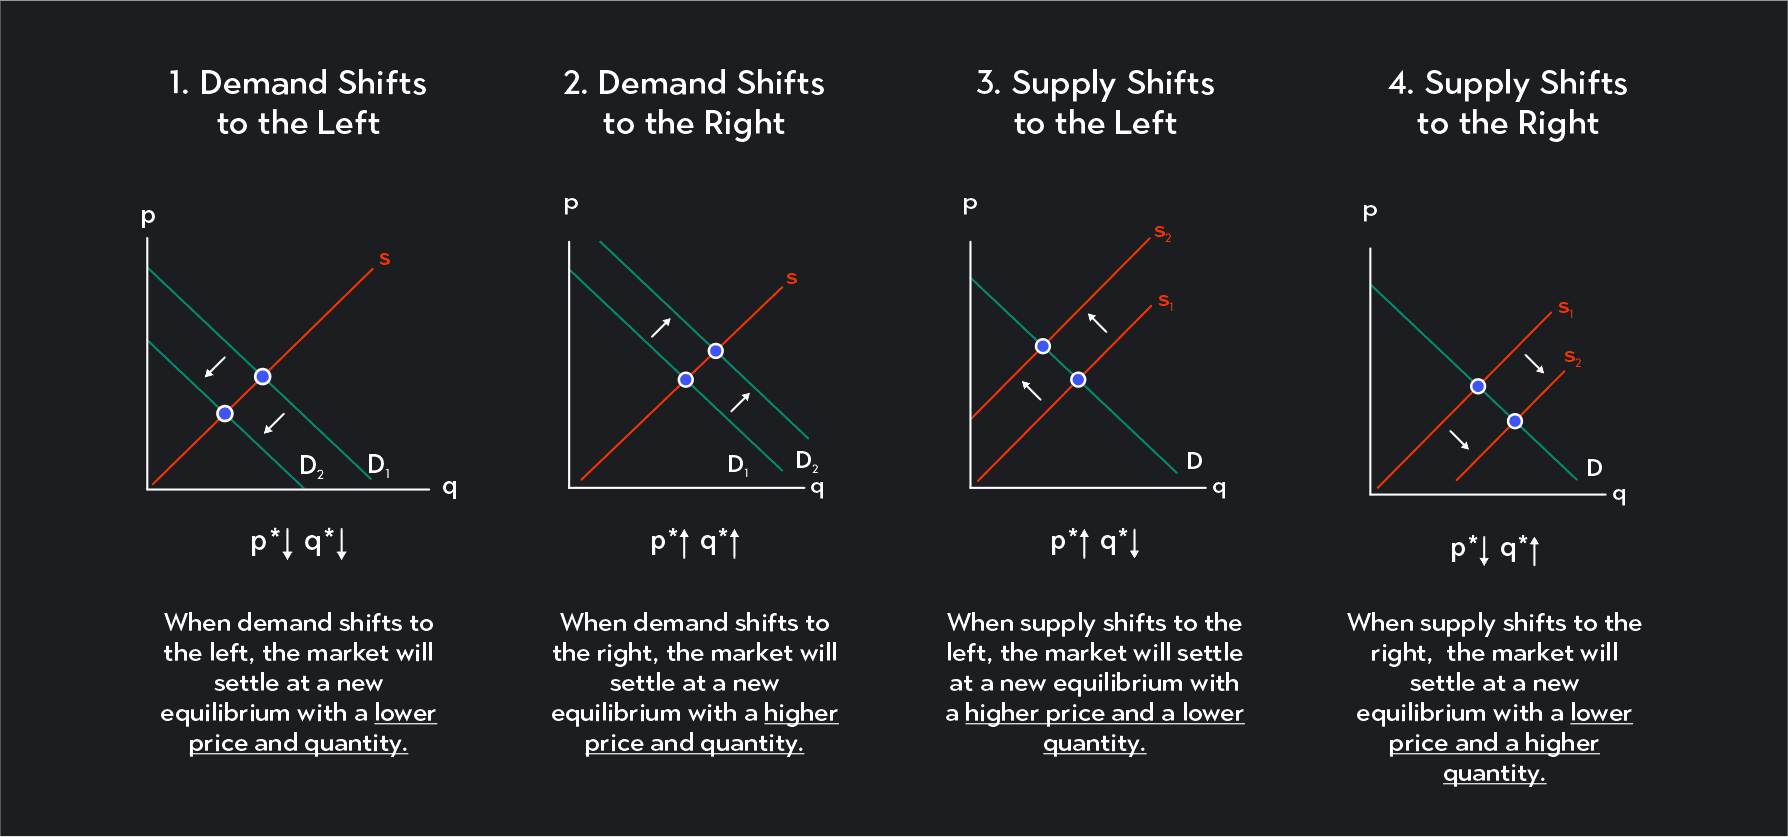
When demand shifts to the left, the market temporarily falls out of equilibrium. That’s because consumers want fewer goods than the quantity supplied by sellers. Over time, suppliers will reduce the quantity they supply in response to lower demand. The market will settle at a new equilibrium with a lower market-clearing price and a lower market-clearing quantity.
A rightward shift of the demand curve represents an overall increase in demand. At any given price, consumers will demand more goods than they did before the shift. An outward shift in demand can occur for reasons including:
Growing popularity of the good being sold
An increase in the price of substitute goods
A decrease in the price of complementary goods
Changing expectations about the future
When demand shifts to the right, the market temporarily falls out of equilibrium. That’s because consumers want more goods than sellers are willing to sell. Over time, suppliers adjust to the increase in demand by ramping up production and supplying a larger quantity of goods at higher prices. Price and quantity in the market continue to rise until supply is equal to demand once again. The new equilibrium occurs at a higher market-clearing price and a higher market-clearing quantity.
A leftward shift of the supply curve represents an overall decrease in supply. At any given price, suppliers will want to supply fewer goods than they did before the shift. This kind of change can occur for reasons including:
A negative shock that affects the production of goods
Stricter regulations or higher taxes
An increase in the cost of inputs used in the production of the good
When supply shifts to the left, the market temporarily falls out of equilibrium. That's because sellers now want to supply fewer goods than consumers want to buy. The competition among consumers for a limited supply of goods will push prices up. As prices increase, the quantity demanded will fall. Eventually, the market settles at a new equilibrium where the market-clearing price is higher. Also, the market-clearing quantity of goods is lower than it was initially.
A rightward shift of the supply curve represents an overall increase in supply. At any given price, suppliers will want to supply more goods than they did before the shift. This kind of change can occur for reasons including:
A positive shock in the production of the good
Looser regulations or lower taxes
A decrease in the cost of inputs used in the production of the good
New or improved technology
When supply shifts to the right, the market temporarily falls out of equilibrium. That’s because sellers will want to supply more goods than consumers wish to buy. Competition among sellers will drive prices in the market down, and the market will eventually settle at a new equilibrium. Here, the market-clearing price is lower and the market-clearing quantity is higher.
The equilibrium in a competitive supply and demand model is just one type of equilibrium. You’ll encounter many other models in economics courses. Some will look like the equilibrium for a perfectly competitive market, but others will look quite different. Some models might even have multiple equilibria.
Whatever model you are working with, the equilibrium represents a point of balance. Although it could, the equilibrium does not have to represent an ideal or preferred outcome. Economists simply use equilibrium to represent what the expected steady state of the model will be.
Outlier (from the co-founder of MasterClass) has brought together some of the world's best instructors, game designers, and filmmakers to create the future of online college.
Check out these related courses:


Economics
This article is a comprehensive guide on the causes for a demand curve to change. Included are five common demand shifter examples.
Subject Matter Expert

Economics
Ever wondered why some things never seem to go on sale? Price Elasticity of Demand, one of the key concepts of Microeconomics, can help you answer this question. In this article, we’ll explore the relationship between price and demand, and then dive deep on various types of elasticity.
Subject Matter Expert

Economics
This article gives a quick overview of perfect competition in microeconomics with examples.
Subject Matter Expert