
Economics
Understanding the Supply Curve & How It Works
Learn about what a supply curve is, how a supply curve works, examples, and a quick overview of the law of demand and supply.
Alejandro Diaz Herrera
Subject Matter Expert

Economics
03.24.2022 • 5 min read
Subject Matter Expert
Here’s a quick guide on the law of supply, including its definition and examples.
In This Article
In economics, the law of supply states that all else being equal, if the price of a good or service increases, the quantity supplied in the market will increase. If the price decreases, the quantity supplied will decrease.
The law of supply explains why supply curves are upward sloping. In a supply and demand diagram, an upward-sloping line or curve represents supply. The supply curve shows the quantity of goods that sellers are willing to sell at various prices. We associate lower prices with lower quantities supplied, and we associate higher prices with higher quantities supplied.
The supply curve shows the quantity of goods that sellers are willing to sell at various prices.
The law of supply is related to the law of demand. While the law of supply helps explain the behavior of sellers in the market, the law of demand helps explain the behavior of consumers. Consumers respond to price changes differently than sellers because they prefer to buy at lower prices rather than high ones. All else being equal, when prices in a market increase, the quantity demanded by consumers will decrease. When prices in the market decrease, the quantity demanded by consumers will increase.
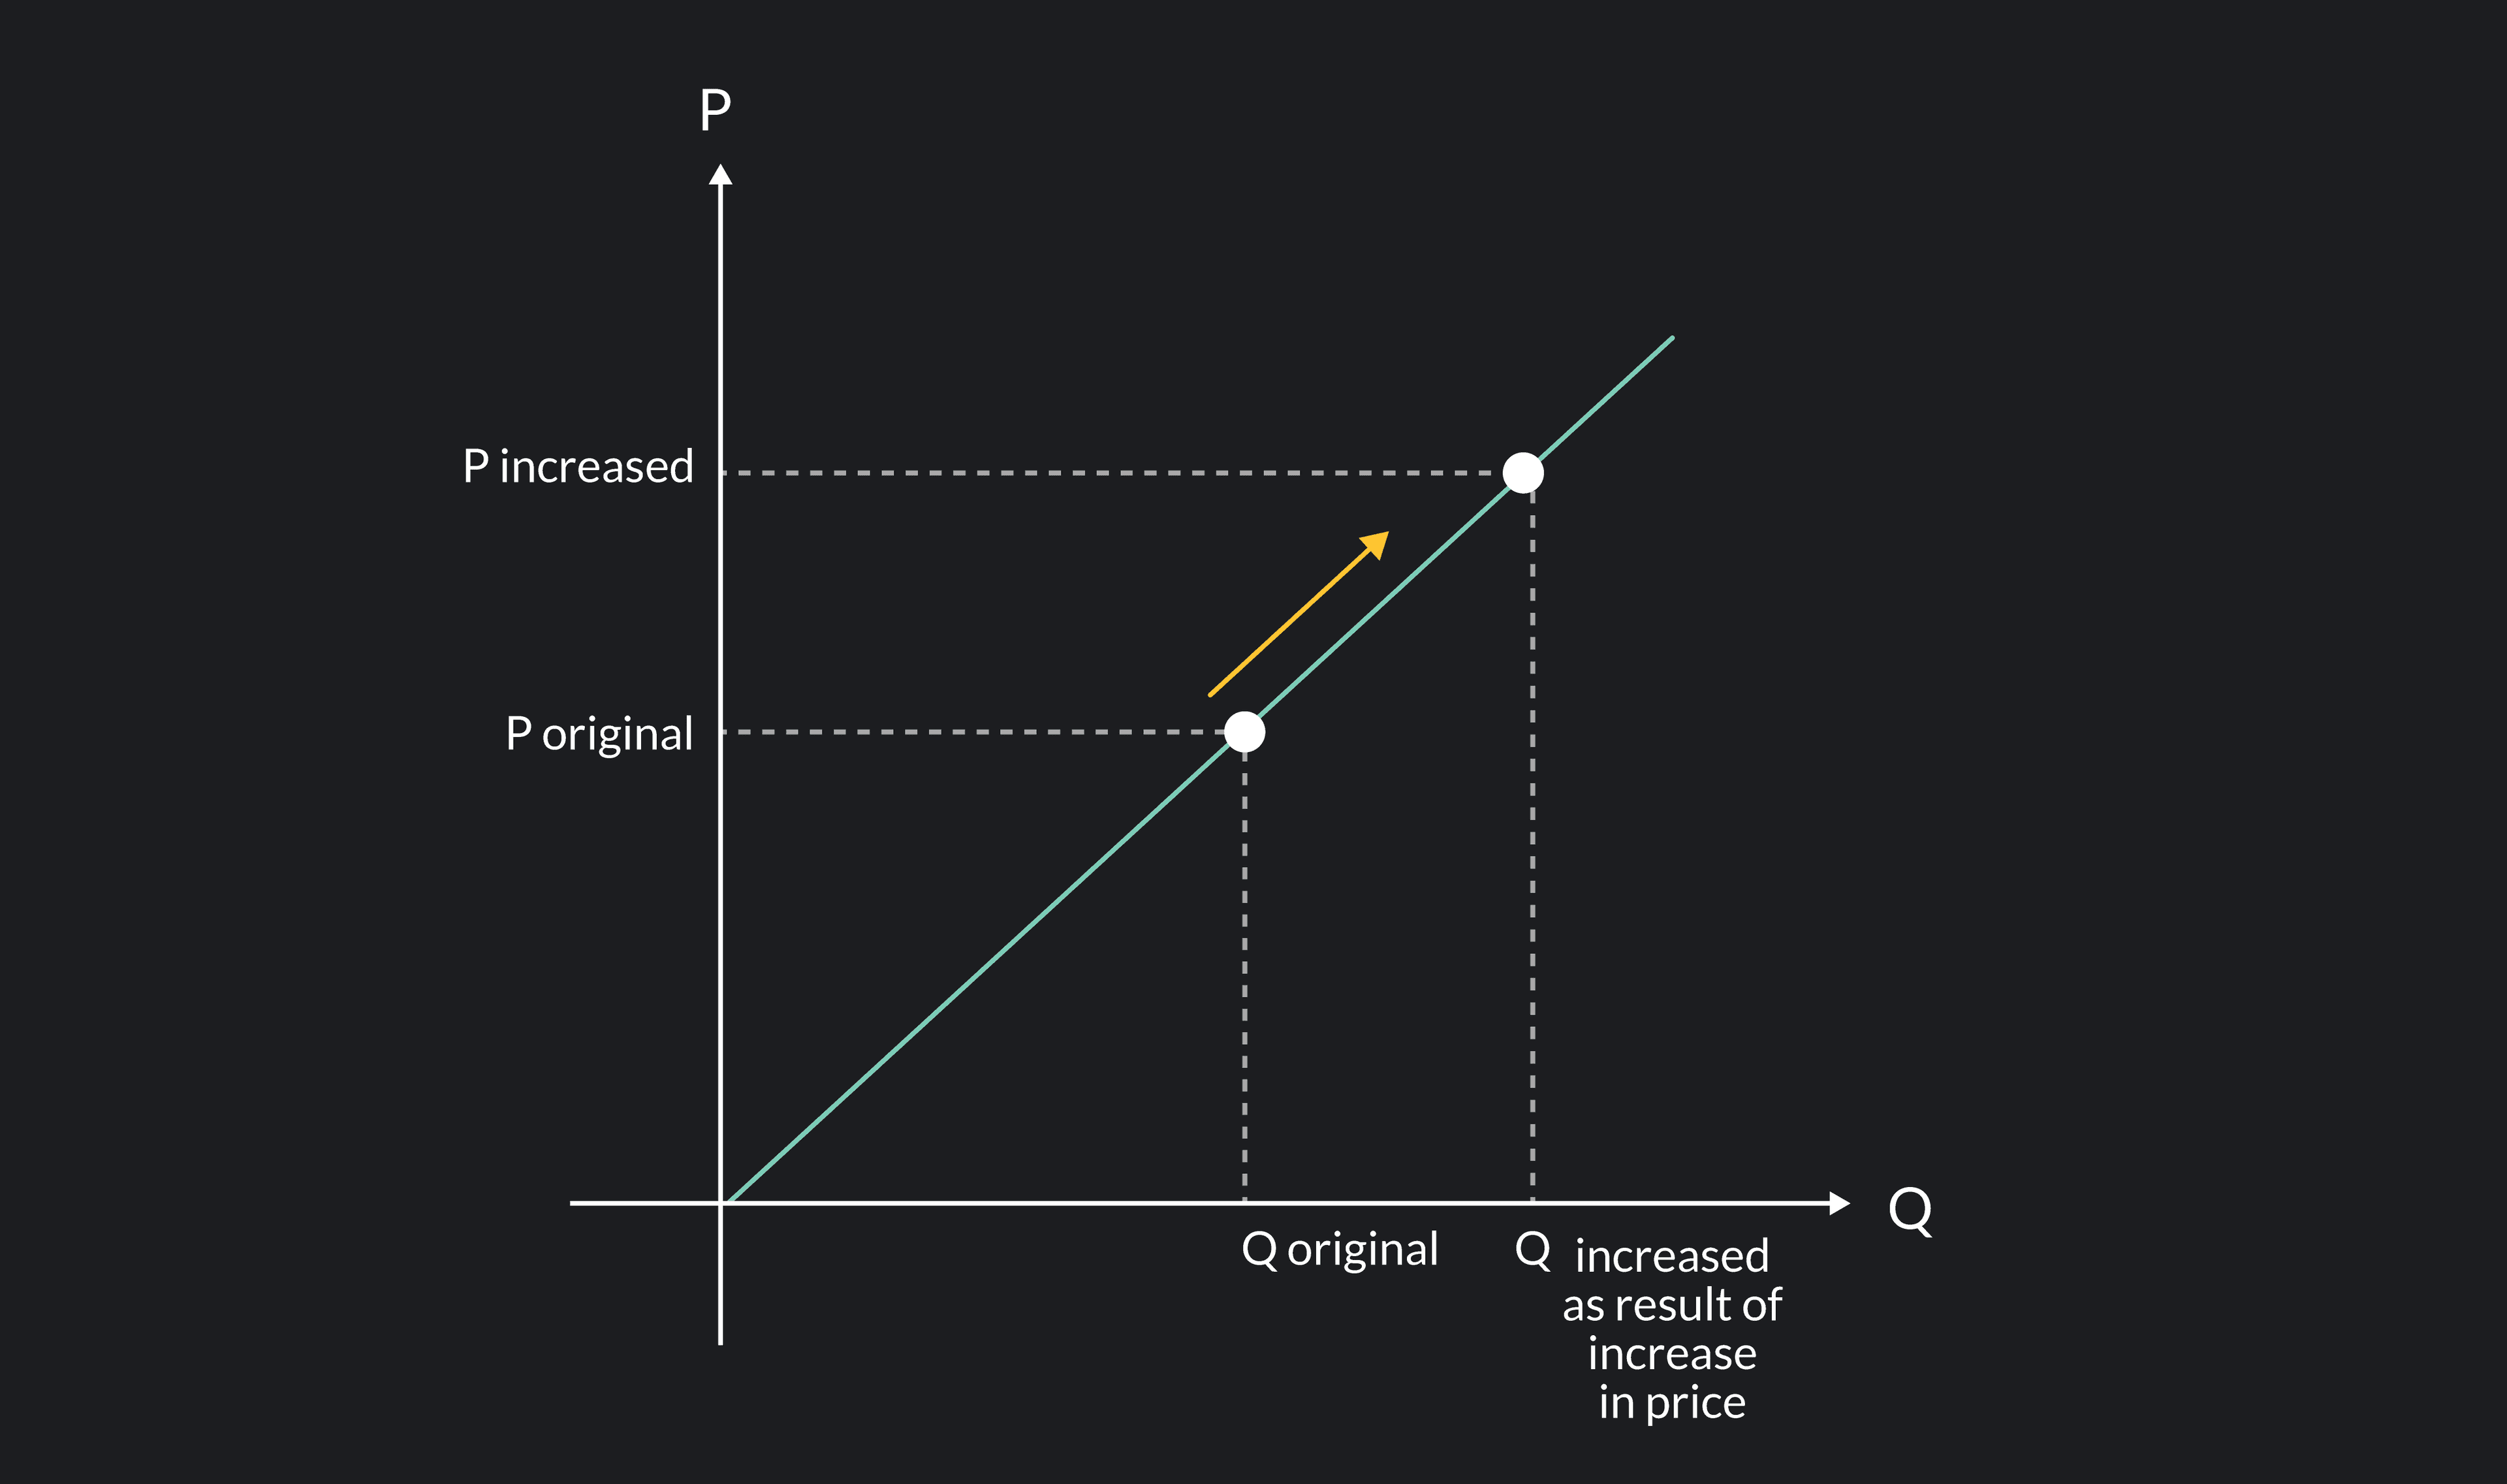
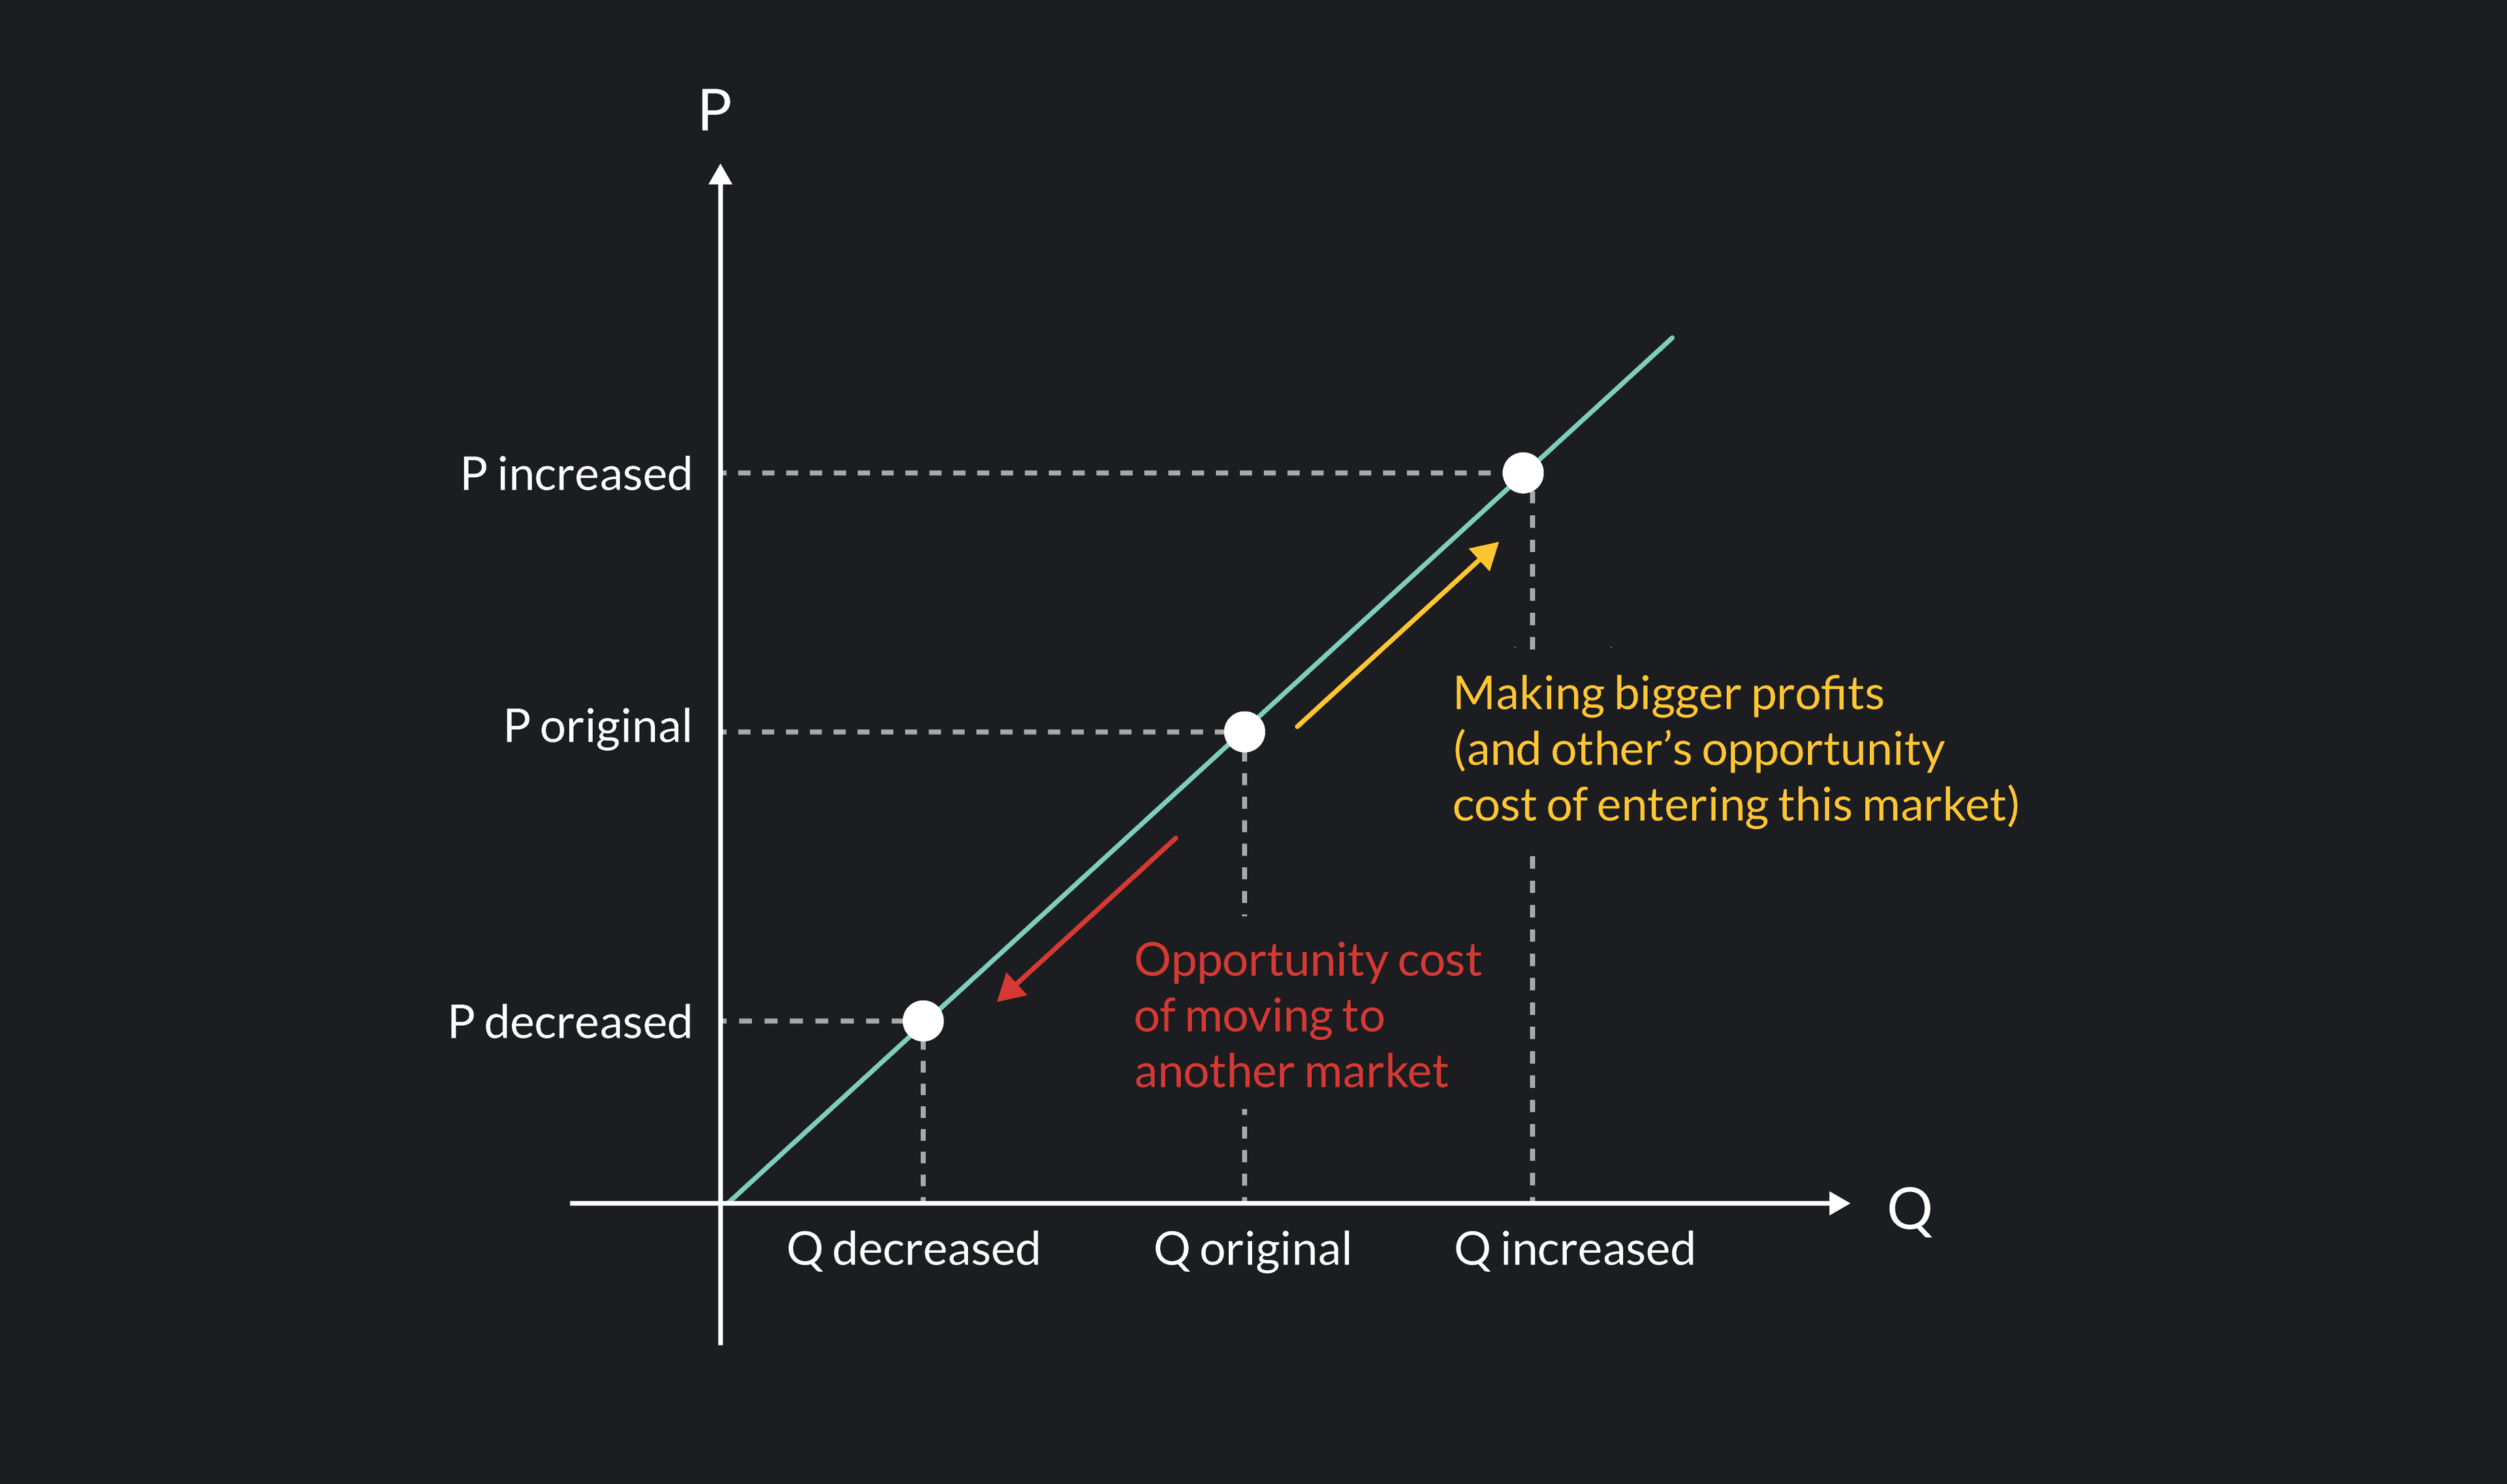
To understand the logic behind the law of supply, put yourself in the position of a seller. Say you are the owner of a hat company. You currently sell fedoras — the type of hat that Al Capone used to wear. Initially, the market price for fedoras is $50, but what happens when the market price drops to $30? As an entrepreneurial hatmaker interested in maximizing profits, what would you do?
If you continue putting all of your energy into selling fedoras, you’ll make a smaller profit. Even if you sell the same number of fedoras as you did at a price of $50, you’d be selling each hat for a lower price. If your profits fall too low, you might have to shutter your store, and if that’s the case, the quantity of fedoras you supply to the market will drop to zero. If you stay in business, you’re likely to look for other ways to regain your lost profits. This will involve selling fewer fedoras and putting your entrepreneurial energy and resources towards the production of a more profitable product, maybe baseball caps or cowboy hats.
Next, imagine that instead of a price decrease, the price of fedoras shoots up to $80. Perhaps a fashion icon or a group of famous actors suddenly decide to make fedoras a staple in their wardrobe, and shoppers everywhere are now clamoring to shop the trend. In this case, what will you do? You’ll likely rush to stock your shelves with as many fedoras as you have in stock! The higher price increases your profits, and if prices are high enough, you may even decide to buy more machines or hire more hatmakers to increase your supply of fedoras further. The basic logic that drives your decisions, as this hypothetical hatmaker, is the same logic that drives the behavior of sellers in many real-world markets.
The law of supply explains the overall shape of supply curves and is the reason for movements up and down along the supply curve (such as from A to B or B to A in the figure below and to the left). These movements occur as quantity supplied adjusts to changes in the market price, and they are very easy to confuse with shifts of the entire supply curve.
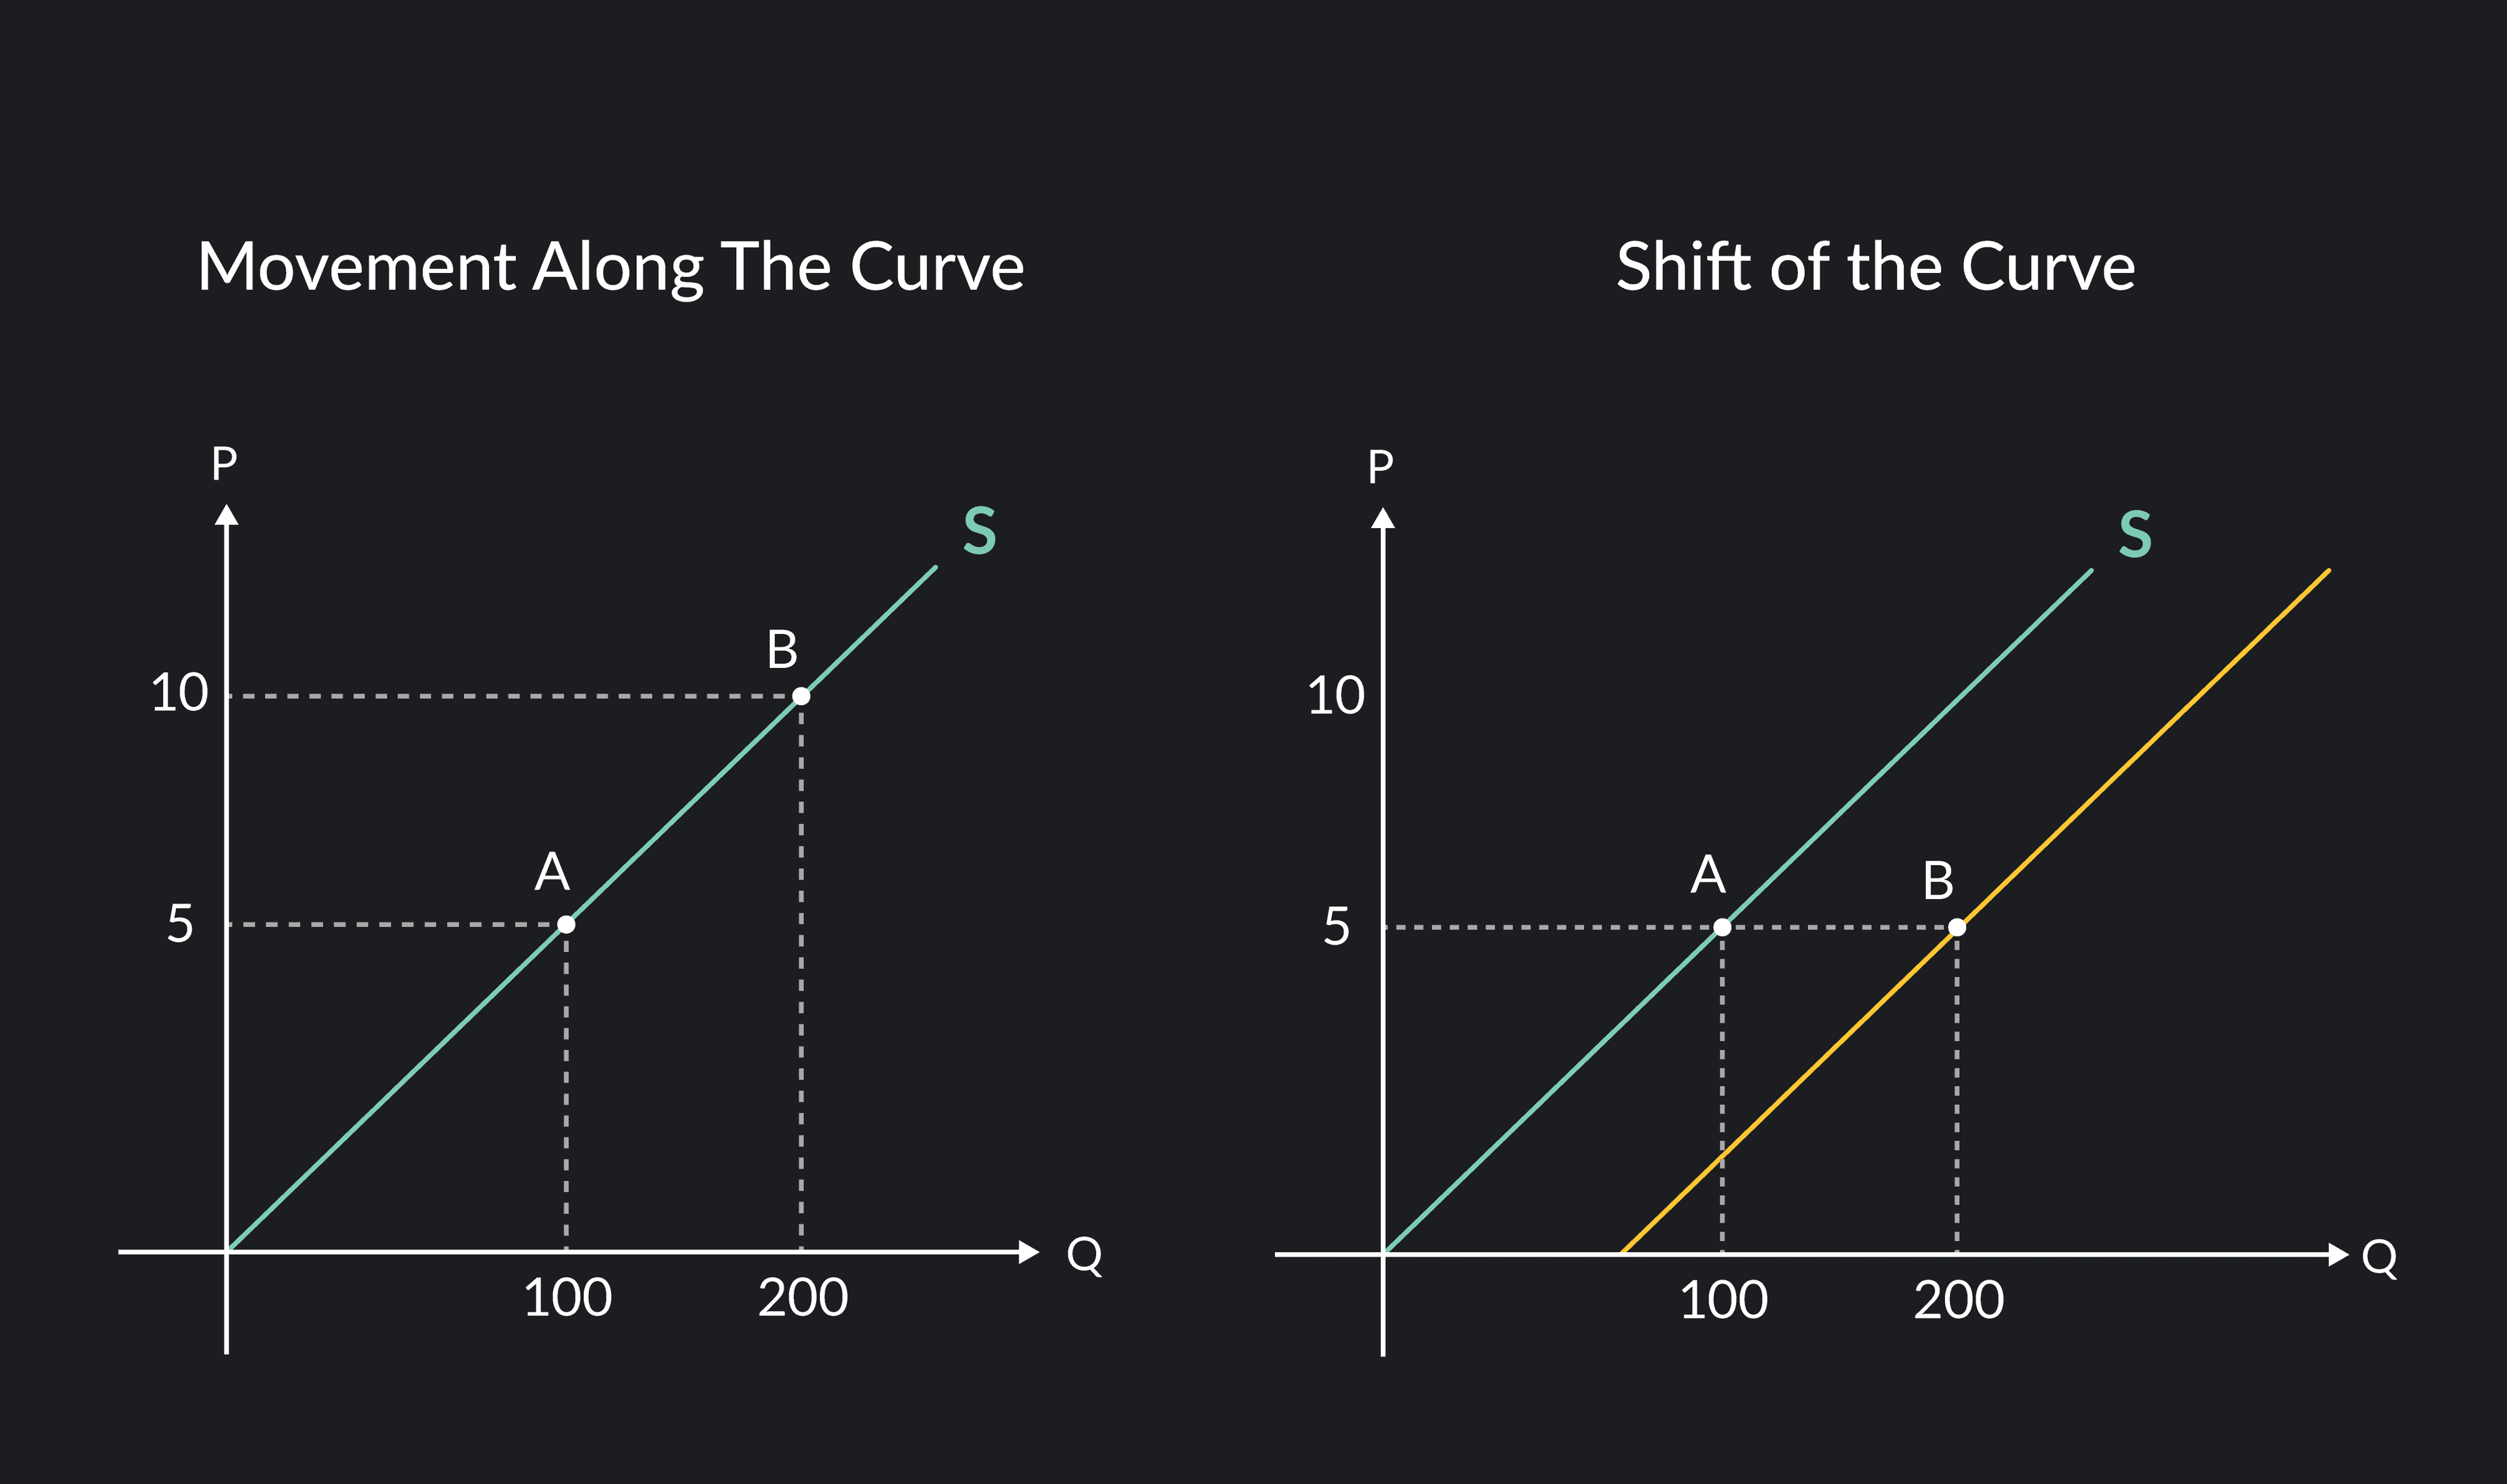
Shifts in the supply curve represent an increase or decrease in overall supply—such as the shift of the blue supply curve to the yellow supply curve in the figure to the right. When a supply curve shifts outward to the right, it means that at any given price, suppliers in the market are willing to supply more goods than they were previously willing to sell. When a supply curve shifts inward to the left, it means that, at any given price, suppliers will supply fewer goods than they were previously willing to sell.
Returning to our hatmaker example, a movement up or down the supply curve explains why a hatmaker is willing to supply more hats when prices increase and fewer hats when prices decrease. A shift in the supply curve explains why, at a fixed price, the hatmaker might change the amount he is willing to sell. If he initially sells 100 fedoras at a price of $50 but then becomes willing to sell 130 fedoras or only 70 fedoras at that same price, we describe this change as part of a shift in supply.
Shifts in supply can occur for many reasons, including:
Changes in the prices of inputs that are used to produce the good
Changes in the price of related goods or services
Improvements or setbacks in the technology used to produce the good
Expectations about the future
Change in the number of producers in the market
Shifts in the supply curve represent an increase or decrease in overall supply.
There are many examples of the law of supply at work.
Here are a few:
Airbnb hosts often rent out spare rooms or houses for more nights when nightly rates in their area increase.
Employers can entice their part-time workers to work more hours (supply more hours of labor) by offering a higher hourly rate.
A pop-up bakery that is only open 3 days a week might decide to stay open 6 days a week if the price of bread increases. If the price of bread falls, they may choose only to bake and sell their bread once a week.
Here's one other example from one of our lessons:
Is the law of supply always at work? In other words, do supply curves always slope upward? The answer to these questions is no.
The law of supply has important limitations in real life. In some cases, sellers have preferences or restrictions that prevent them from supplying more goods to the market even as prices increase. In other cases, companies have large economies of scale (costs per unit that decrease as production volume increases) and can be willing to sell goods at higher volumes and at cheaper prices.
Outlier (from the co-founder of MasterClass) has brought together some of the world's best instructors, game designers, and filmmakers to create the future of online college.
Check out these related courses:


Economics
Learn about what a supply curve is, how a supply curve works, examples, and a quick overview of the law of demand and supply.
Subject Matter Expert
Economics
This article gives a quick overview of perfect competition in microeconomics with examples.
Subject Matter Expert

Economics
This article is a comprehensive guide on the causes for a demand curve to change. Included are five common demand shifter examples.
Subject Matter Expert