In economics, we love to use graphs to represent the concepts we are studying. This includes the supply curve. The supply curve is a graphical representation of the quantity of goods or services that a supplier willingly offers at any given price. This represents how supply works.
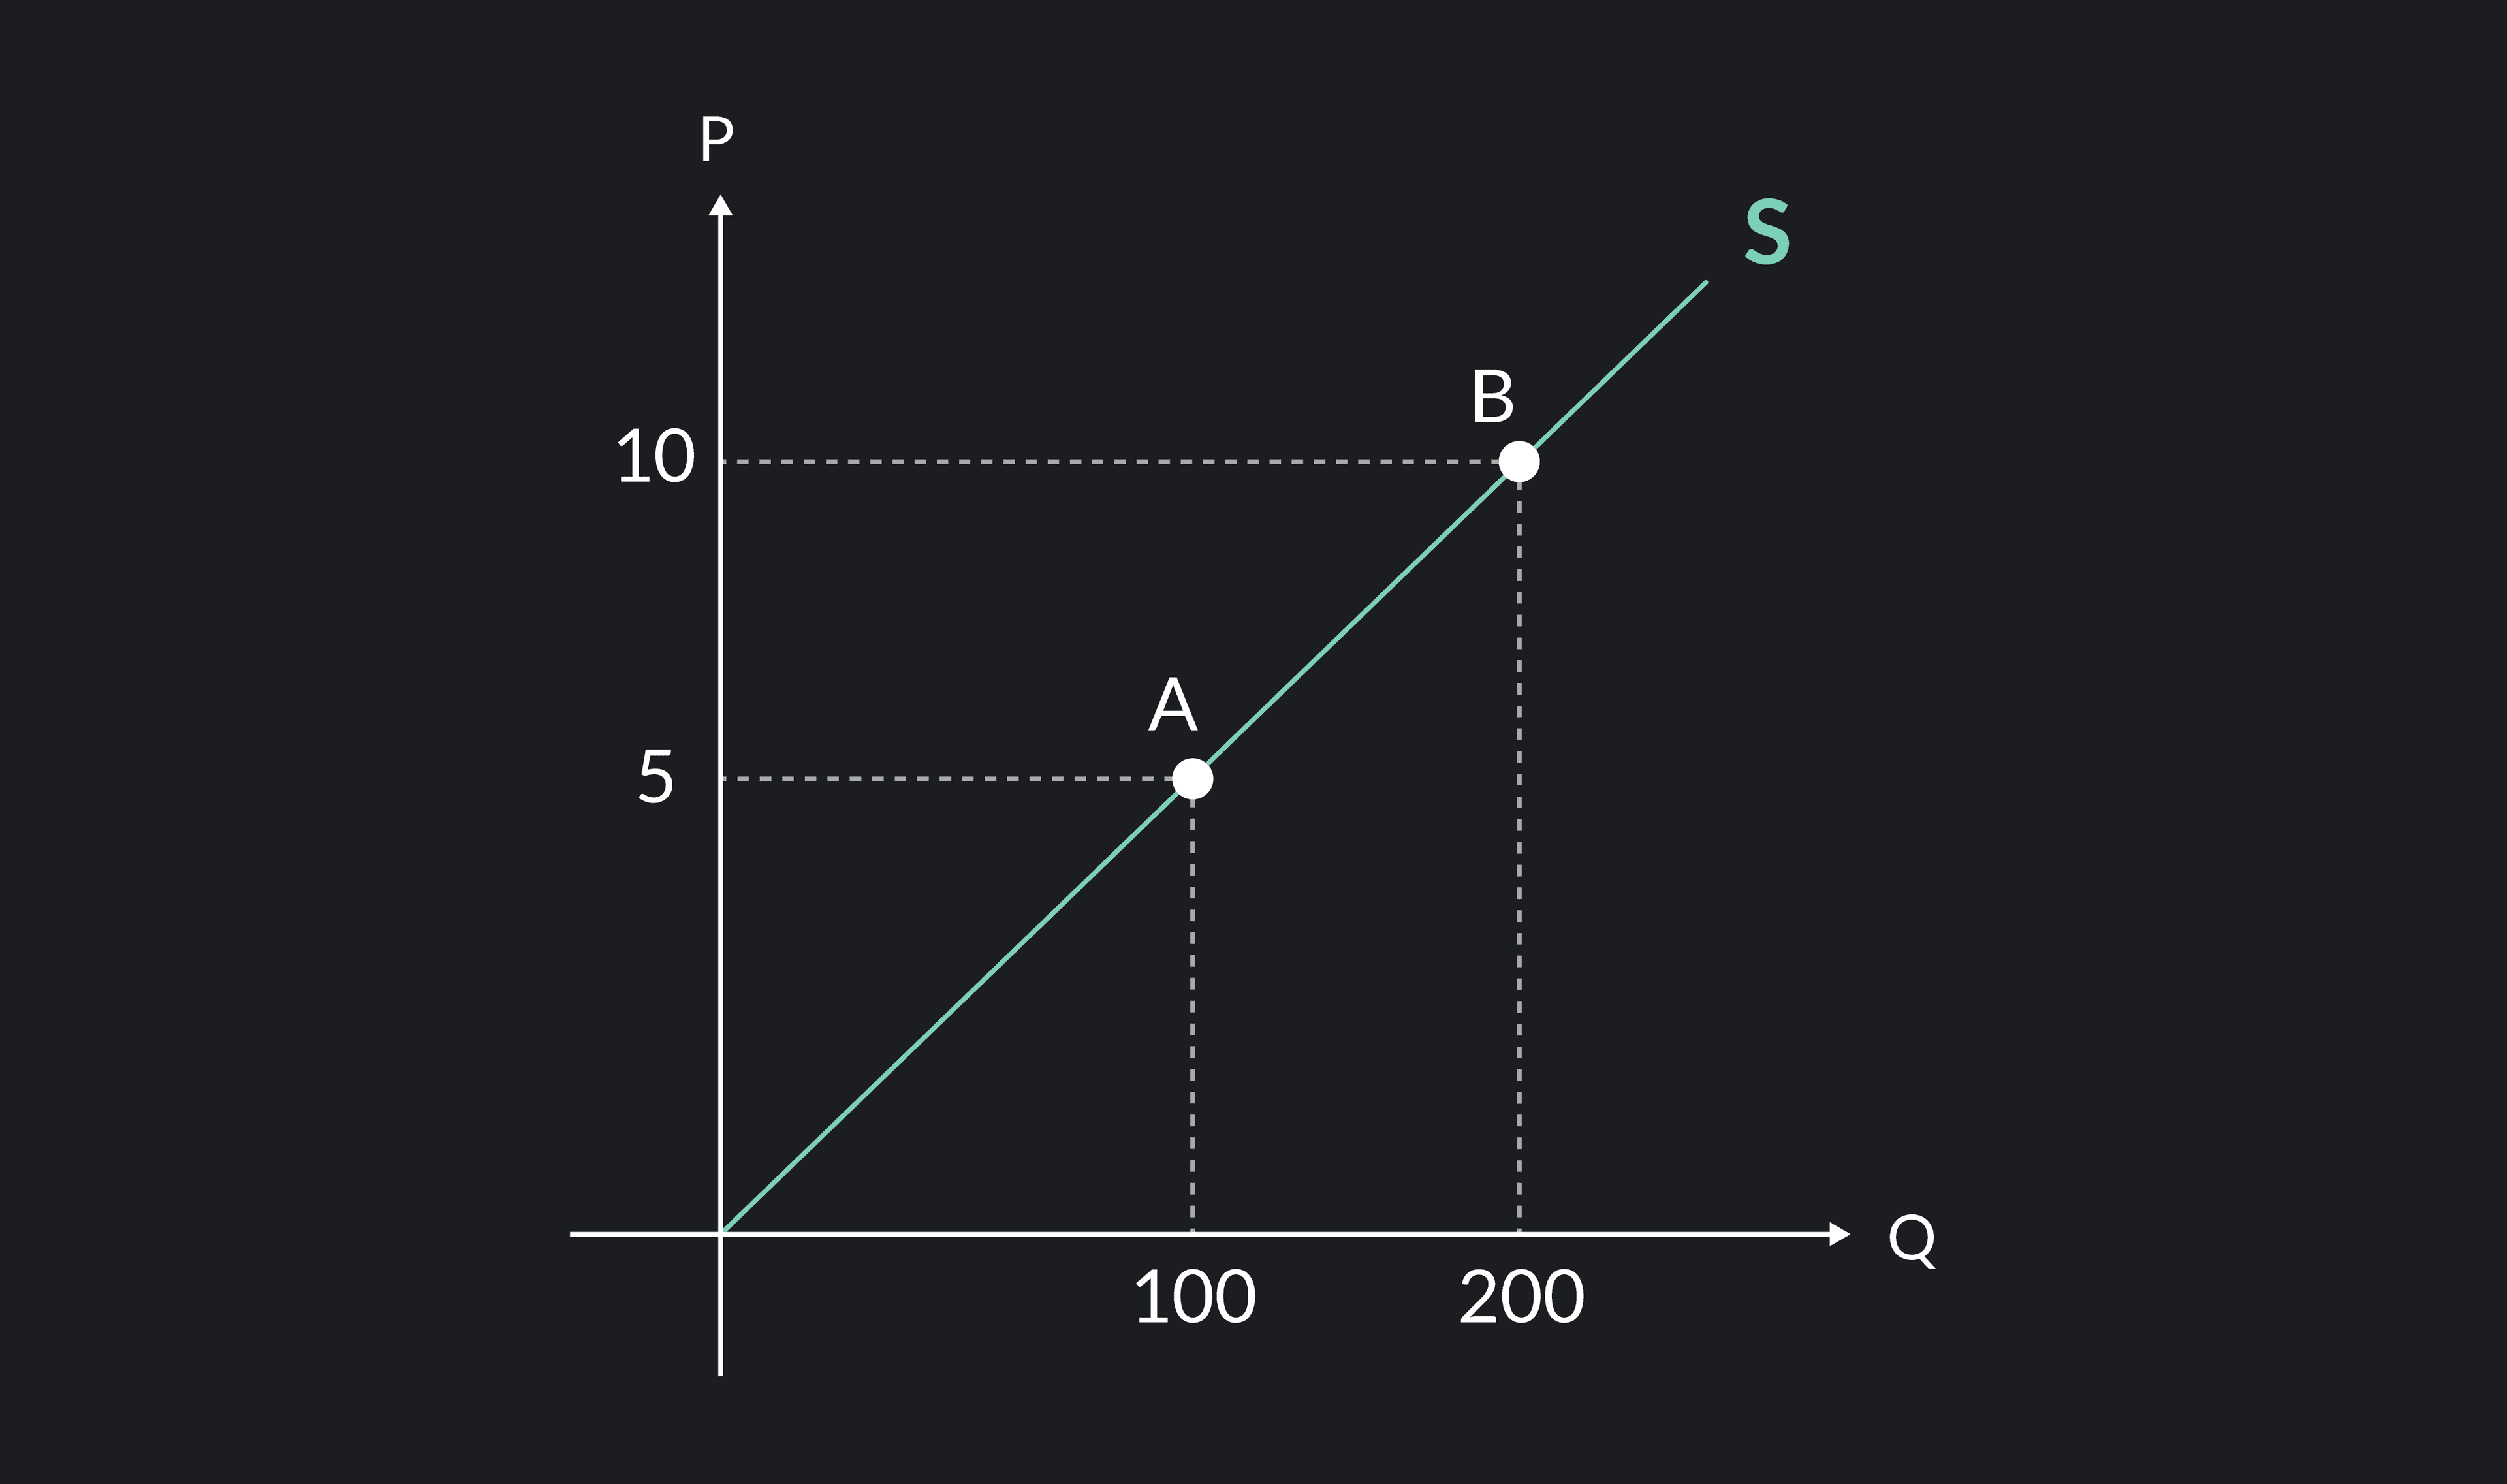
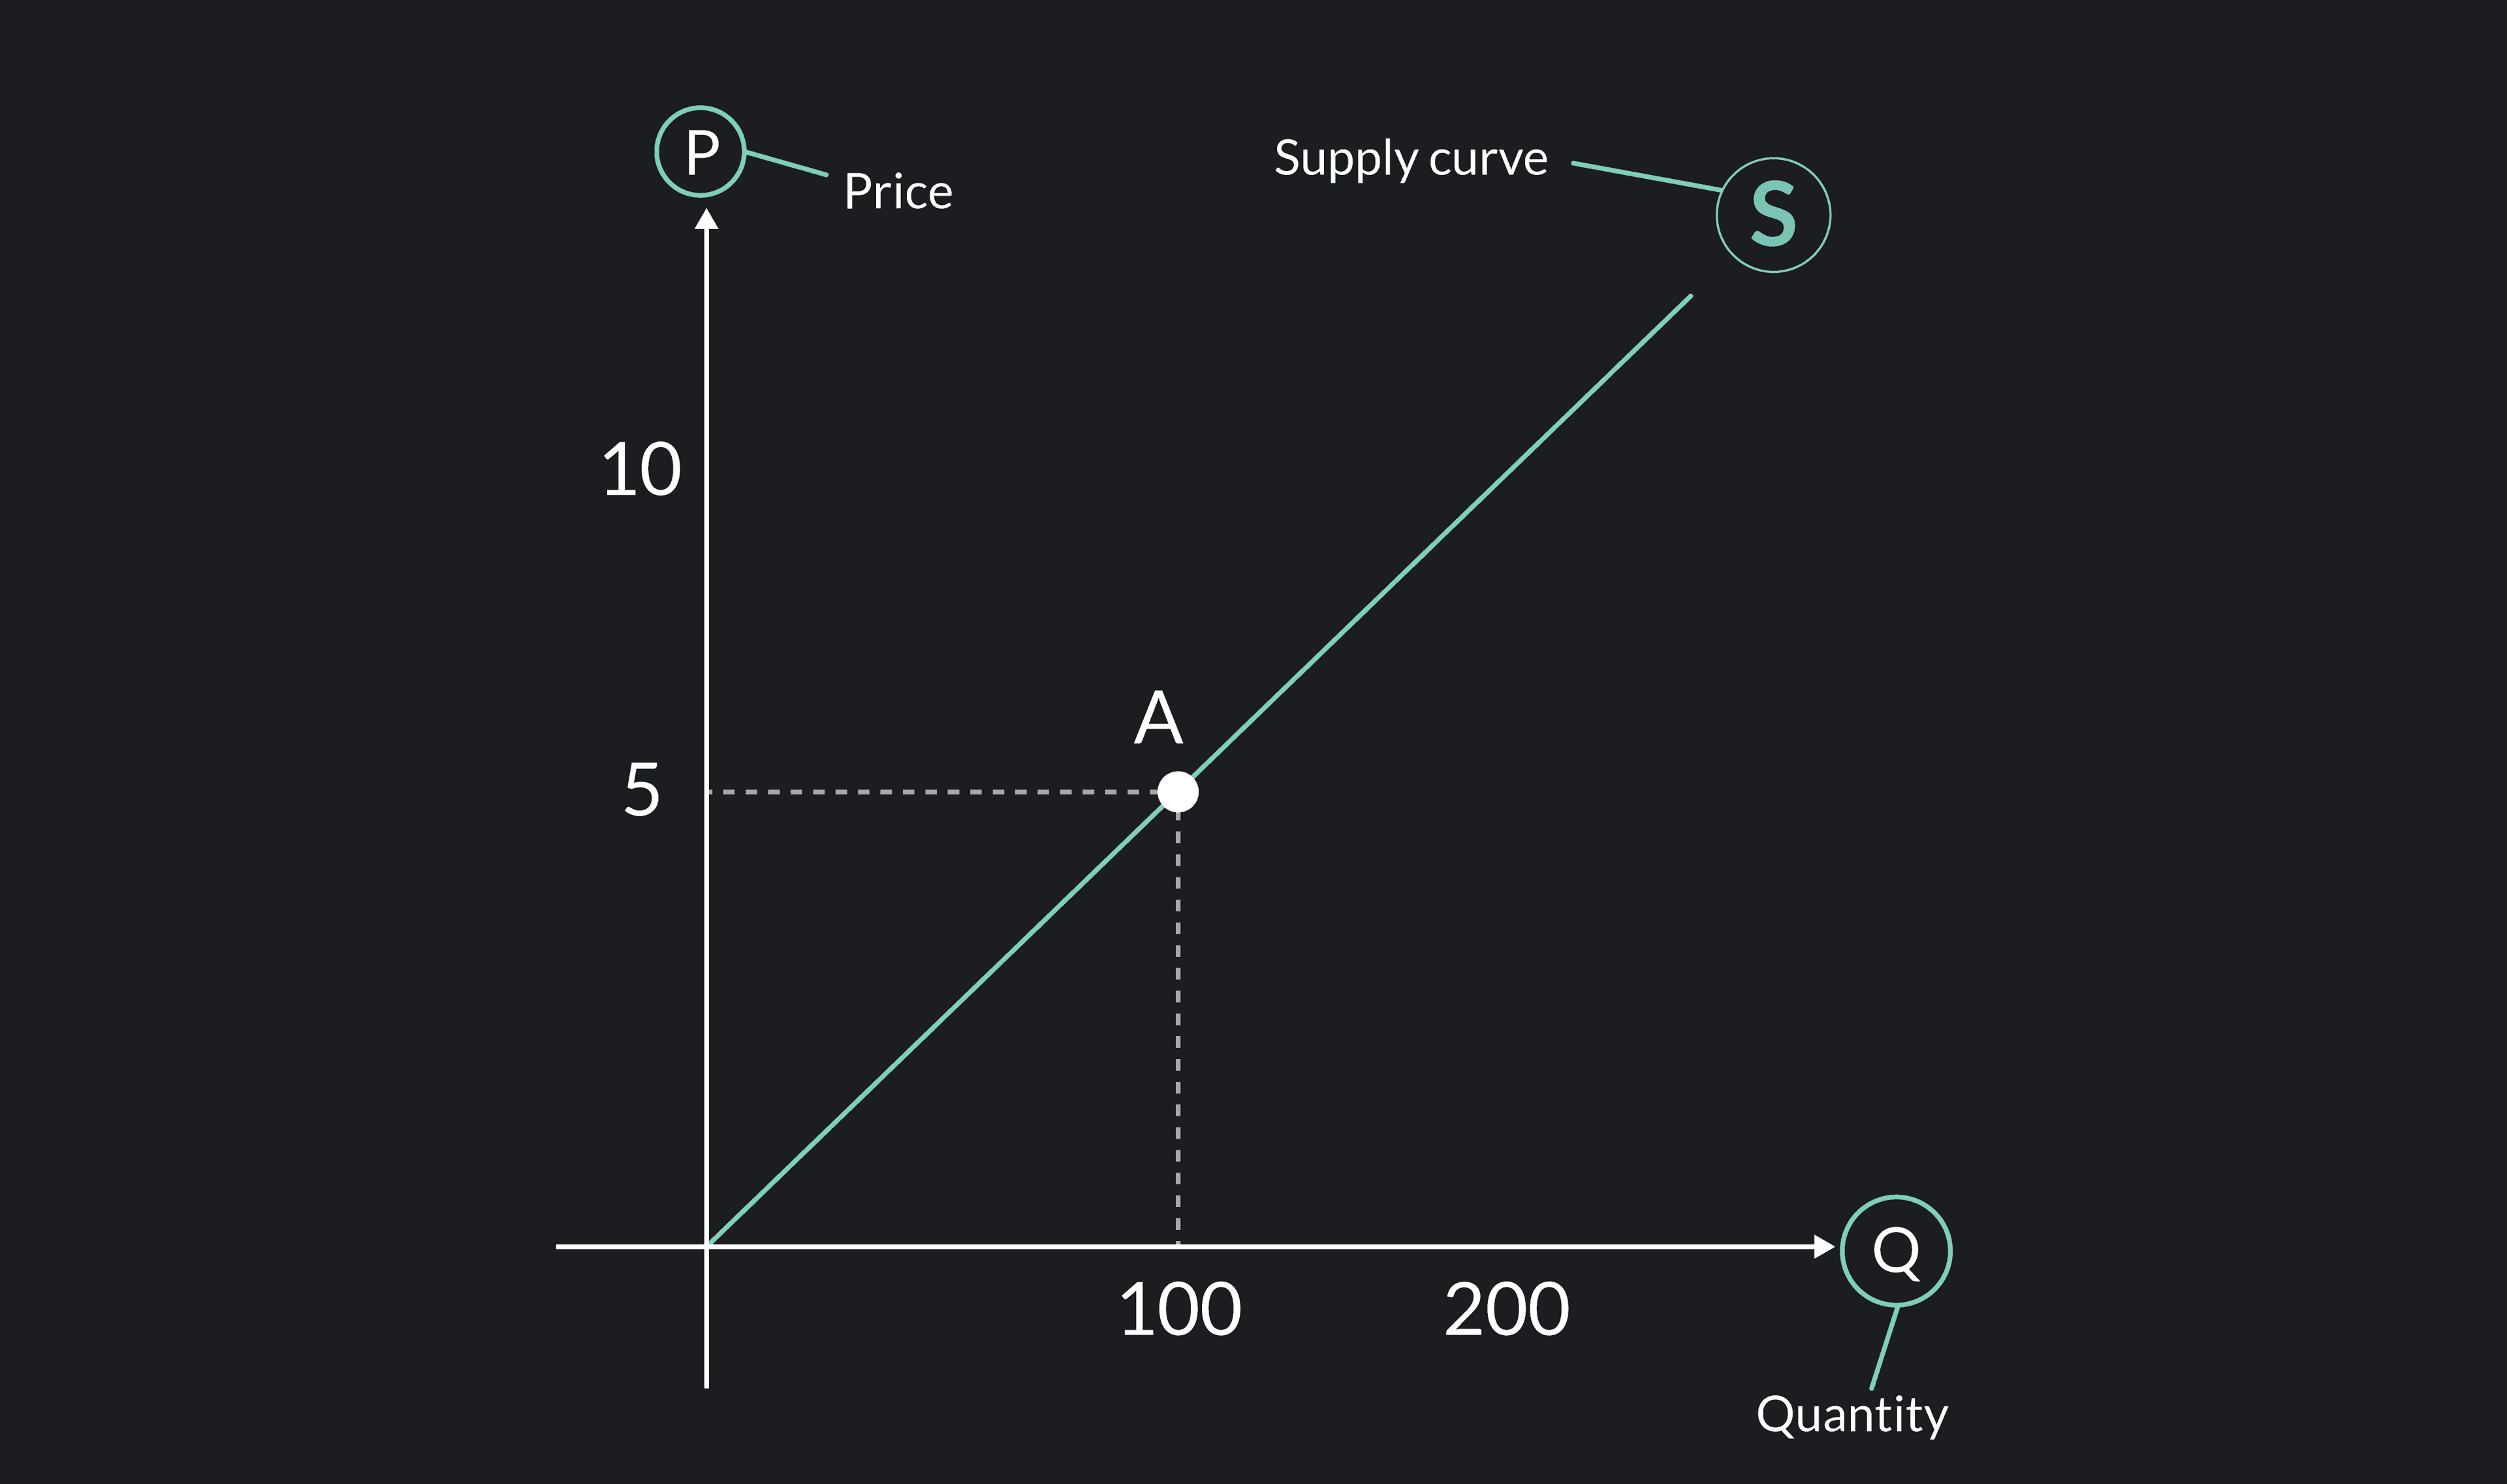
Let’s break down the supply curve to better understand it. In the graph, we see two axes. The horizontal axis represents Q (quantity) and the vertical axis represents P (price). Then, the supply curve has an upward slope.
Look at point A, which lies over the curve. The correct way to understand A is: if the supplier is producing 100 units of this good, then they expect to receive 5 dollars for each unit they are selling. In the same way, every point in the curve will relate a quantity with a specific price.
The Upward Slope of the Supply Curve
Before looking at why the supply curve slopes upward, we must discuss what an upward slope means. For example, take point A, which is in the lower part of this supply curve. For this good, the supplier is willing to produce 100 units if they receive 5 dollars per unit. Then, at point B, the supplier is willing to produce 200 units if they receive 10 dollars per unit. Why is the supplier asking for a higher price per unit in order to produce more?
Upward-Sloping Supply Curve Example
Suppose that you have mastered the art of painting and are the only one in town who has done it. Now place yourself in the position of the supplier. Every week, you are willing to sell one painting at a specific price (let’s say 100 dollars), but then two customers appear and want to buy a painting. You offer to make a new painting for the second customer. Then you realize something: each painting takes around 20 hours to produce. So if you paint the second one, you won’t be able to attend this Saturday’s BBQ in the park and will miss the opportunity to see your crush.
The only way you will accept that is by expecting a higher payment for the painting so that it compensates you for not going to the BBQ. This trade-off of creating a new painting instead of being with your crush is an example of the opportunity cost.
Now imagine what would happen if you were asked to make a third painting? You would miss even more plans, making you less willing to make the third painting. Your opportunity cost is increasing every time people ask you for a new painting.
This is what we call increasing marginal costs. It’s the cost of producing one more unit higher than the cost of the last unit produced. This is the main reason why the production function and the supply curve have an upward slope.
Supply Curve Movement vs. Shifting
Now that we have understood what the supply curve is, and why it looks that way, let’s have a look at some determinants that can affect the supply of a product in a marketplace.
First, it is important to note the difference between two events on the curve:
A movement along the curve
A shift of the curve
Movement Along the Curve
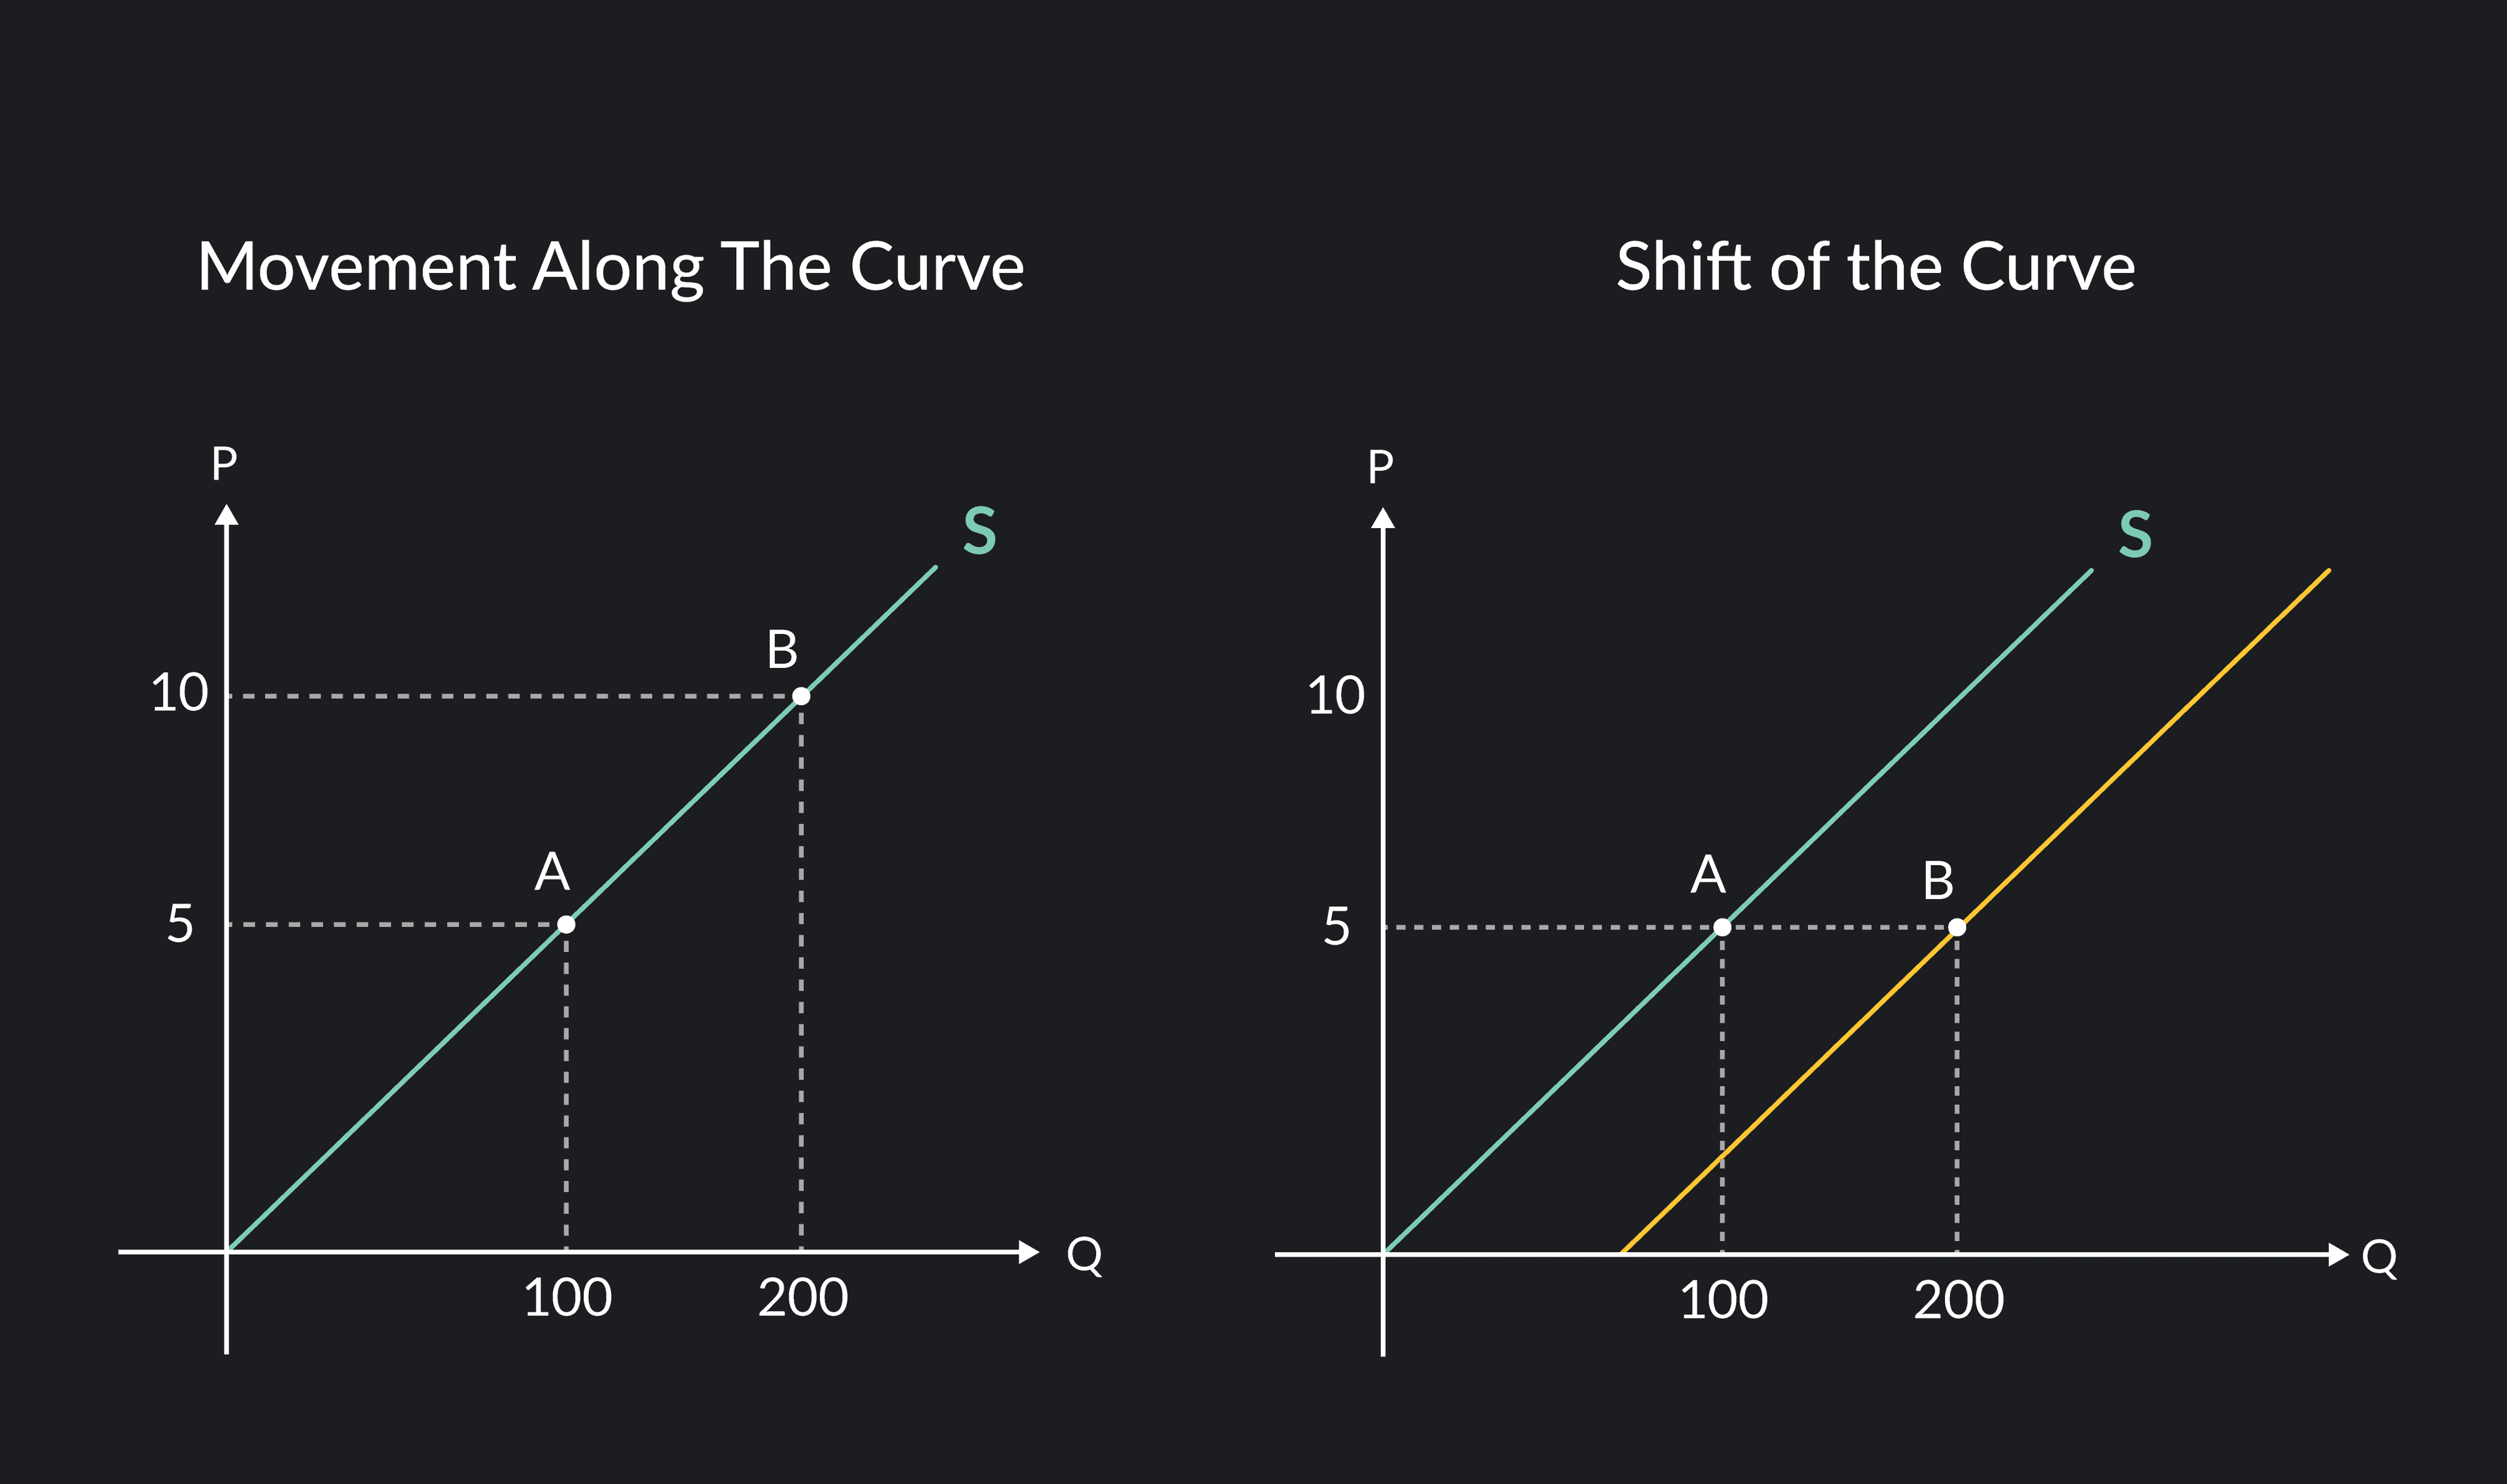
The first chart is an example of a movement along the curve. As the quantity changes, the expected price of a product also changes — or the other way where if the price changes, the quantity will adjust. It is important to note that in this case, the supply curve has not changed at all, what has changed are the quantity and the price.
The first phenomenon — a move along the curve — happens when the suppliers observe a change in demand. Going back to our example of the paintings, remember that you were not as willing to spend 20 more hours to paint a second painting? We determined that for you to paint those extra paintings, you would expect a higher compensation for each of them. This is an example of how, if the demand changes, the supply will adjust by moving along the curve.
Shift in the Supply Curve
The second graph shows us a different scenario. The whole supply curve has moved. This is what we call a shift of the curve. Note that in this case, the quantity supplied changed as the price of the product remained the same. So what causes a shift in the supply curve?
A shift of the curve happens when the suppliers observe changes in the production process itself. We will list some of them and then explain what they mean.
Factors That Affect the Supply Curve
Many factors can shift the supply curve but we will look at four:
Change in cost of production
Technology shocks
Natural events
Government intervention
1. Government Intervention
The government can interfere with the markets in many ways such as:
Taxes
Subsidies
Regulation
Licensing
Price fixing
Some of these will cause shifts in the supply curve (and demand curve). To better understand this, it is important to learn more about what these mechanisms are and how they affect the market.
2. Change in Cost of Production
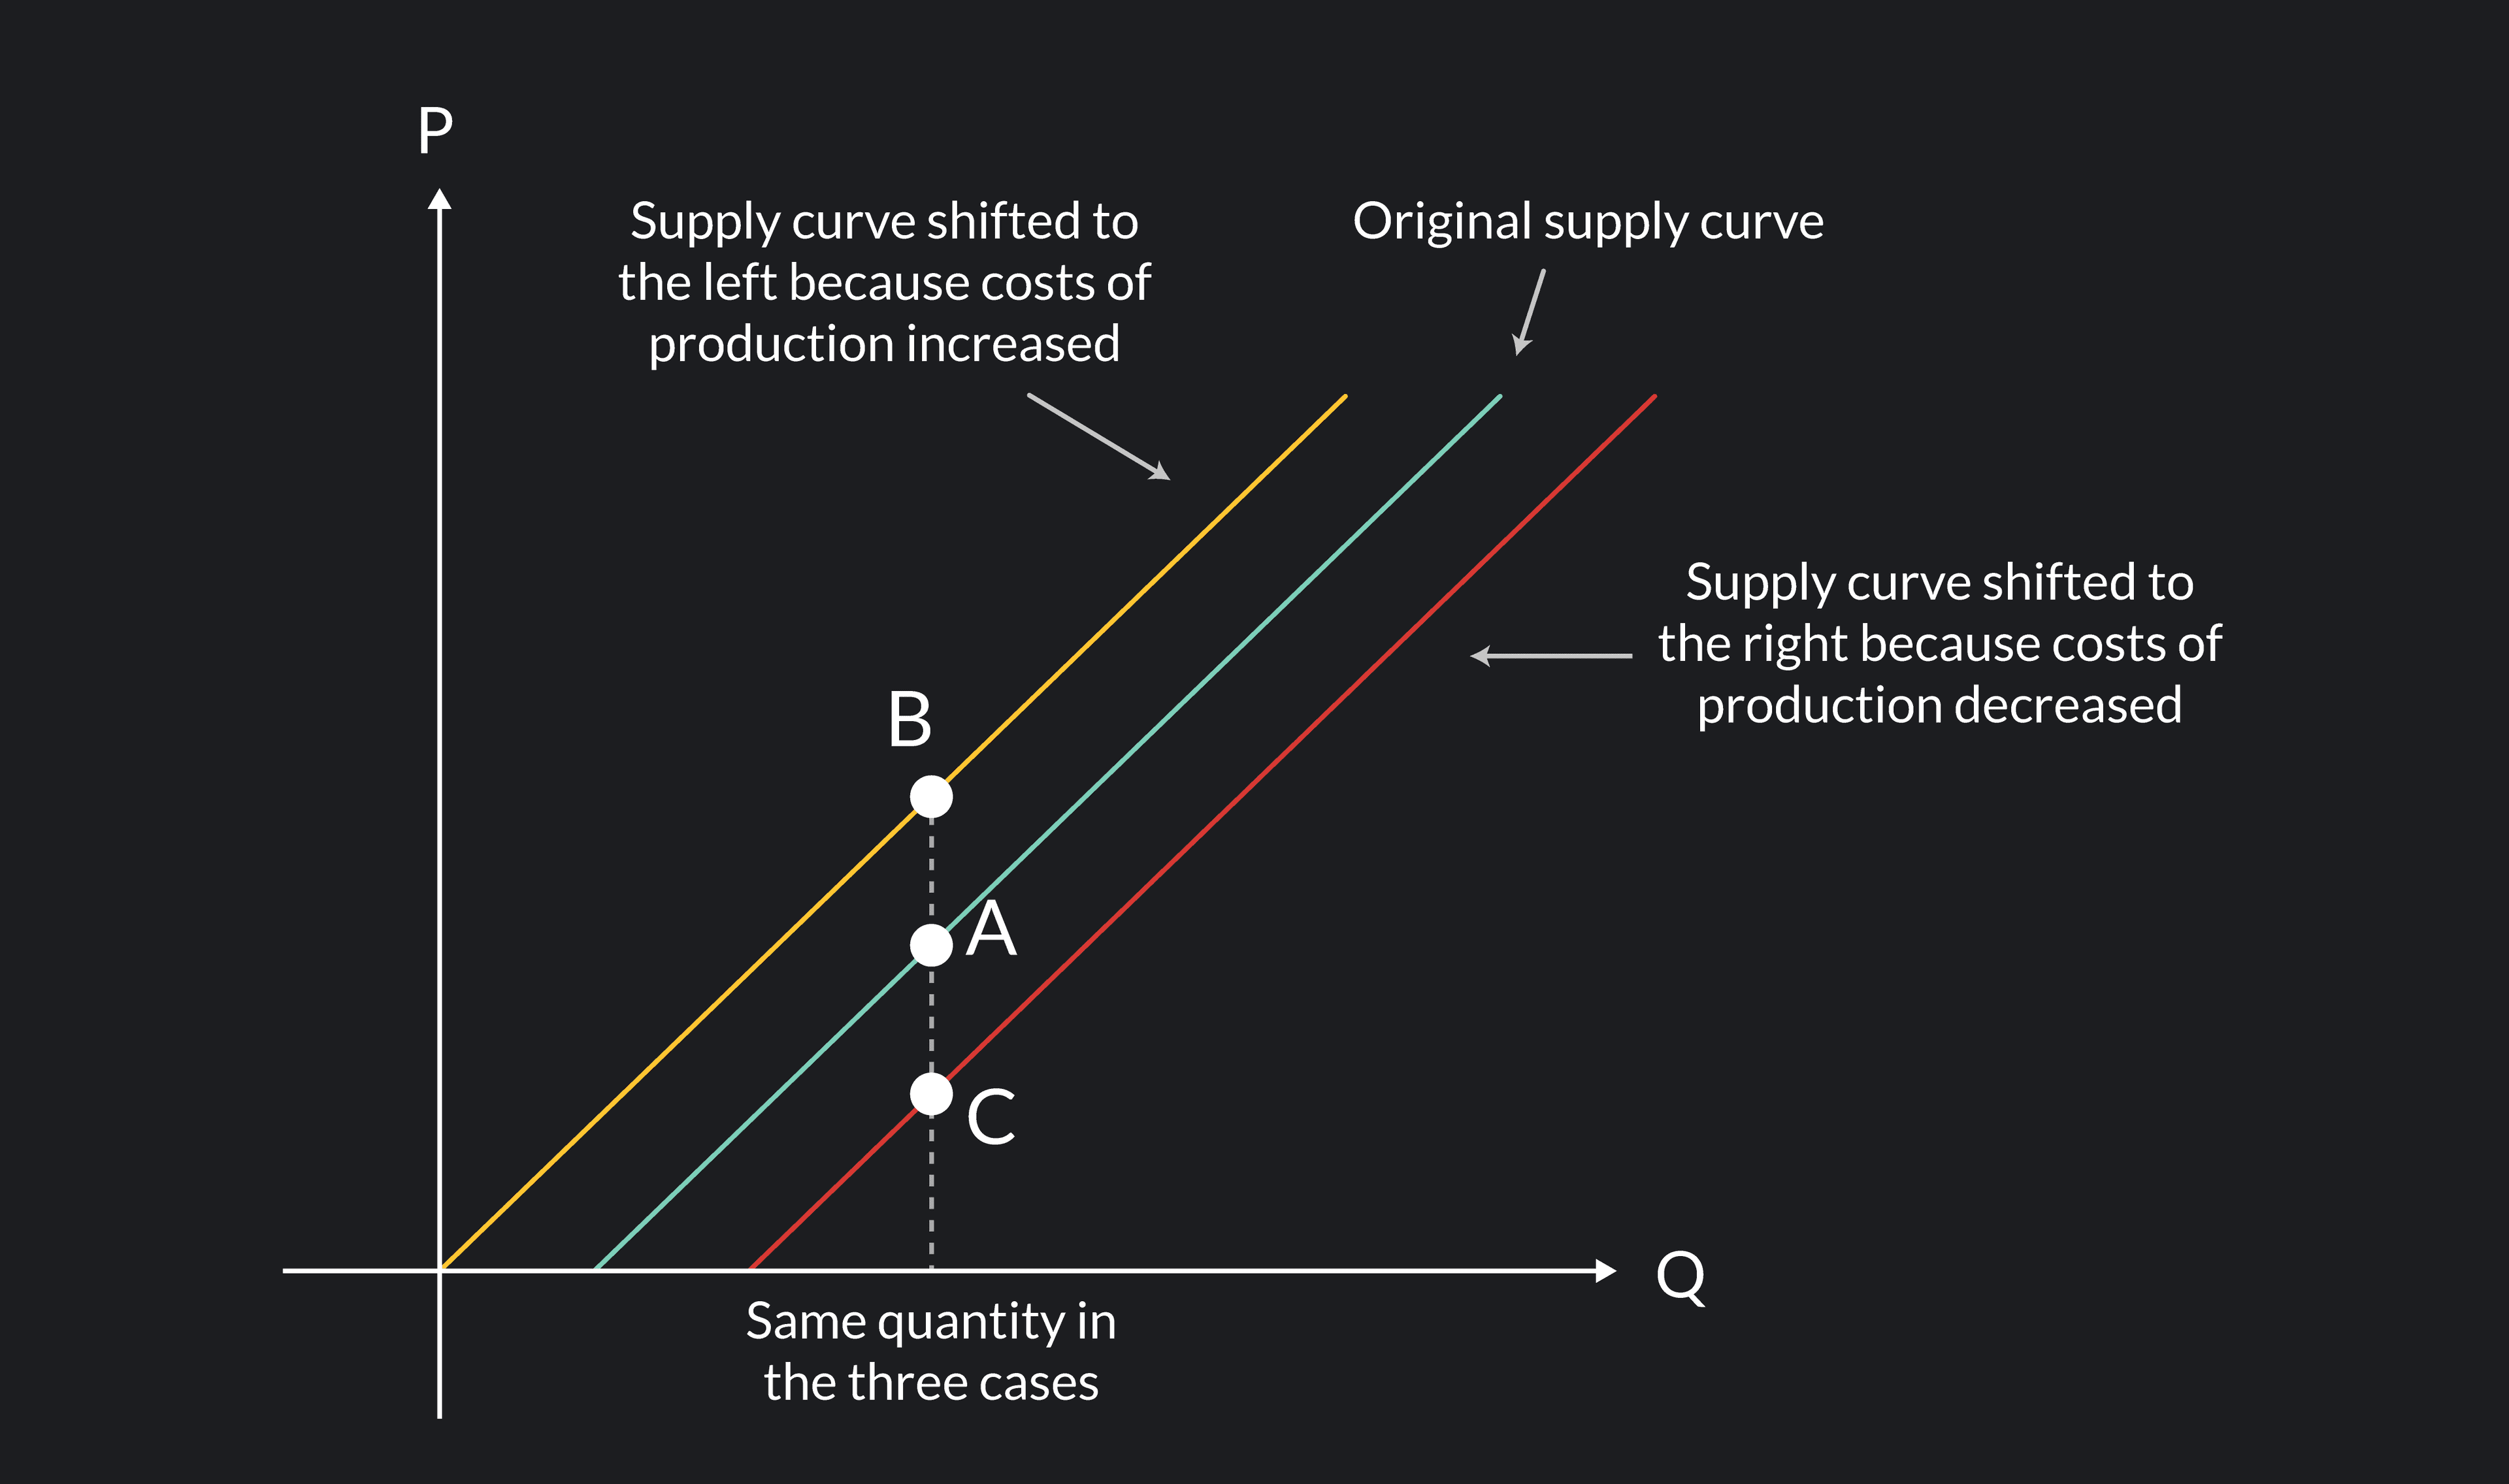
What would you do if suddenly, the price increases for the oil paint you use to make your paintings? You’d most likely increase the cost of your paintings. This is an example of a change in the cost of production, specifically in the cost of the inputs you use to produce. Your costs of production have increased because of a rise in the prices of your input. This translates to the supply curve shifting to the right.
Another example could be that you no longer need 20 hours to make a painting, but only 10 hours. Now that you need less time to make a painting, your cost of production has decreased. This will make the supply curve shift to the left.
Because of these shifts, the same painting has resulted in different prices. The way you relate quantity and price has changed!
3. Technology Shocks
Technology shocks are sudden changes in technology that can affect the cost of production. Let’s look at an example.
Suppose a good friend of yours gives you a new machine that helps you prep your canvas for painting in a shorter amount of time. You usually spend three hours on canvas preparation, but this machine performs it in half an hour. This technology has improved your efficiency. This makes your cost of production relatively lower. Are you able to say in which direction the supply curve should shift?
4. Natural Events
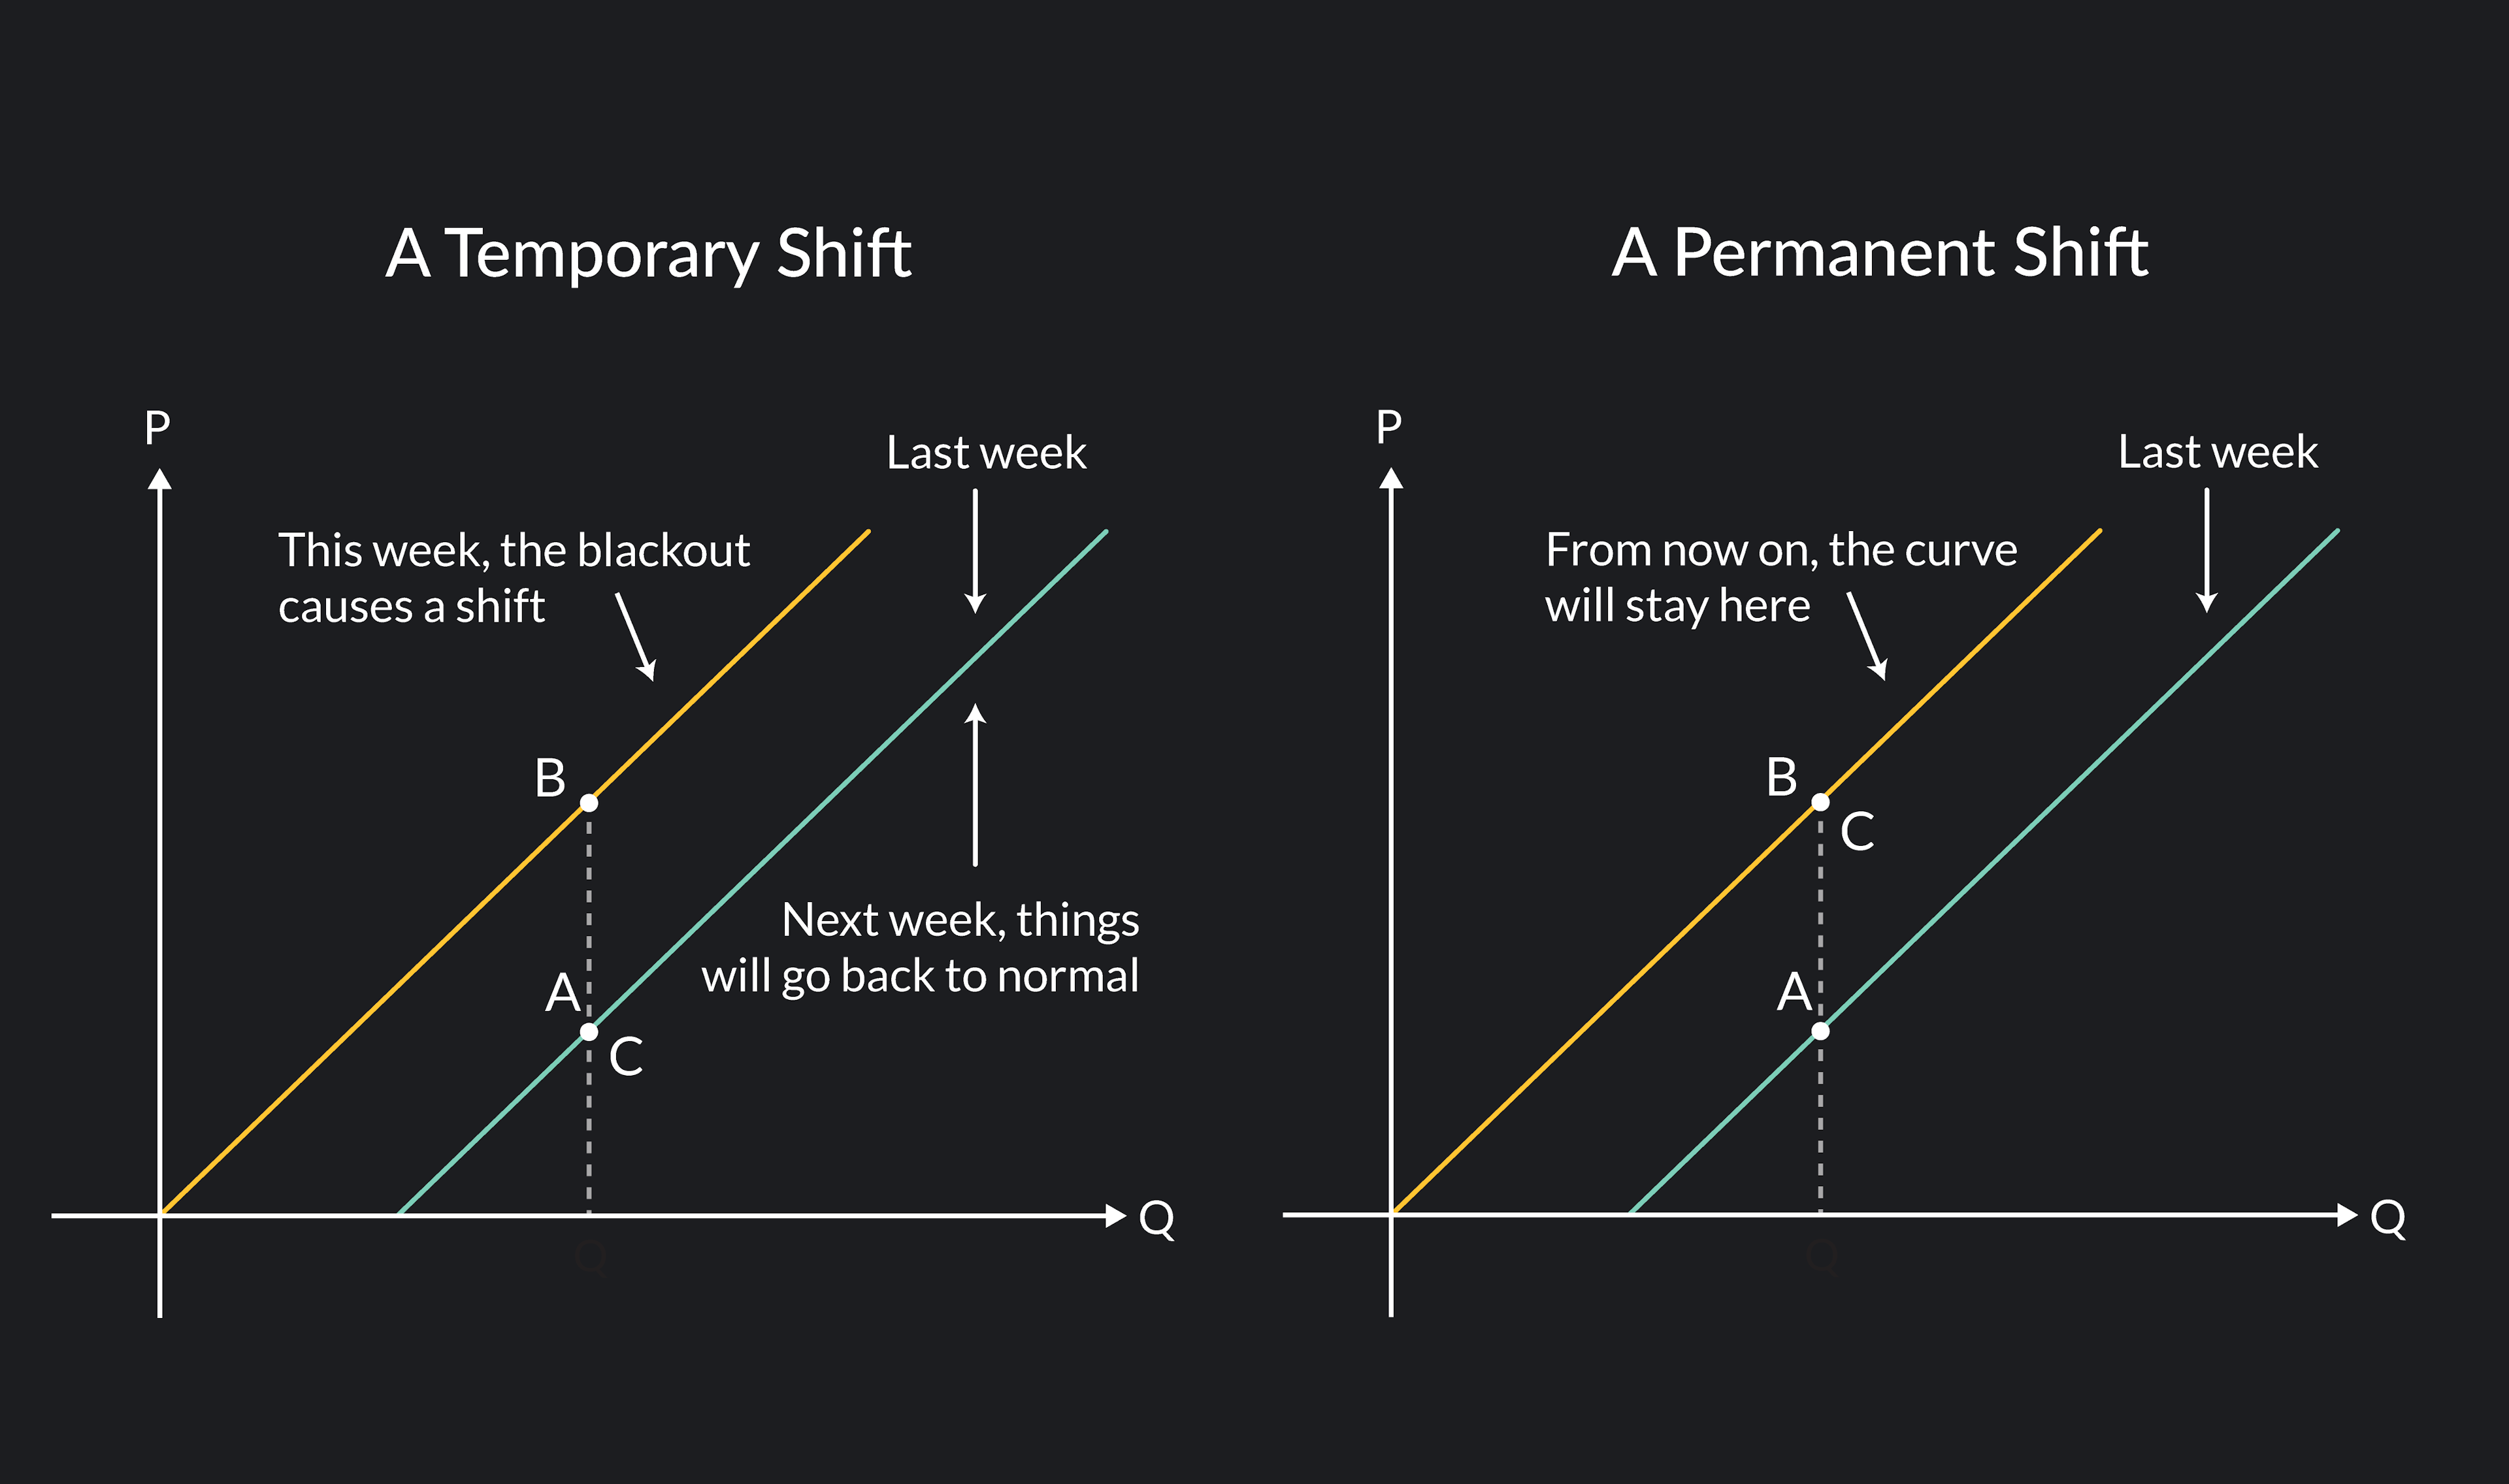
Last evening, while you were painting, a big storm hit the city and caused a blackout. While painting under the light of a candle might sound romantic, it won’t help your business if you make a mistake mess up your piece. The blackout extends for three days and during those days you will only be able to paint while there is sunlight. As a result, your production capacity will decrease this week. But the demand has not changed. If you have more than one customer but can only make one painting, one of them may offer to pay you a higher price to get the painting. This would cause the supply curve to shift to the left.
That was this week, but what do you think will happen next week when the electricity is repaired?
If you said, things should go back to normal, you are right! We have just seen that shifts on the supply curve can be either temporary or permanent. Whether the shift will fit in each category will strictly depend on the factor that is causing the shift itself.
Dr. Homa Zarghamee gives a good review on the theory of supply and the supply curve:
A Brief Introduction to the Law of Supply and Demand
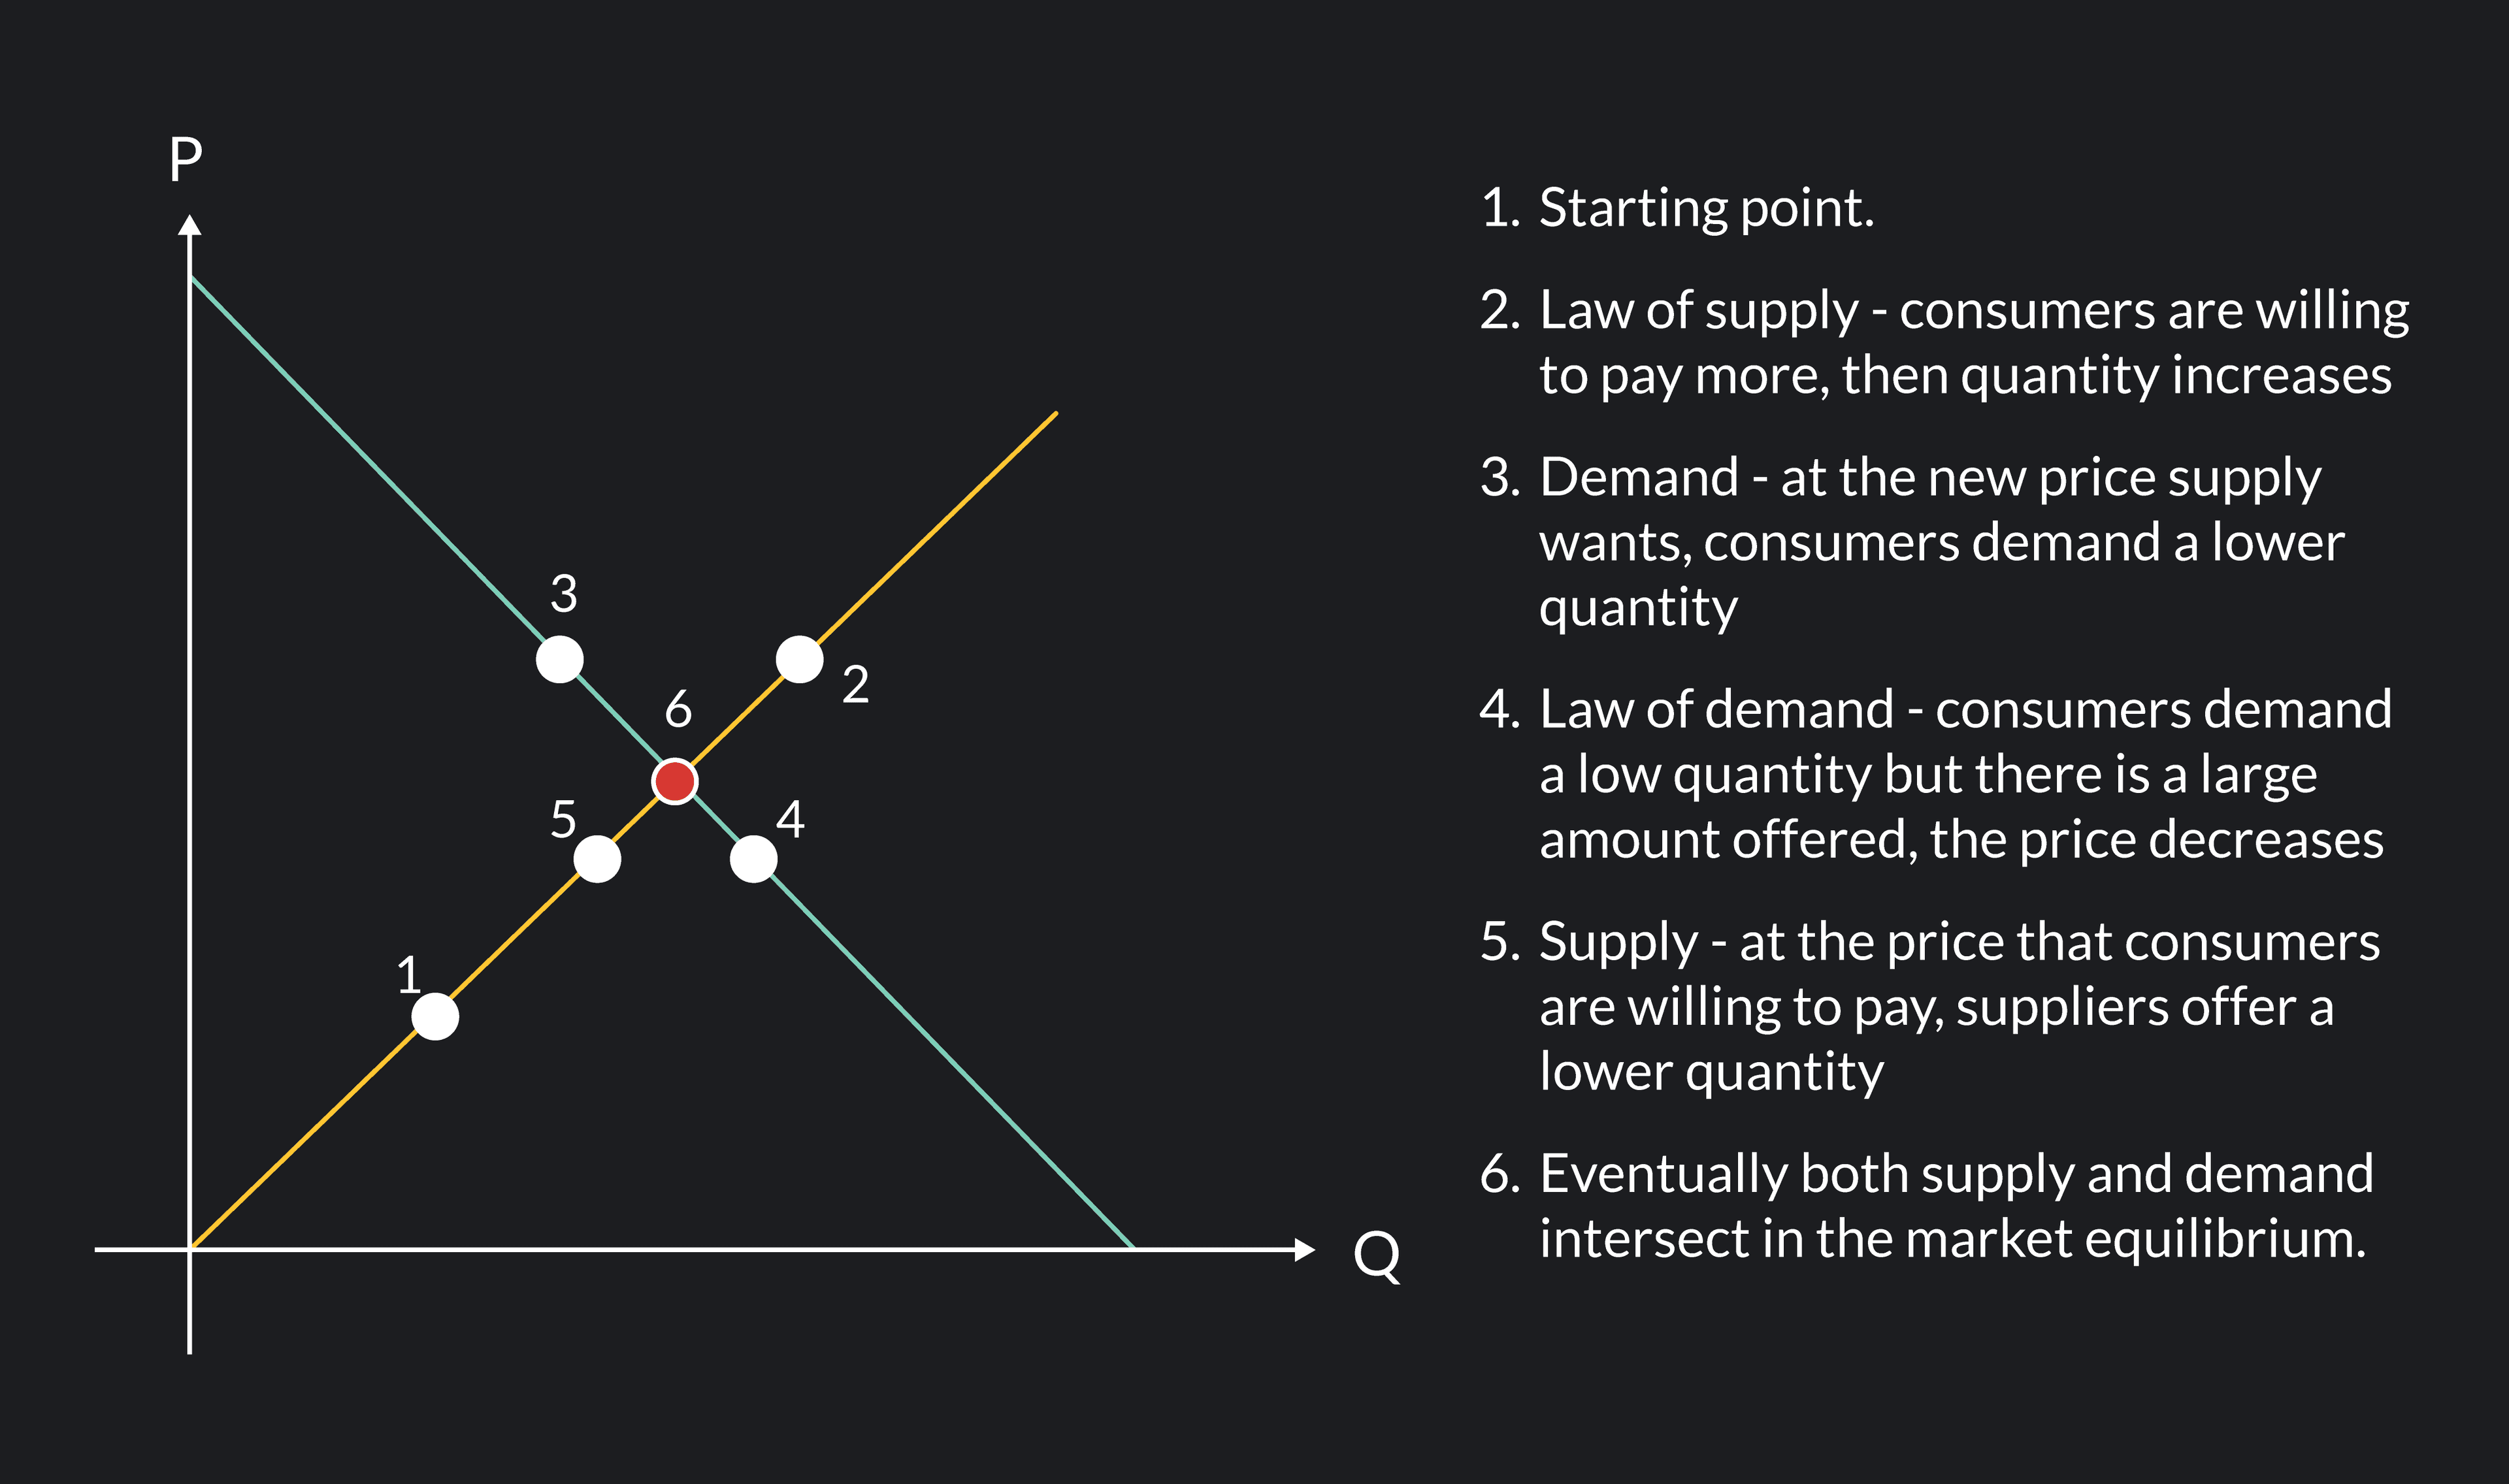
Now that we have gone over supply, it’s worth mentioning the next step: supply interacting with the demand. Earlier, we mentioned that for trade to occur, both supply and demand must be present. Once both agents are there, they must agree on a specific quantity to exchange (Q) and the price to pay for each unit (P).
The final set (Q,P) is what we call an equilibrium.
The question here is, which are the dynamics that lead to a specific equilibrium? These two dynamics are the law of demand and the law of supply.
The law of demand states that the higher the price in the market, the lower the quantity demanded.
The law of supply states that the higher the price in the market, the higher the quantity offered.
These two dynamics go in opposite directions. Why?
Concert Tickets and the Law of Demand
Let’s have a closer look at the law of demand. If there is less availability of a good, its value will rise. If there is a lot of availability, then the value will fall.
As an example, think of concert tickets for your favorite band, which are available at a specific price. The concert will be held in an arena with a capacity for 20,000 fans. Three days before the concert, you get a notification that the arena’s illumination system broke down, and the concert was canceled. You’re a mega fan, so you look at the tour dates and find out they will be presenting in another city less than two hours away, but there are two catches:
They will present in a theater with capacity for only 2,000.
You are not the only fan that found this out.
Would it be reasonable for you to pay a higher price given that there are fewer tickets available and a lot of people who want to attend the concert? This is the logic of the law of demand. What would have happened if the new concert was to be held in a stadium with a capacity for 60,000 people? Think about it, there would be a lot of tickets available and not that many fans wanting to buy them.
Concert Tickets and the Law of Supply
The law of supply follows a simple logic too. If people are willing to pay a lot for a product, the quantity offered will increase. If people are willing to pay a little, there won’t be a lot of the product being offered in the market.
Think about your favorite band again, they have just sold out three concerts in your city. Suddenly, they announce an extra concert that was not planned before, and tickets are way more expensive than before. Is this familiar to you? Well, that’s the law of supply!
Once the band offers a new concert and sells it out, why stop there? Why not another three? Why not at a higher price? You already know the answer. Eventually, there won’t be enough people willing to pay high prices for the tickets. Since there would be a lot of availability, the price level would have to go down.
Equilibrium
The laws of supply and demand will push and pull until both the supply and demand curves find a place to coincide. That place is the market equilibrium, where quantity supplied and quantity demanded are equal. Here, supply and demand are balanced.
Outlier (from the co-founder of MasterClass) has brought together some of the world's best instructors, game designers, and filmmakers to create the future of online college.