
Economics
Understanding the Supply Curve & How It Works
Learn about what a supply curve is, how a supply curve works, examples, and a quick overview of the law of demand and supply.
Alejandro Diaz Herrera
Subject Matter Expert

Economics
06.06.2022 • 7 min read
Subject Matter Expert
Learn what economic efficiency is, its relationship with demand and supply, and efficiency and equilibrium in competitive markets.
In This Article
Since there are scarce resources for producing all goods and services, economics is concerned with achieving maximum output. Economic efficiency means that the economy is producing the most utility, i.e. the highest possible well-being for society, given the resource constraints. As we'll see in this article, economic systems with perfect competition and free markets promote efficient allocation of resources so that we can achieve economic efficiency.
Although we use the word efficiency in everyday life, when we use it in microeconomics, it can also have a pretty technical and specific meaning. It means that it is impossible to increase the benefit of one party without imposing a cost on another party. Thus inefficient means that it’s possible to benefit one party without necessarily costing another party. This definition will make more intuitive sense with our examples later on, as we'll see that when a market economy is at equilibrium, it is efficient. That is simply because, at equilibrium, any marginal benefit for one party must cause a loss for the other party.
A central principle in macroeconomics is that market forces cause allocative efficiency. When individual firms are incentivized to supply goods or services to a market, not only is there optimal allocation of resources but there is also a greater level of productive efficiency. As firms compete to provide goods to a market, they must also find ways to produce at the lowest cost of production.
Market equilibrium is an ideal state where there is an equal amount of buyers and sellers. This state might never happen; however, the critical point for economists is that the economy as a whole is in constant flux towards equilibrium. The closer the market moves towards equilibrium, the more efficient it is. This is because equilibrium indicates that all production inputs are allocated in an optimum way so that the economy produces the most output with the least social cost.
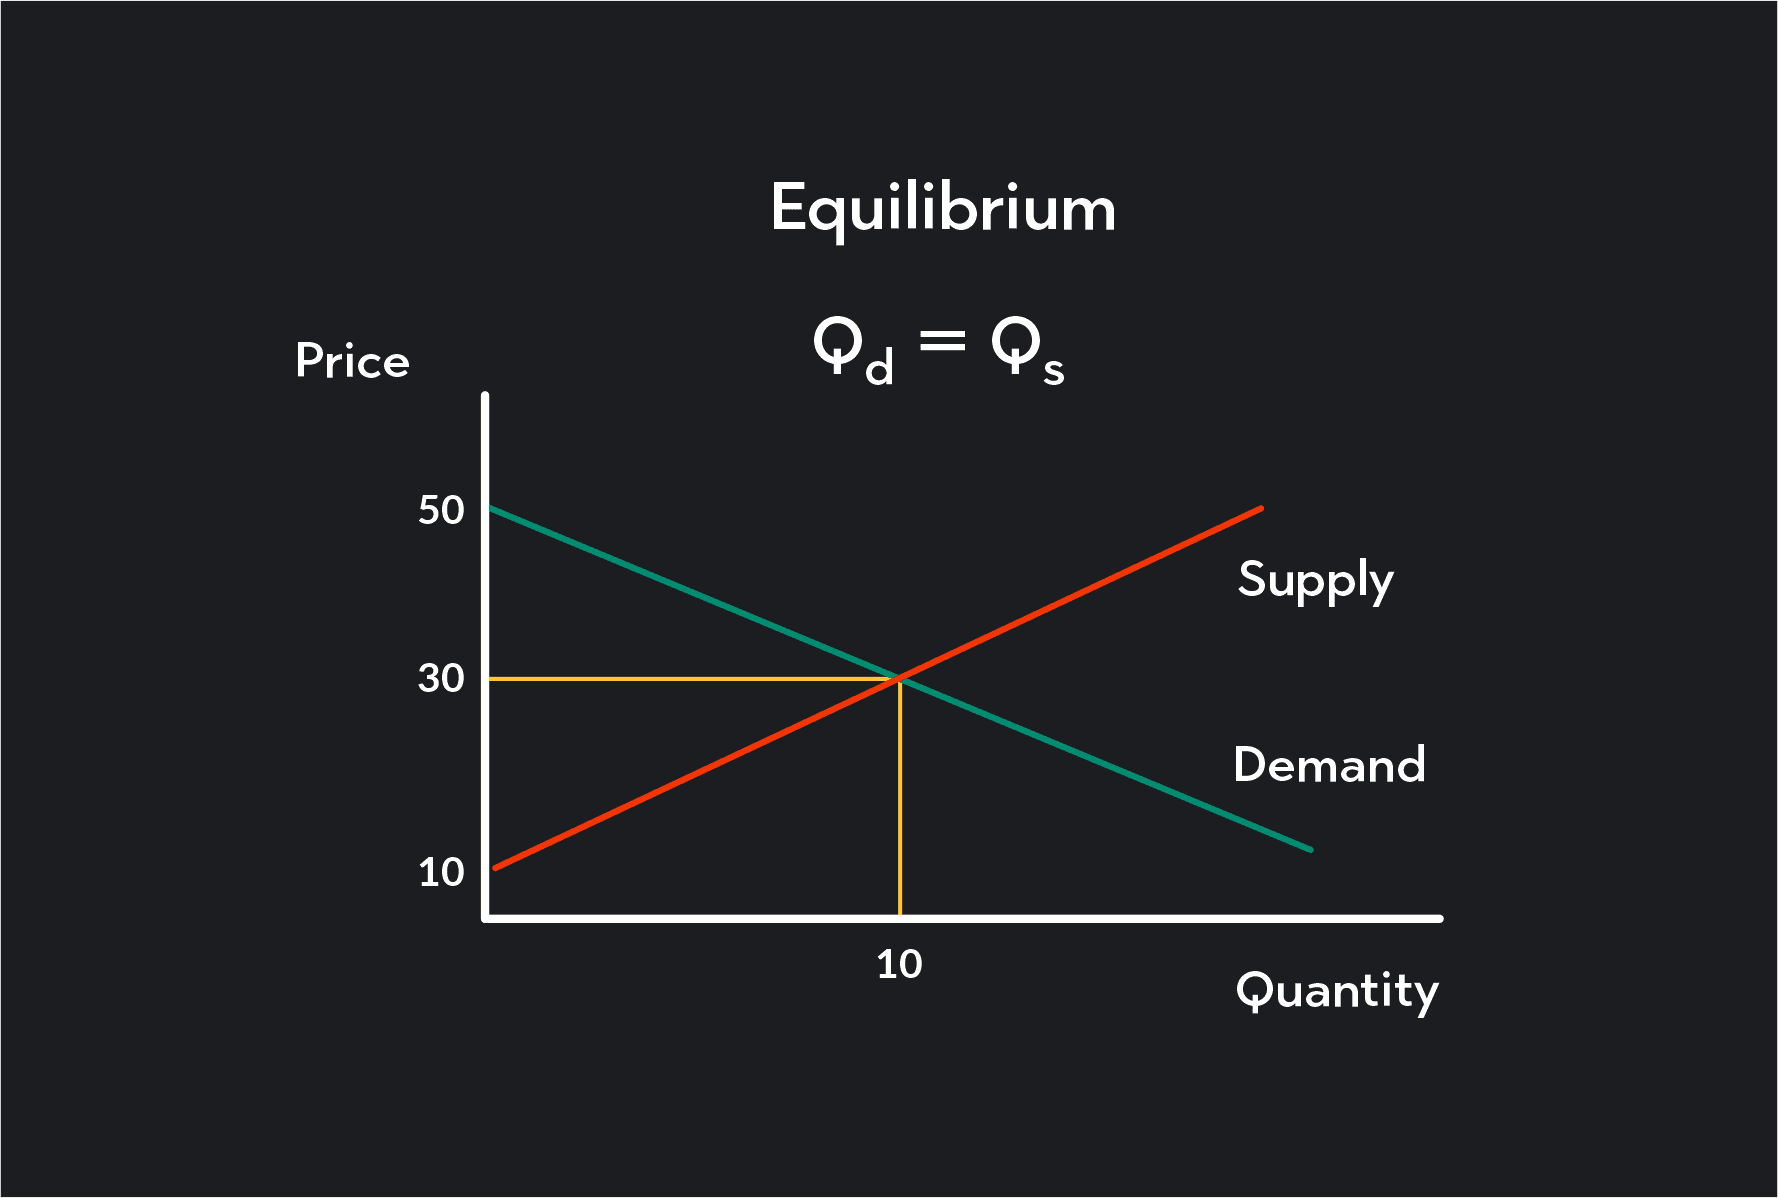
Demand and supply diagrams can help us understand economic efficiency. Demand and supply curves indicate the desirability of buyers and sellers at each price point. The equilibrium price and quantity on a supply and demand graph indicate that the quantity supplied is precisely equal to the demand. This means the market is efficient since the correct amount of goods are produced to satisfy the demand.
When the market price is not at equilibrium, the market is inefficient. A deviation from equilibrium indicates either too much or too little supply.
How can we know what the most efficient level of production is? Let's use the market for laptop computers to help us understand how a free market achieves economic efficiency.
In the graph below, the equilibrium price for a laptop is $400, and the equilibrium quantity is 32 million. The area (a) beneath the demand curve and above the equilibrium point represents consumer surplus. This area in the graph shows us that some consumers are willing to pay more than $400 for a laptop. For instance, at point j on the graph, the price for a laptop is $450 and the quantity of demand is 22 million. This means that consumers who would have been willing to pay up to $450 for a laptop but instead were able to buy it at the equilibrium market price of $400 received a surplus benefit. They got the same utility for $400 instead of paying $450.
Since the demand curve reflects consumers' willingness to pay at all different price points, the total amount of money consumers are willing to pay minus the amount they actually pay is referred to as consumer surplus. The graph shows that area a, which is above the market equilibrium price and beneath the demand curve, represents the total consumer surplus.
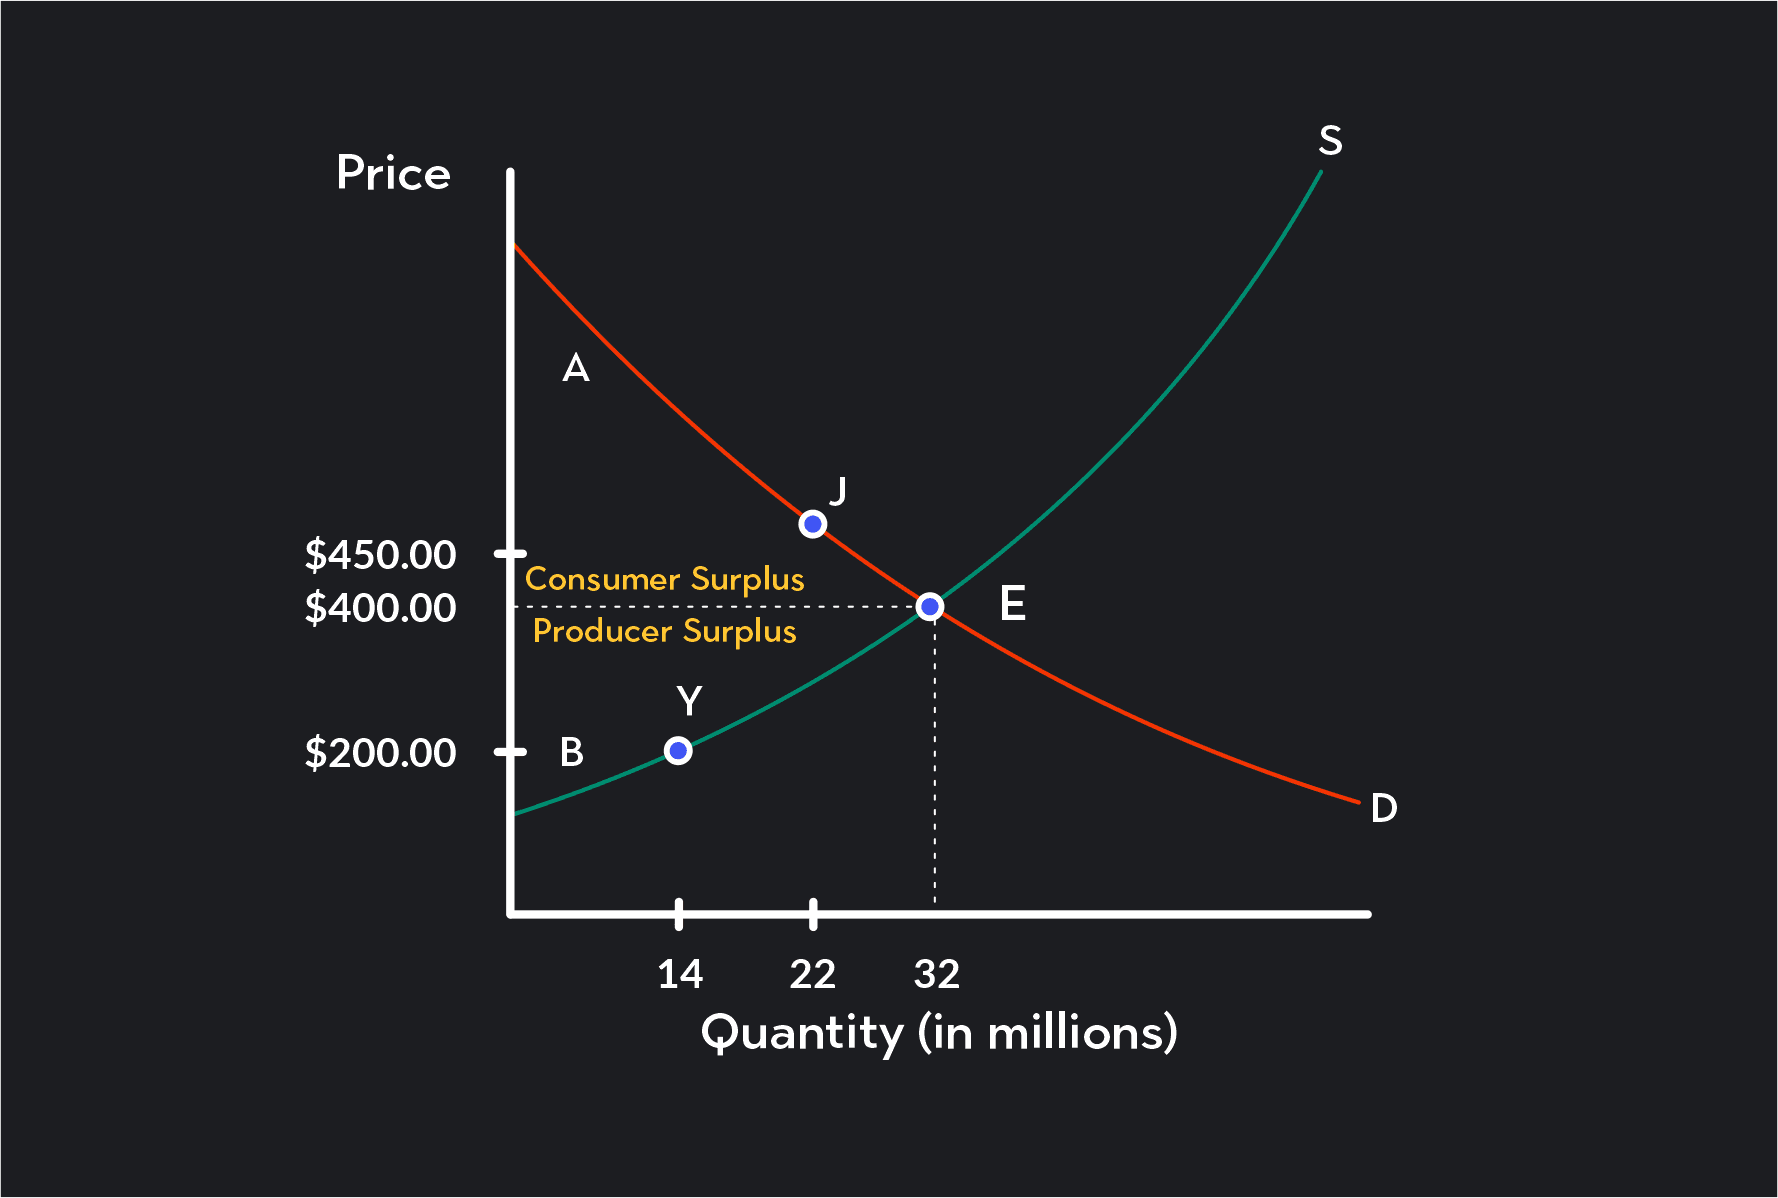
Like we calculated consumer benefit on the demand side of the market, we can do it on the supply side to get the producer surplus. The supply curve shows the quantity of units that firms are willing to supply at each price point. For instance, at point Y in the graph, if laptop computers were only able to sell for $200, there would still be suppliers ready to produce but only up to 14 million laptops. This means that the producers who were willing to supply at $200 but instead could sell at the market equilibrium price of $400 received a surplus benefit. This is because they received more money than they required to supply the market with laptops.
The amount of money paid to the seller minus the cost of production is called producer surplus. The graph shows that area B, which is below the equilibrium price and above the supply curve, is the total producer surplus.
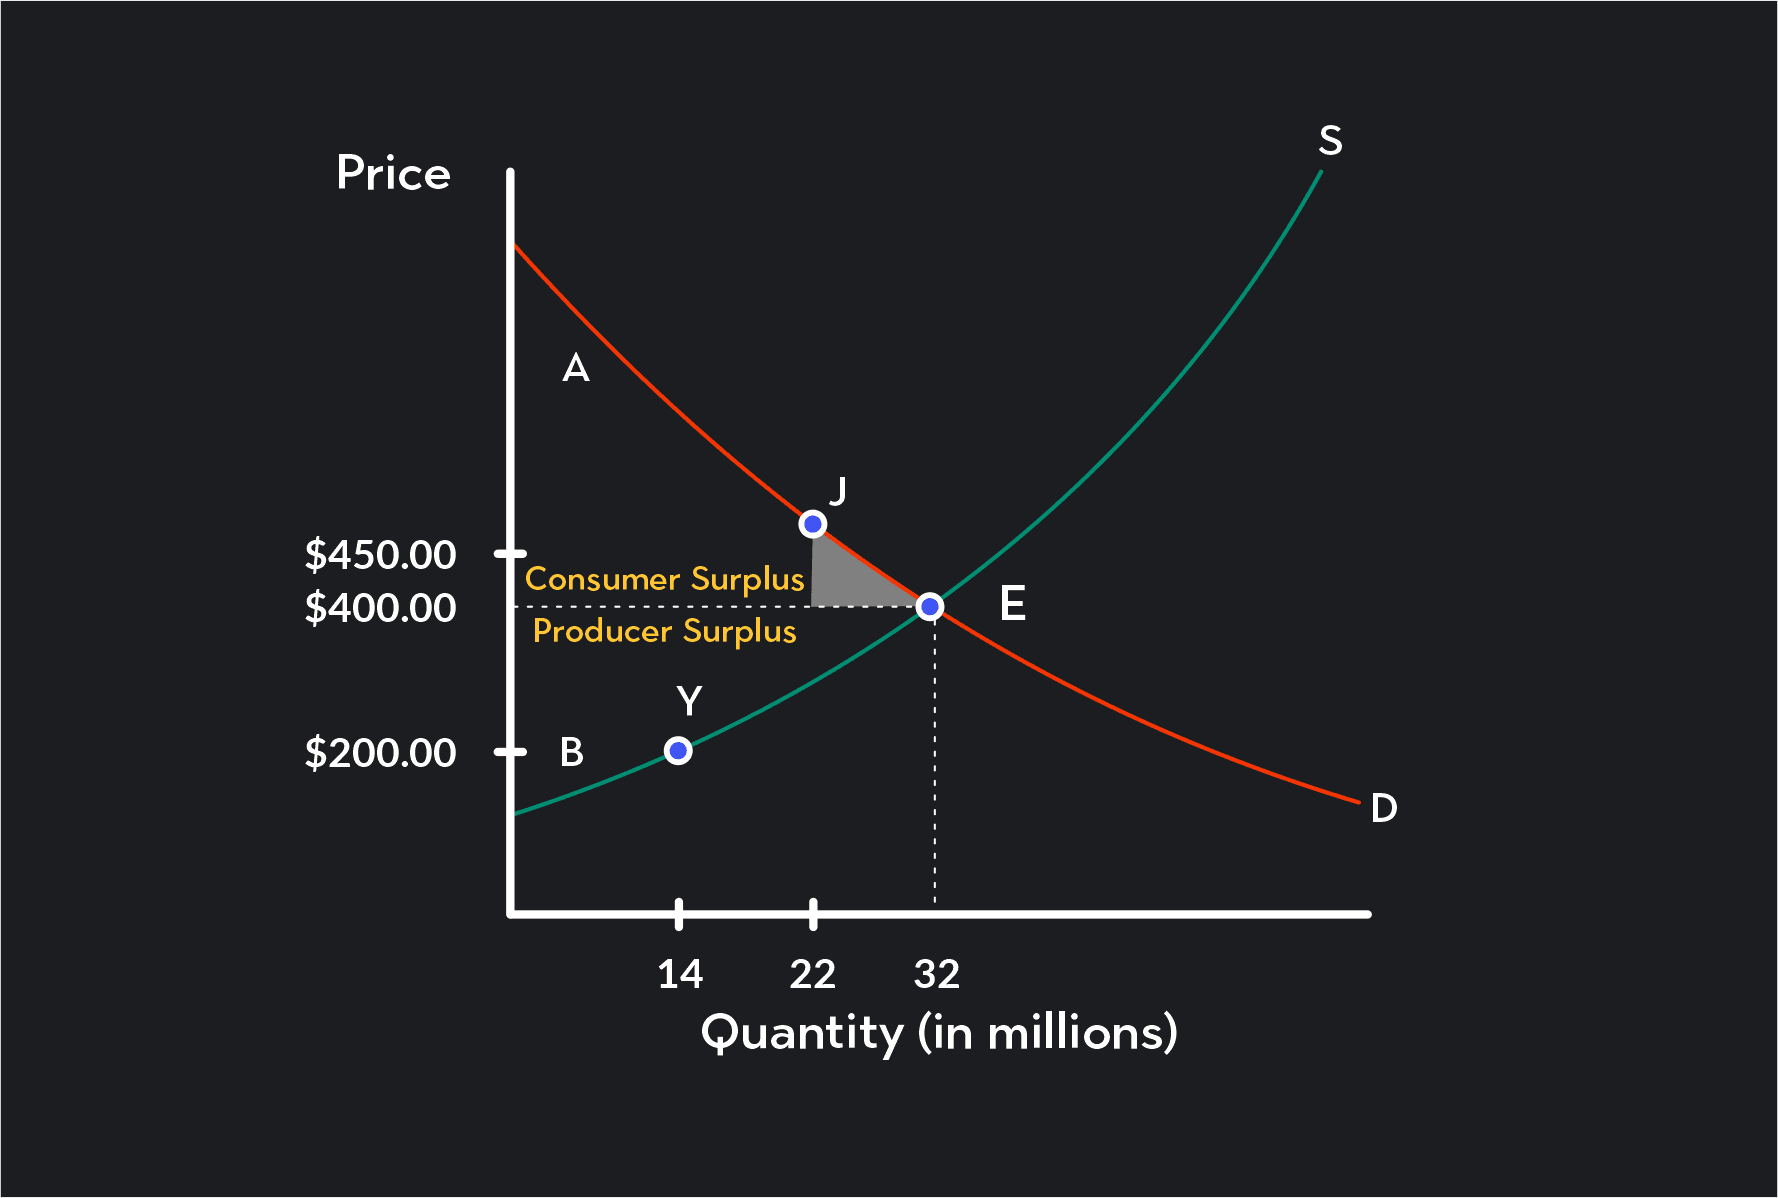
We get the social surplus by combining consumer and producer surplus (A + B). We also referred to this as economic surplus. You will notice that the social surplus will be the largest whenever the market is at the equilibrium price and quantity. If the price moves away from E, then there will be a deadweight loss, which means either too much or too little is produced. In other words, there is an inefficiency since resources are not optimally allocated to create the best output.
In our example of laptop computers, we can see that when the price moves from $400 to $450 (j), some consumer surplus becomes producer surplus. But more importantly, at point j, you will notice that we lose some surplus due to the inefficiency. In a perfectly competitive market, the equilibrium point of supply and demand reflects the greatest amount of efficiency that can be achieved. So any time the price moves away from E, there will be some utility lost either on the demand side or the supply side of the market.
Economists' technical definition of efficiency now makes more sense: at the efficient level of output, producer surplus can't grow without diminishing some consumer surplus and vice versa. This happens because all factors of production are used in an optimum manner.
A price floor or ceiling will prevent a market from adjusting to its equilibrium price and quantity and causes inefficiency. In addition, price floors and ceilings will shift some surplus from consumers to producers or from producers to consumers. This is why price controls are often said to cause a market failure.
To understand this, let's introduce a price ceiling and price floor to our market of laptop computers and see what happens to the consumer and producer surplus and total economic surplus. Price floors are usually imposed in labor markets (minimum wage) or agriculture. Price ceilings are used to make things more affordable (medicine). In reality, a market for computers would probably never have price controls, but for simplicity, we’ll continue with our example of computers.
Let's imagine the government imposes a price ceiling of $200 to make laptops affordable to more people. We can see in the graph that at the price ceiling of $200 market supply will only be 15 million.
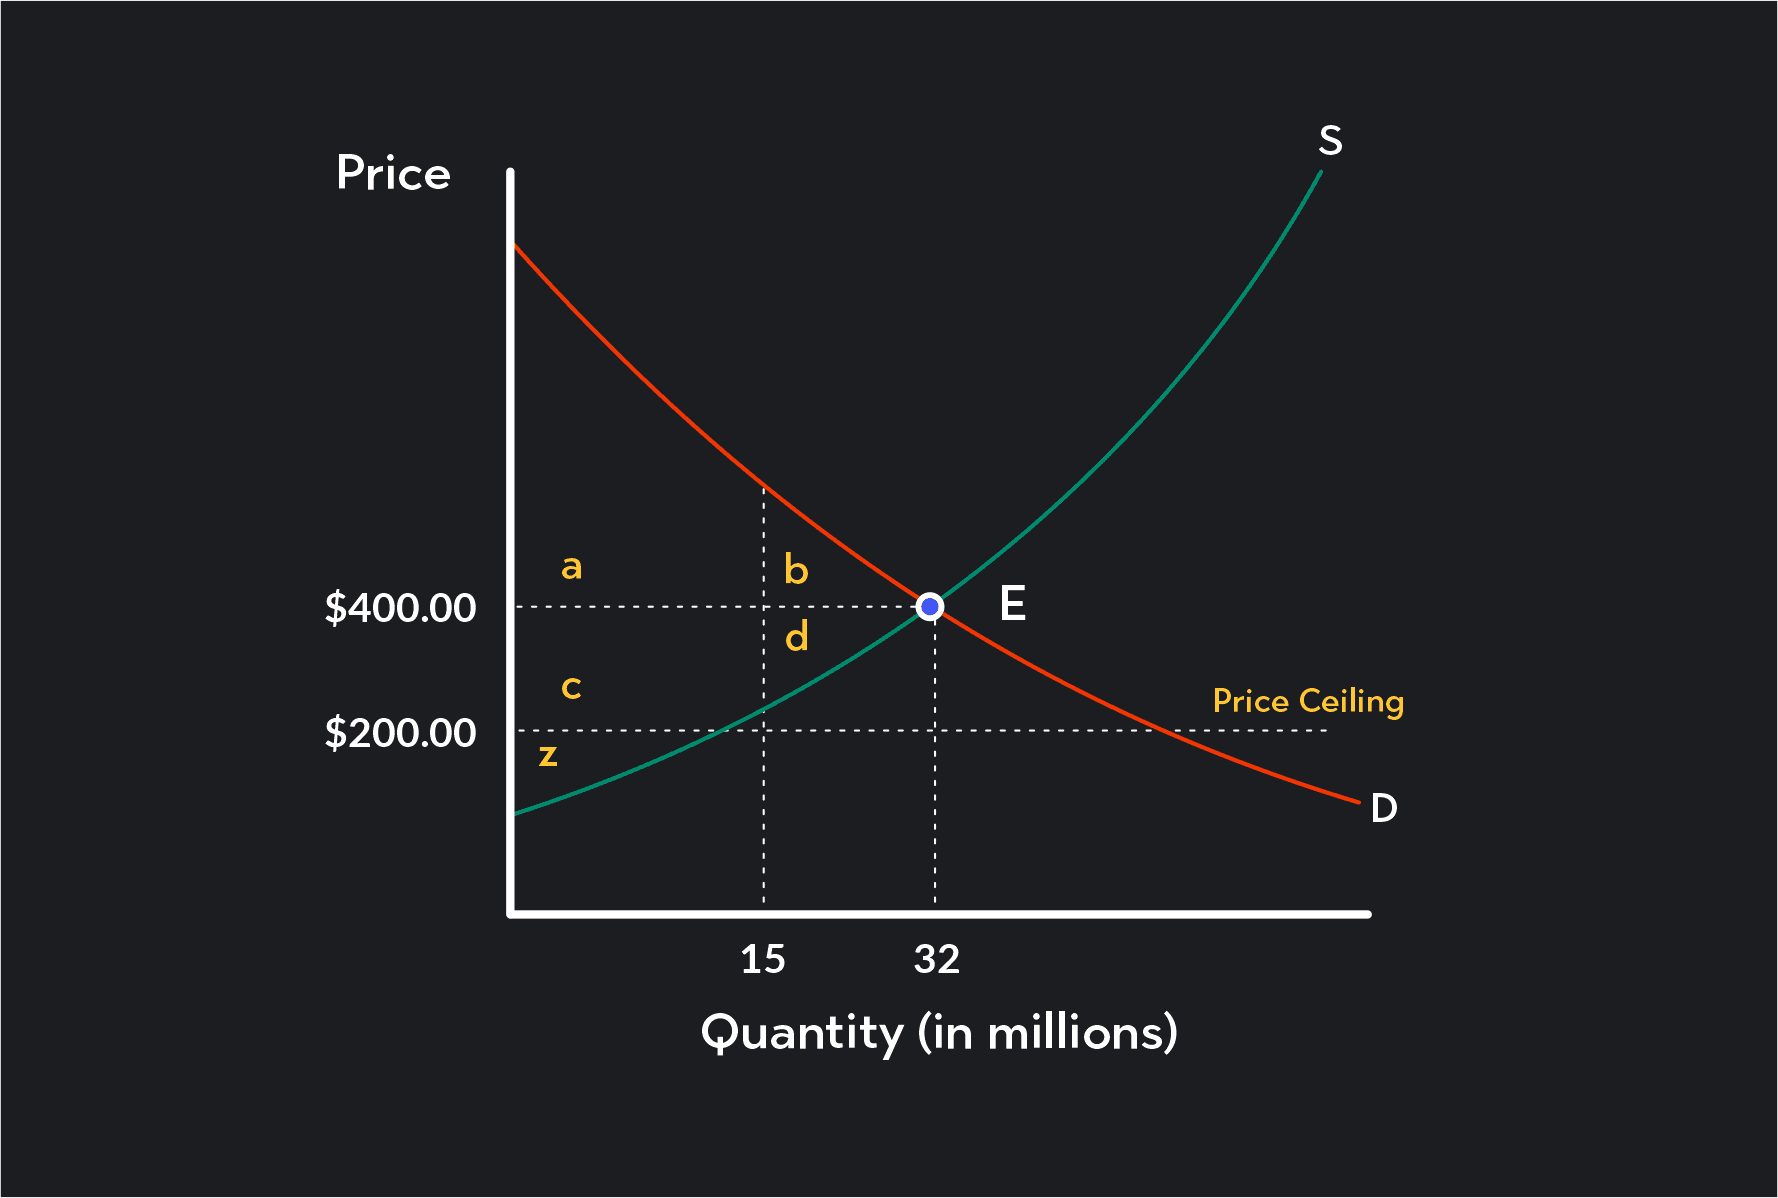
The price ceiling causes two things:
1) The market becomes inefficient as we can see the total social surplus is reduced. Economists call this a deadweight loss. The area a+b becomes dead weight. This means that some resources are wasted since, without the price floor, more suppliers would have been willing to sell laptops. Thus the social surplus is diminished as an outcome of the price ceiling.
2) A price ceiling transfers some of the producer surplus, area C in the graph, to consumer surplus. But notice that the gain in consumer surplus is less than the loss of the producer surplus. This indicates a deadweight loss happened and the market is inefficient.
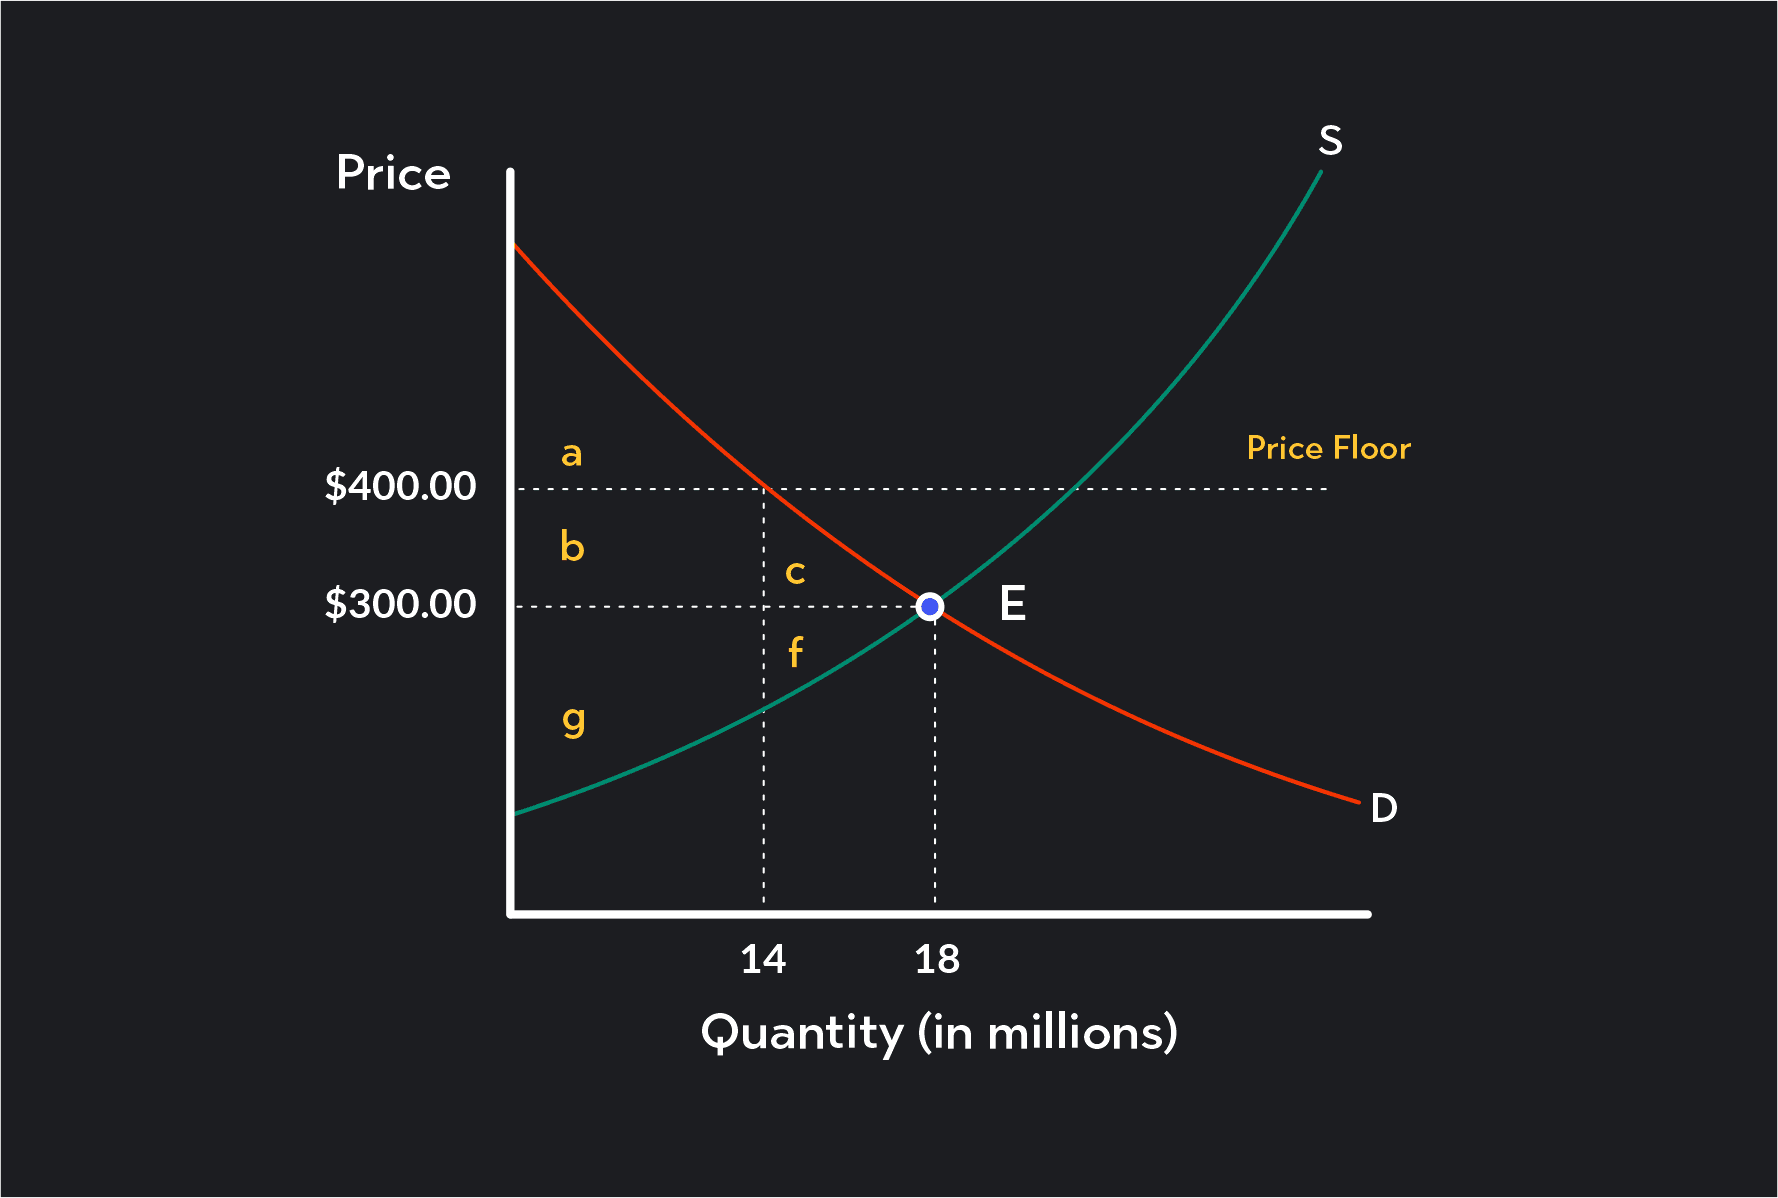
The same idea will apply to price floors. In the graph, we see:
The current equilibrium is $300 per laptop, and the market demand is 18 million. The original consumer surplus is a+b+c, and the producer surplus is f+g.
If we impose a price floor at $400, the market demand will fall to 14 million and the new sum of consumer surplus will be A, and the new producer surplus will be b+g. The price floor causes area B to transfer from consumers to producers. But these price controls also reduce the total surplus by causing a deadweight loss of c+f. That is why price controls are often disruptive to the concept of efficiency
Outlier (from the co-founder of MasterClass) has brought together some of the world's best instructors, game designers, and filmmakers to create the future of online college.
Check out these related courses:


Economics
Learn about what a supply curve is, how a supply curve works, examples, and a quick overview of the law of demand and supply.
Subject Matter Expert

Economics
This article gives a quick overview of perfect competition in microeconomics with examples.
Subject Matter Expert

Economics
This article is a comprehensive guide on the causes for a demand curve to change. Included are five common demand shifter examples.
Subject Matter Expert