Learn what social surplus is and its importance in microeconomics. Also learn how to calculate it and its relationship with consumer and producer surplus.
Social surplus are the total benefits gained by sellers and buyers in a market. It’s also called total surplus, gains from trade, or economic surplus.
It is equal to the sum of consumer surplus and producer surplus.
Social Surplus = Consumer Surplus + Producer Surplus
From a microeconomic perspective, social surplus relates to the sum benefits buyers and sellers gain in one specific market of goods or services. From a macroeconomic perspective, we aggregate all the economic welfare produced by trade to get the social surplus.
Consumer Surplus, Producer Surplus, and Social Surplus
To calculate social surplus, we first have to calculate consumer and producer surplus since social surplus is the sum of them both.
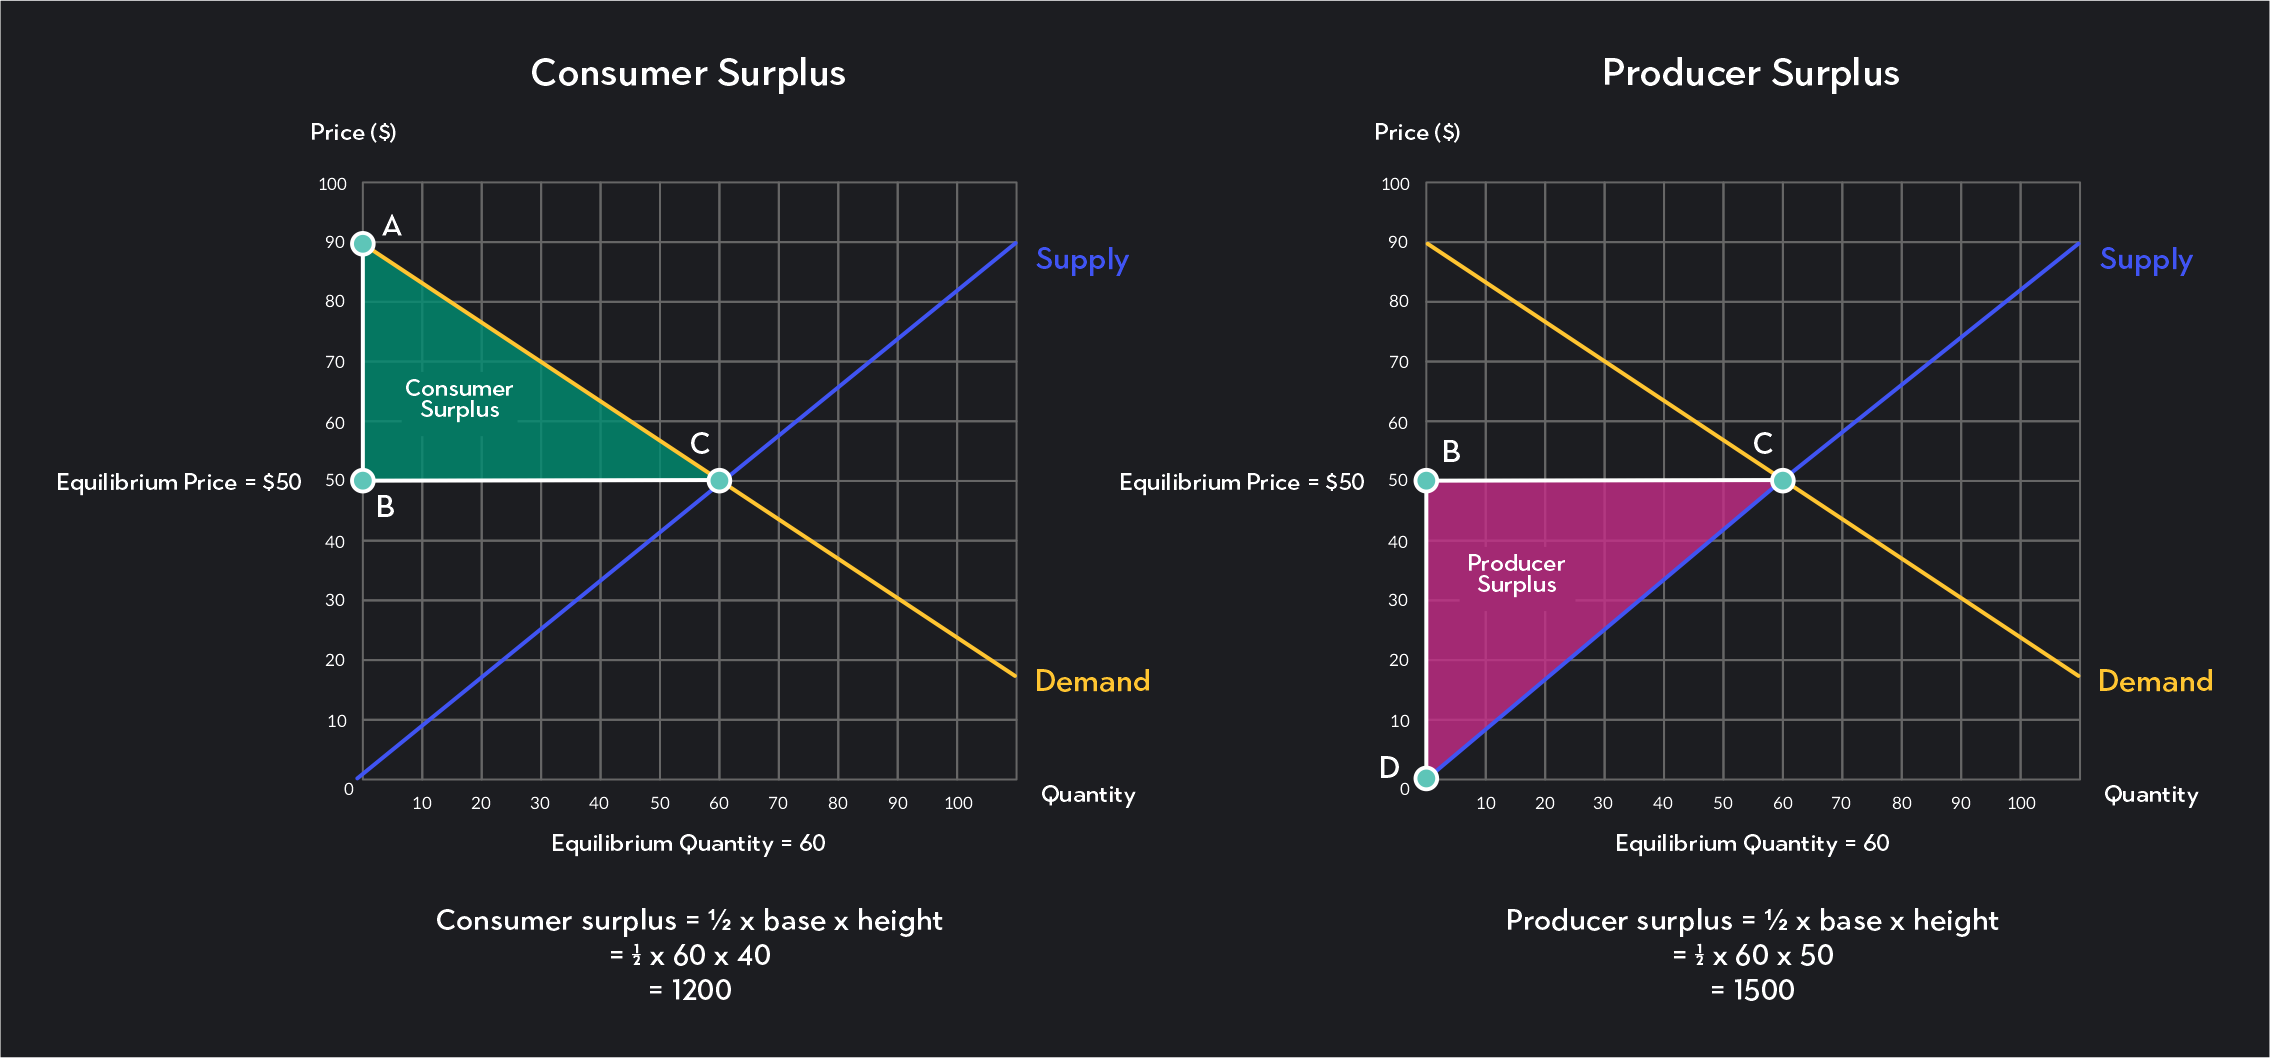
Consumer Surplus
In a market, consumers willing to pay more than what they actually pay earn a consumer surplus.
For an individual buyer, consumer surplus equals the maximum price the consumer is willing to pay minus the price they actually pay.
On a supply and demand graph with linear supply and demand curves, total consumer surplus is represented by the triangle formed by the vertical axis of the graph, a horizontal line drawn at the market price, and the demand curve.
To calculate the value of total consumer surplus, all you have to do is find the area of the consumer surplus triangle using the equation for the area of a triangle: 21x base x height.
Producer Surplus
Sellers in a market who sell at a higher price than what they are willing to sell for earn a producer surplus.
For an individual seller, producer surplus equals the market price minus the minimum price the seller would be willing to accept.
In a demand and supply model with linear supply and demand curves, total producer surplus is represented by the triangle formed by the vertical axis, a horizontal line drawn at the equilibrium price, and the supply curve.
Similar to consumer surplus, you can calculate the value of total producer surplus by finding the area of the producer surplus triangle.
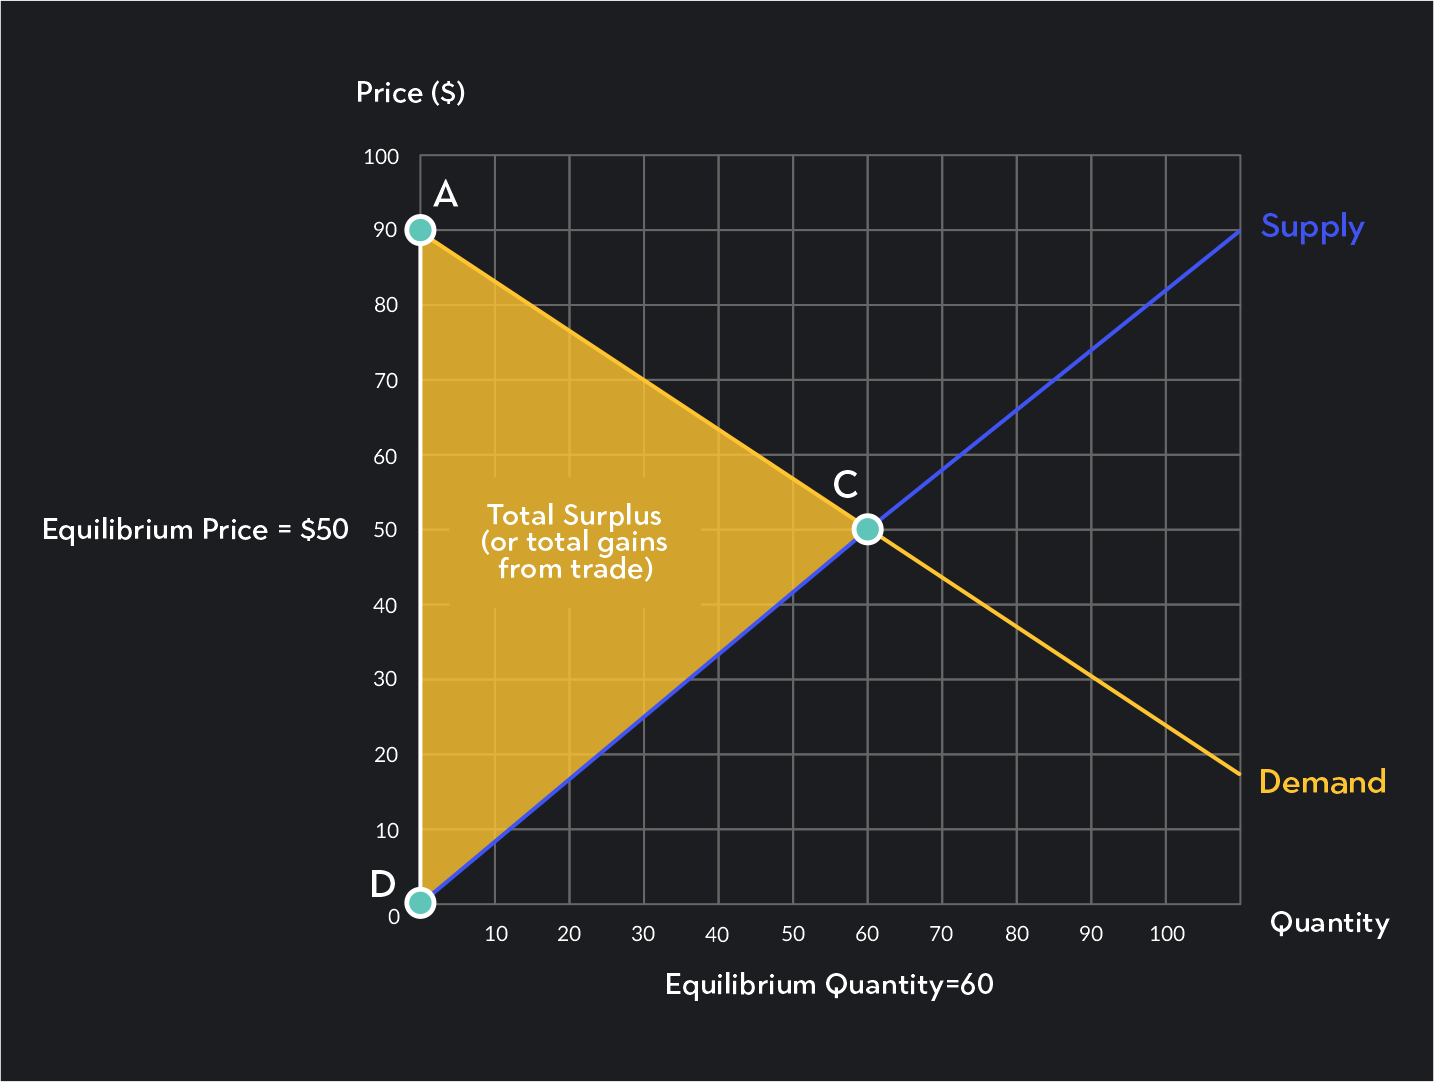
Social Surplus
Social surplus is the combined total of consumer and producer surplus in the market.
On a supply and demand graph with linear supply and demand curves, social surplus is the sum of consumer and producer surplus. It is represented by a triangle formed by the vertical axis, the demand curve, and the supply curve.
To calculate total surplus, you can calculate the area of the total surplus triangle. If you already know what consumer and producer surplus are, you can simply add the two values together.
Perfect Competition, Economic Efficiency, and Social Surplus
Social surplus in a market represents the total gains from trade that result from exchanges in the market. These gains would not exist in the absence of buyers and sellers transacting in the market.
As we know, demand and supply curves indicate the behavior of buyers and sellers at each price point; the demand curve shows us how many units consumers are willing to buy at each price point; and the supply curve shows us how many units sellers are willing to sell at each price.
In a competitive market, when price and quantity are in equilibrium, the quantity supplied is precisely equal to the quantity demanded. This means the market reached economic and allocative efficiency since the maximum amount of goods are produced to satisfy the demand without wasting any scarce resources.
In a perfectly competitive market without negative externalities, the market equilibrium price and quantity is also the point where social surplus is maximized.
As we will see in the graphs below, any other variation in price and quantity will reduce the total surplus. This is because at equilibrium, no deadweight loss exists—i.e. wasted resources.
As we will see later, government intervention in markets that enforce price ceilings or price floors will create a deadweight loss. We will use examples of a specific supply diagram to see how these price controls cause deadweight loss, reducing the total social surplus of a market.
No other point in a perfectly competitive market is efficient, and no other combination of price and quantity will maximize total surplus.
Consider the following to see some examples of why this is the case.
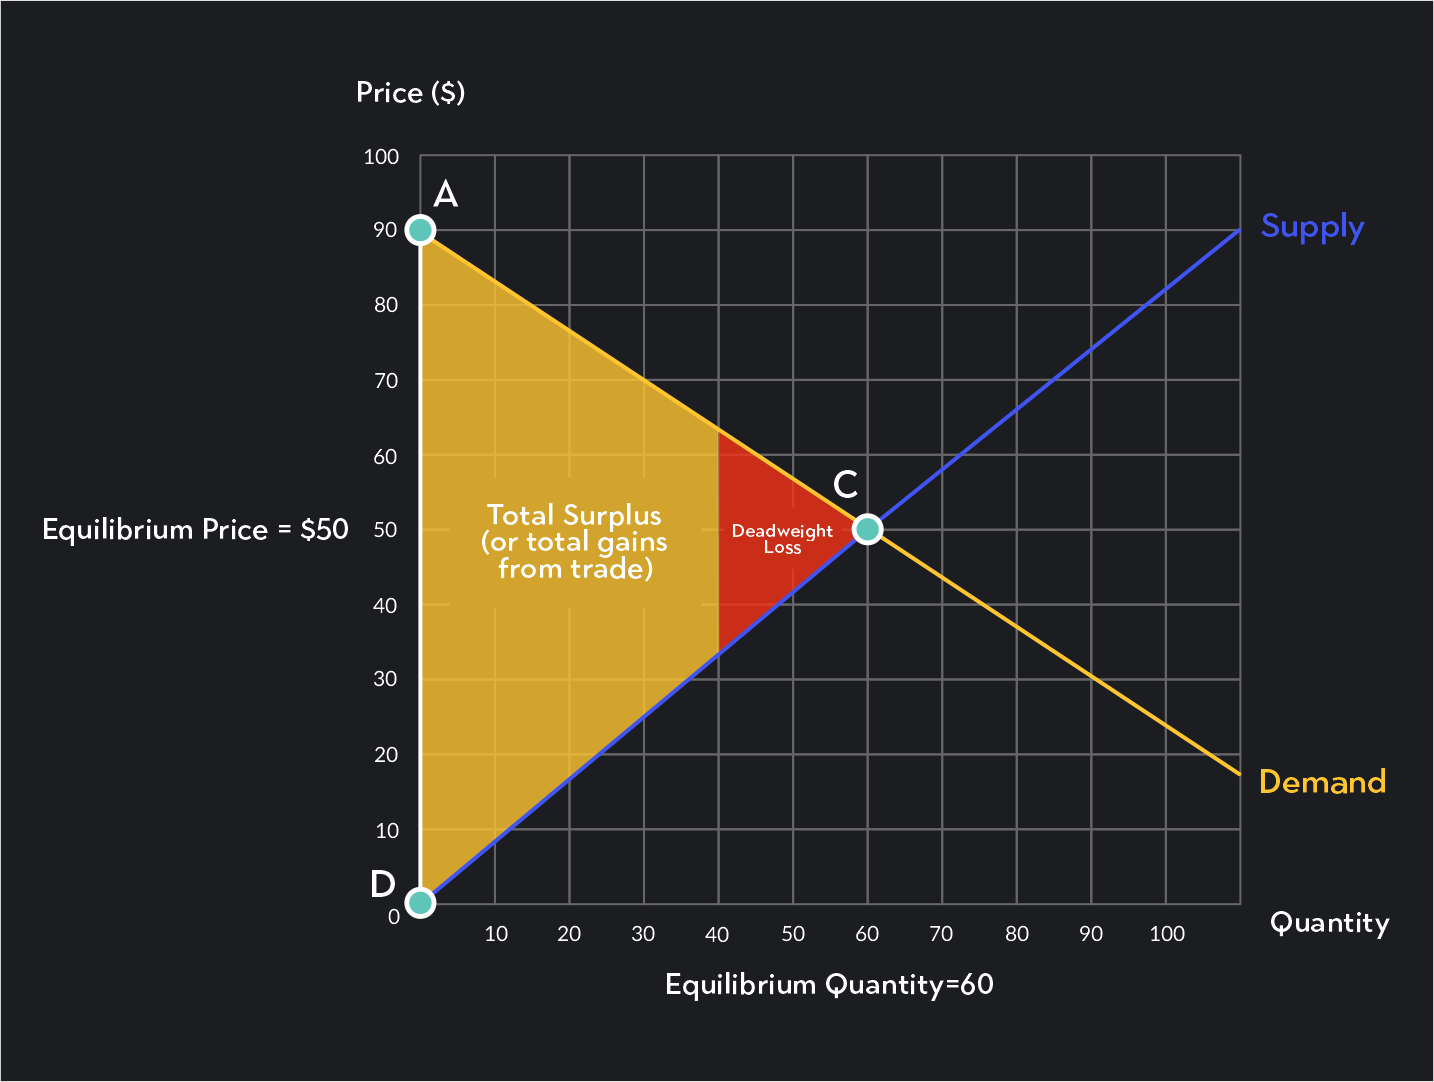
If the quantity sold is less than the equilibrium quantity, buyers and sellers will be left out of the market who could otherwise gain from exchange. This creates a deadweight loss and an inefficient outcome.
In the graph, the equilibrium quantity is 60 units. If, instead, the market only sold 40 units of the good, the sellers and buyers of the 41st to 60th unit would be forced out of the market. The producer and consumer surplus that these buyers and sellers would have gained is now a deadweight loss.
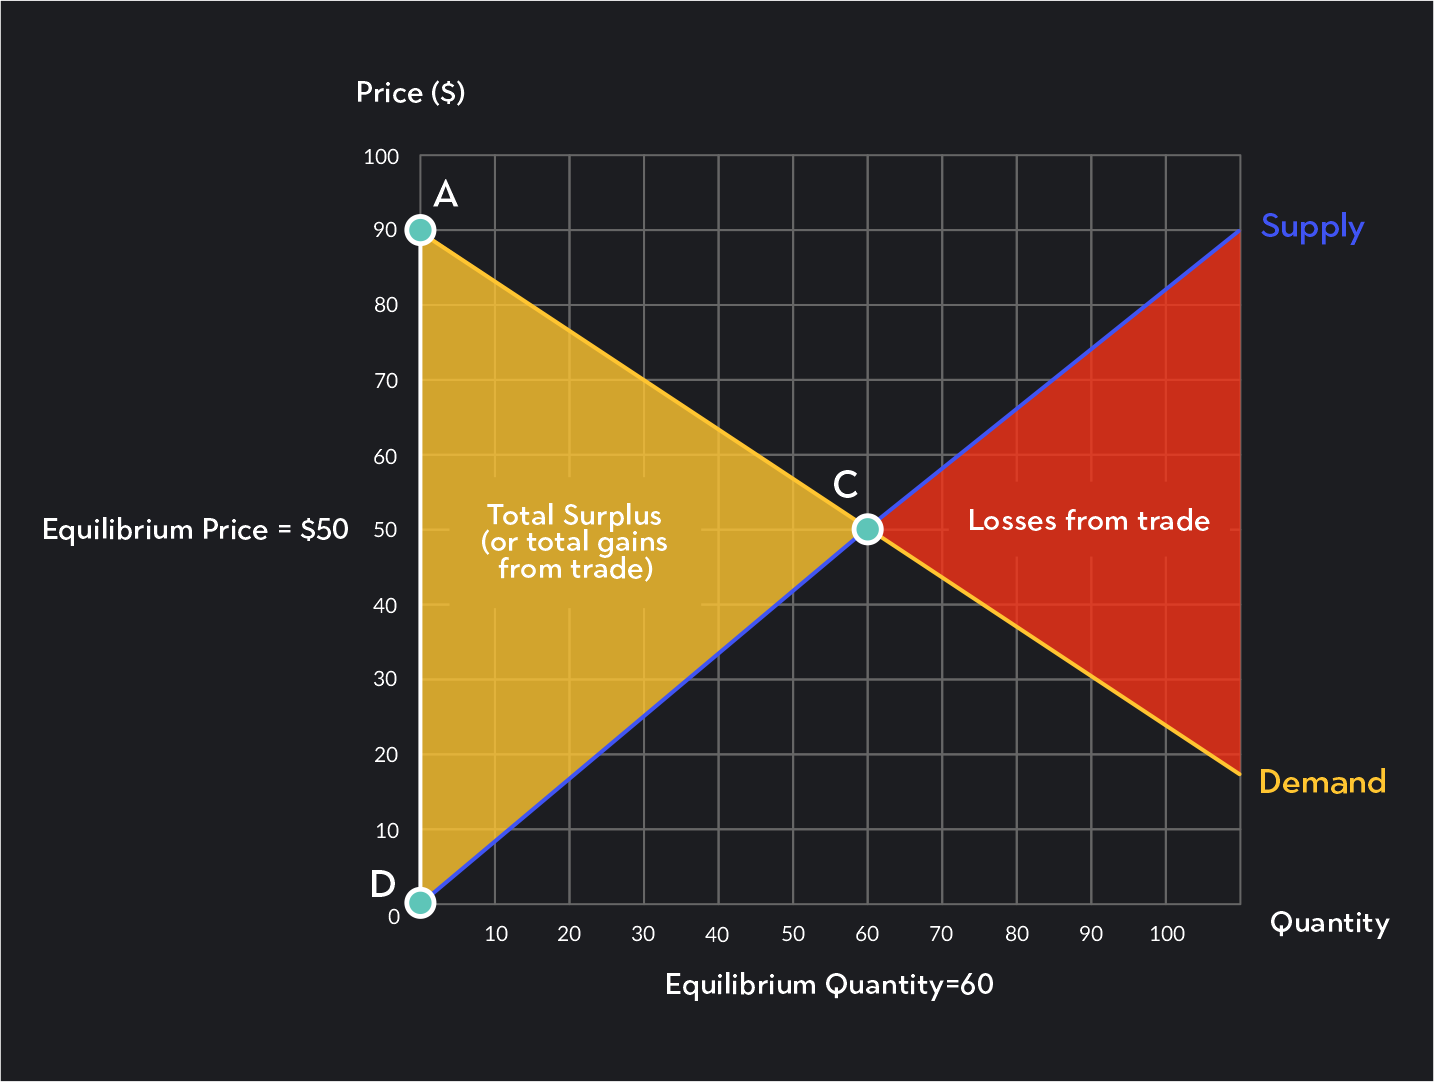
If any quantity above the equilibrium quantity is sold, buyers and sellers will begin to experience losses as well. The price that sellers are willing to accept for quantities beyond the equilibrium quantity is greater than what buyers are willing to pay.
What Are Price Floors and Ceilings?
When perfectly competitive markets are in equilibrium, total surplus is maximized. However, as we saw, markets can deviate from the equilibrium and result in lower levels of surplus that are economically inefficient. This can happen through policies economists call price floors and price ceilings.
Outlier.org instructor Dr. Homa Zarghamee of Intro to Microeconomics explains the government set a price ceiling and price floor for goods:
Price Floors
A price floor is a policy that limits how low the market price can be. If a price floor is set above the equilibrium price, it will increase the price and decrease the number of goods or services sold in the market.
Price floors impact social surplus in two ways.
1. Deadweight Loss
At the high price imposed by the price floor, some buyers are forced out of the market (their willingness to pay is now lower than the new price imposed by the price floor). With fewer buyers in the market, some sellers are also forced to exit the market (they won’t be able to find buyers). As buyers and sellers exit the market, producer and consumer surplus decreases, which lowers social surplus.
2. Transfer of Surplus from Consumers to Producers
A transfer of surplus from consumers to producers also exists. Remember, higher prices benefit producers and harm buyers. At the new and higher price imposed by the price floor, consumer surplus—for the buyers remaining in the market—is reduced.
Producer surplus for the sellers who remain in the market increases by the amount consumer surplus is reduced.
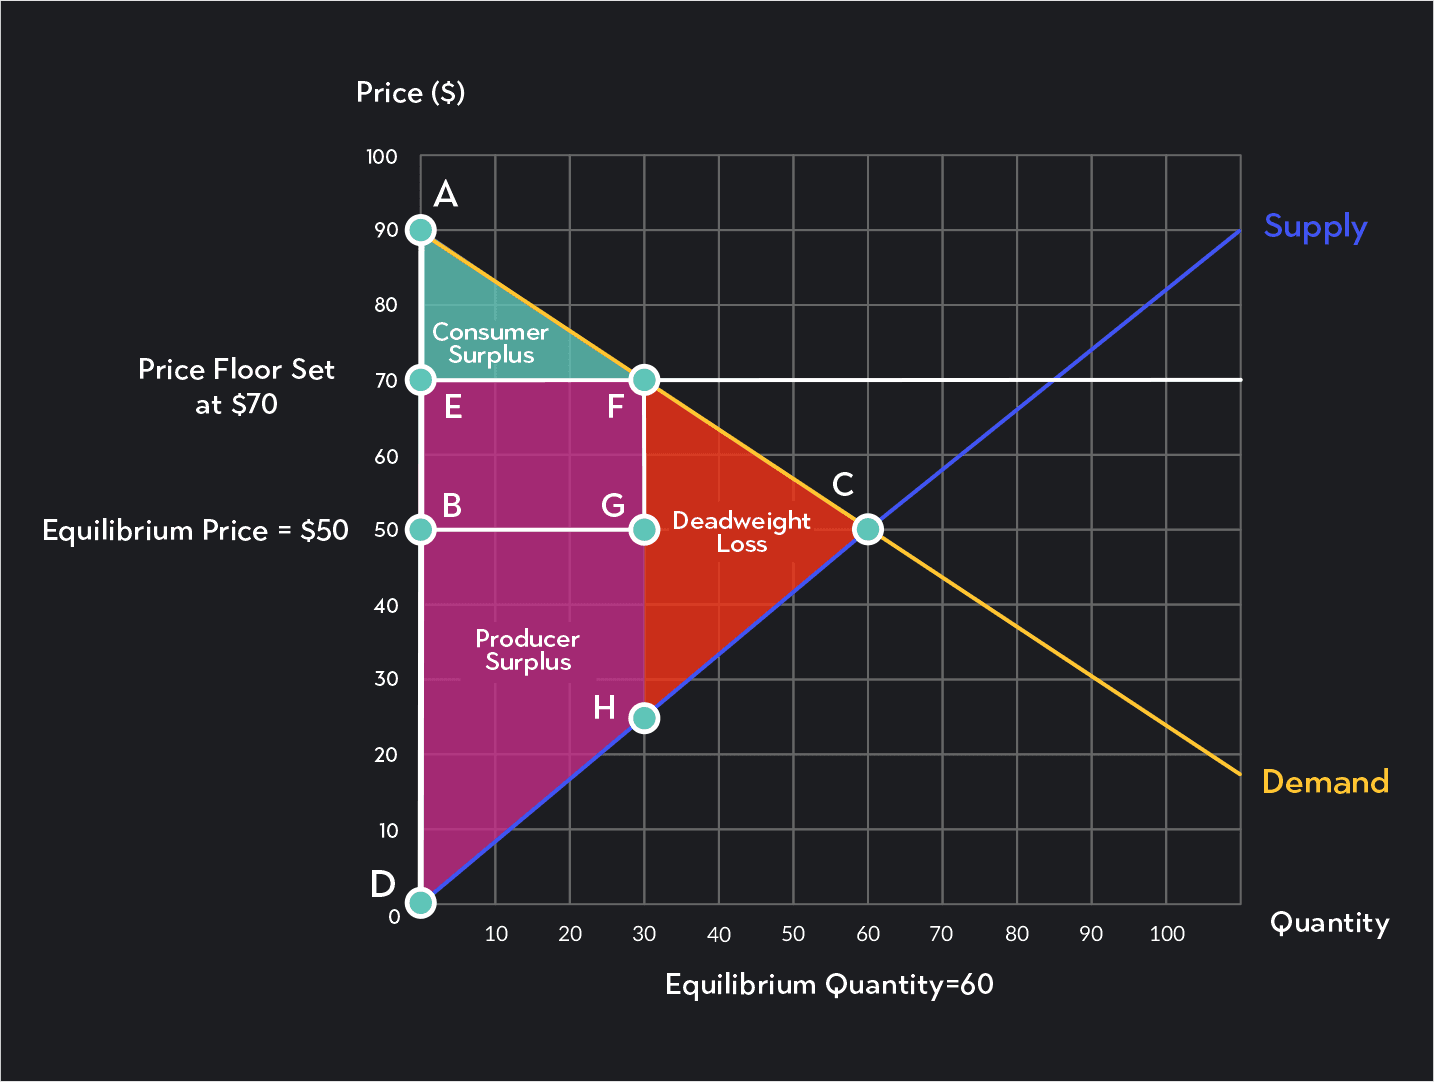
The figure above shows a price floor set at a price of $70 in a market where the equilibrium price and quantity were $50 and 60 units, respectively. At the equilibrium, producer surplus was equal to the area of triangle ABC, producer surplus was equal to the area of triangle BCD, and total surplus was equal to the area of triangle ACD (the combination of producer and consumer surplus).
After the price floor, the market price increases from $50 to $70, and quantity demanded falls from 60 units to 30 units. Economic analysis of the supply and demand graph shows the two ways social surplus is affected by the price floor.
The higher price forces a subset of buyers and sellers out of the market and results in a deadweight loss equal to the area of triangle FHC.
At the higher price, consumer surplus for the remaining buyers in the market reduces by the area of rectangle EBGF. The surplus represented by this rectangle gets transferred to the remaining producers in the market who benefit from the higher price (the gap between what they are willing to charge and the market price is now larger).
Because of the price floor, total consumer surplus decreases from triangle ABC to triangle AEF, and total producer surplus changes from triangle BCD to the purple area EDHF. Social surplus reduces from triangle ACD to the area ADHF.
Price Ceilings
A price ceiling is a policy limiting how high a market price can be. If a price ceiling is set below the equilibrium price, it will decrease both price and quantity.
Price ceilings impact social surplus in two ways.
1. Deadweight Loss
At the lower price, some sellers are forced out of the market (their willingness to sell is now higher than the new price imposed by the price ceiling). With fewer sellers in the market, some buyers are also forced to exit the market (there won’t be enough sellers to buy products from). As buyers and sellers exit the market, producer and consumer surplus, and therefore, total surplus decreases.
2. Transfer of Surplus from Producers to Consumers
A transfer of surplus from producers to consumers also exists. This is the opposite effect that price floors have. Remember, a price ceiling results in a lower market price, which benefits the consumers remaining in the market but harms the remaining sellers. A portion of the surplus that would have gone to sellers under the equilibrium price and quantity will be transferred to consumers.
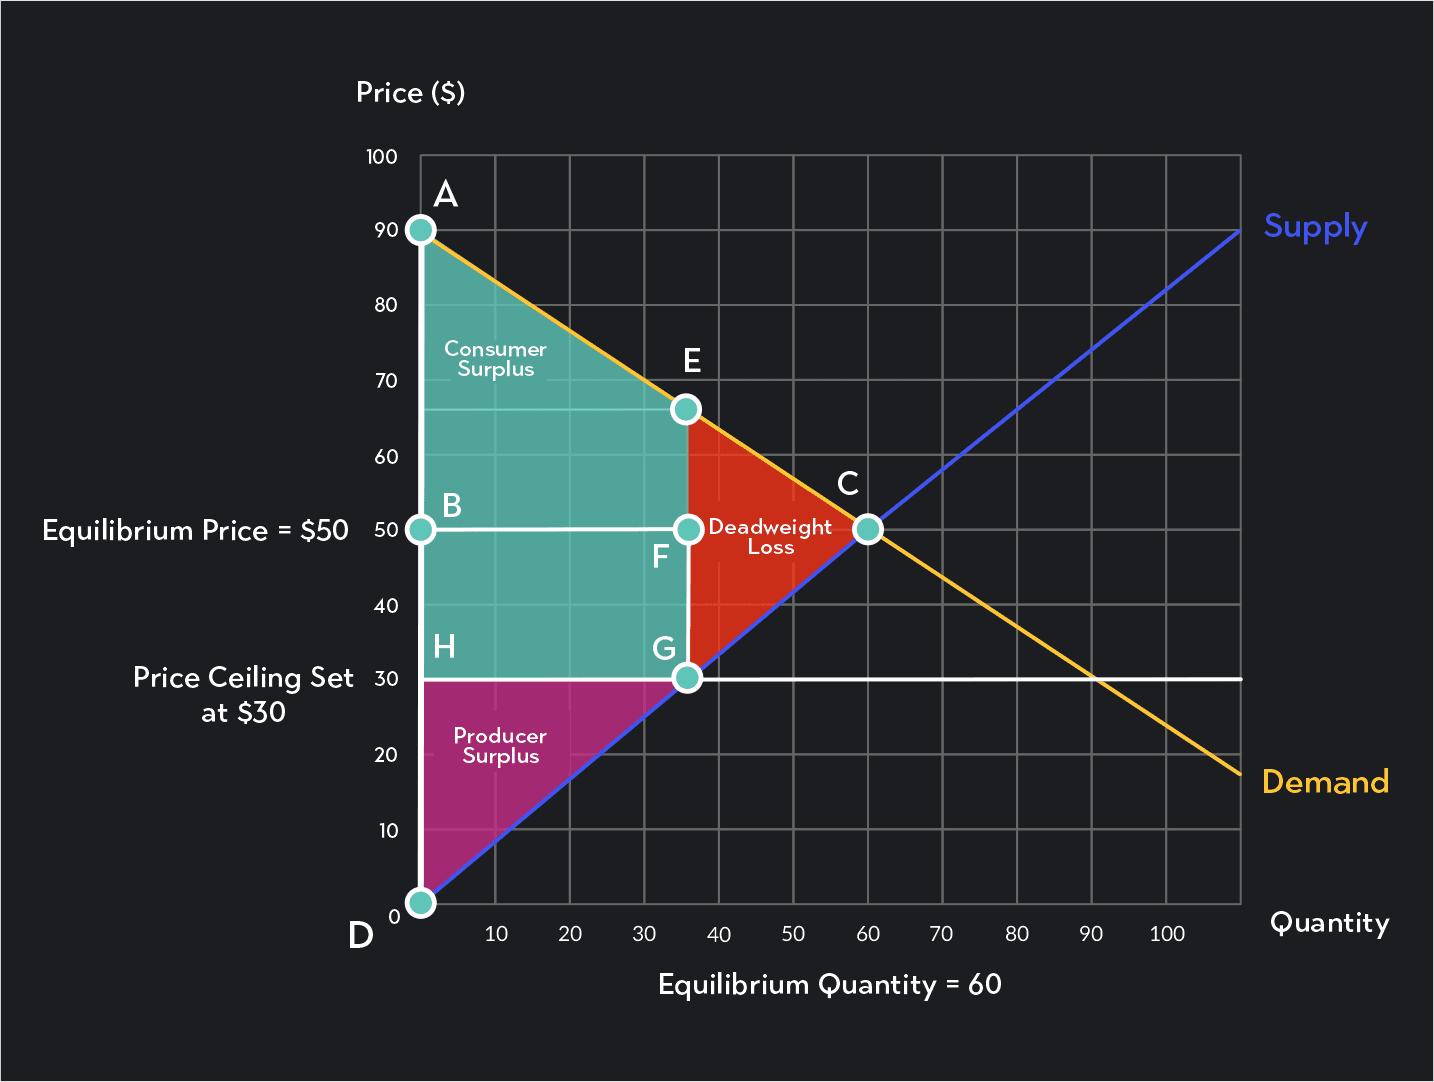
The figure above shows a price ceiling set at $30 in a market where the equilibrium price and quantity were $50 and 60 units, respectively. Like before, at the equilibrium, producer surplus was equal to the area of triangle ABC, producer surplus was equal to the area of triangle BCD, and total surplus was equal to the area of triangle ACD.
After the price ceiling, the market price falls from $50 to $30, and quantity demanded falls from 60 units to 35 units.
The two effects on social surplus are:
The lower price forces a subset of buyers and sellers out of the market. It results in a deadweight loss equal to the area of triangle EGC.
At the lower price, the area of rectangle BHGF reduces producer surplus for the remaining sellers in the market. The surplus represented by this rectangle gets transferred to the remaining buyers who benefit from the lower price—the gap between what they are willing to pay and the market price is now larger.
Because of these changes, total consumer surplus changes from triangle ABC to the blue area AHGE, and total producer surplus reduces from triangle BCD to the triangle HGD. Social surplus decreases from the area of triangle ACD to the area ADGE.
Price floors and ceilings prevent economic efficiency, causing deadweight loss, and reducing the total surplus created from trade.
As we have seen in the examples above, price controls cause two things:
One party transfers some surplus to another
The total social surplus decreases, creating a deadweight loss.
What Is Deadweight Loss?
As we have seen, economically inefficient markets result in a deadweight loss. But what exactly is deadweight loss?
Deadweight loss is the loss of consumer and producer surplus that could have resulted in a better or more efficient market outcome. It represents the opportunities for net gains missed due to market failures or government policies. Some of these policies include price floors, price ceilings, and taxation that can lead to inefficient market outcomes.
Outlier (from the co-founder of MasterClass) has brought together some of the world's best instructors, game designers, and filmmakers to create the future of online college.