Economics
Understanding the Supply Curve & How It Works
Learn about what a supply curve is, how a supply curve works, examples, and a quick overview of the law of demand and supply.
Alejandro Diaz Herrera
Subject Matter Expert

Economics
04.30.2022 • 10 min read
Subject Matter Expert
Here’s an overview of total surplus. Learn its definition, the different types of surplus, their uses, and how to calculate them
In This Article
In economics, total surplus—also referred to as total social welfare, social surplus, or economics surplus—refers to the extra benefits that producers and consumers get from selling or buying a good. For sellers, this benefit comes from selling goods at a price that is higher than the minimum price they are willing to charge. For consumers, surplus comes from buying goods at a lower price than the maximum price they are willing to pay.
Markets tend to have many sellers and buyers who each experience varying levels of surplus. Total economic surplus is the sum of all producer and consumer surplus in a particular market.
Total Surplus = Total Consumer Surplus + Total Producer Surplus
Markets usually have many buyers and sellers, so to calculate total surplus, you need to calculate consumer and producer surplus for the entire market. To do this, you can use a supply and demand diagram.
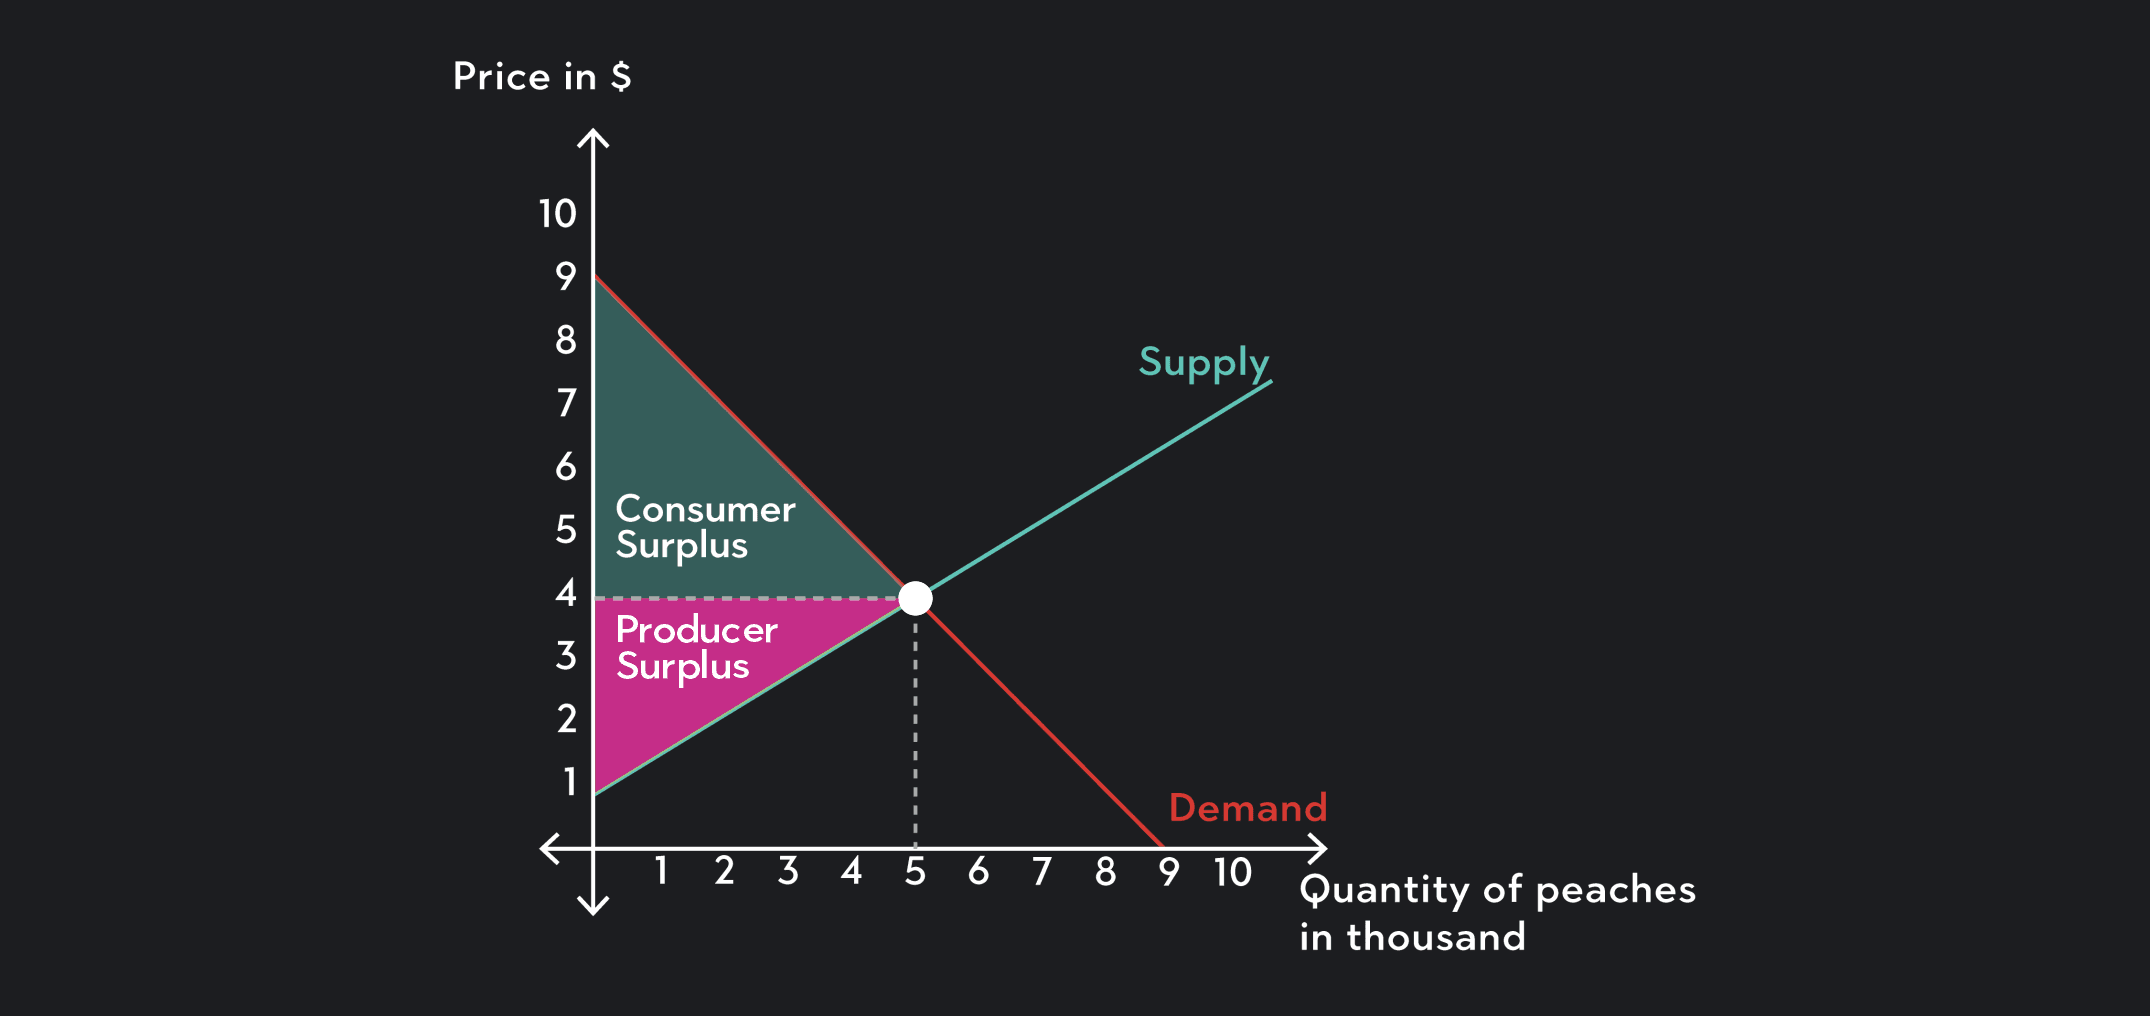
The figure below shows a hypothetical supply and demand diagram for Georgia peaches. Using this diagram, we’ll calculate consumer surplus, producer surplus, and total surplus for the market. In this example, assume that the market for Georgia peaches is perfectly competitive and that the market is in equilibrium and there’s market clearing price.

For any individual buyer, consumer surplus equals the maximum price that the consumer is willing to pay minus the market price.
Consumer’s Surplus = Maximum Price Buyers Are Willing To Pay - The Market Price
For example, imagine Sally is willing to pay $1,000 to see her favorite band at a music festival. If she manages to buy a ticket to the festival for $200, her consumer surplus is $1000 - $200 = $800.
In a supply and demand diagram, total consumer surplus is the triangular area below the downward sloping demand curve and above the horizontal line marking the price. The area of a triangle is ½ time base times height, so to find consumer surplus you should use the formula:
1/2 x Equilibrium Quantity x (The vertical intercept of the demand curve - The equilibrium price)
In this particular example, consumer surplus is represented by the green triangle and is equal to:
1/2 x 5,000 x $5 = $12,500
For any individual seller, the producer surplus gained from selling a good is equal to the market price minus the minimum price the seller is willing to charge.
Producer’s Surplus From Selling a Good =
The Market Price - The Minimum Price Buyers Are Willing to Sell the Good for
For example, if Ben and Jerry’s is willing to sell a pint of their Chocolate Chip Cookie Dough ice cream for a minimum price of $3.50, and they manage to sell the pint for $5.50, the producer surplus they gain from selling that pint is $5.50 - $3.50 = $2.
In a supply and demand diagram, total producer surplus is the triangular area above the supply curve and below the price. To find producer surplus you should use the formula:
1/2 x Equiibrium Quantity (The Equilibrium Price - The Vertical Intercept of the Supply Curve)
In this particular example, producer surplus is represented by the pink triangle and is equal to:
1/2 x 5,000 x $3 = $7,500
To find total surplus you can add together total consumer surplus and total producer surplus.
Total Surplus = Total Consumer Surplus + Total Producer Surplus
This is the same thing as calculating the area of the triangle formed by combining the green consumer surplus triangle with the pink producer surplus triangle. In this example, total consumer surplus is equal to:
1/2 x $8 x 5,000 = $20,000 or $12,500 + $7,500 = $20,000
The intuition behind the graphical representations of economic surplus is quite simple. Every point along a demand curve represents a consumer’s maximum willingness to pay for a particular quantity of the good or service being sold in the market. The distance between a particular point along the demand curve and the market price can be thought of as a specific consumer’s consumer surplus.
In the Georgia peach example, there is a consumer who is willing to pay $8 for the 1000th peach. The actual price is only $4, so this consumer gets $4 dollars worth of consumer surplus. The consumer of the 3000th peach values peaches a bit less than the consumer of the 1000th peach. He or she is willing to pay a maximum price of $6 for a peach and will have a consumer surplus of $6 - $4 = $2.
If we are interested in the combined surplus of all consumers in the market, we need to sum up all of the distances between the points along the demand curve and the market price. The sum of all these distances is equal to the area of the triangle formed by the demand curve, the vertical intercept, and the price line. You do not have to consider the segment of the demand curve that lies to the right of the market equilibrium, because it represents consumers in the market whose willingness to pay is lower than the market price and who therefore are unable or unwilling to make a purchase.
The intuition behind producer surplus is very similar. Every point along the supply curve represents the lowest price that a seller is willing to charge for a particular quantity of the good. The distance between the price and a particular point along the supply curve is a particular producer’s surplus. To find total producer surplus, you need to sum up all of these distances.
When total surplus in a market is maximized, the price and quantity in the market are considered allocatively efficient.
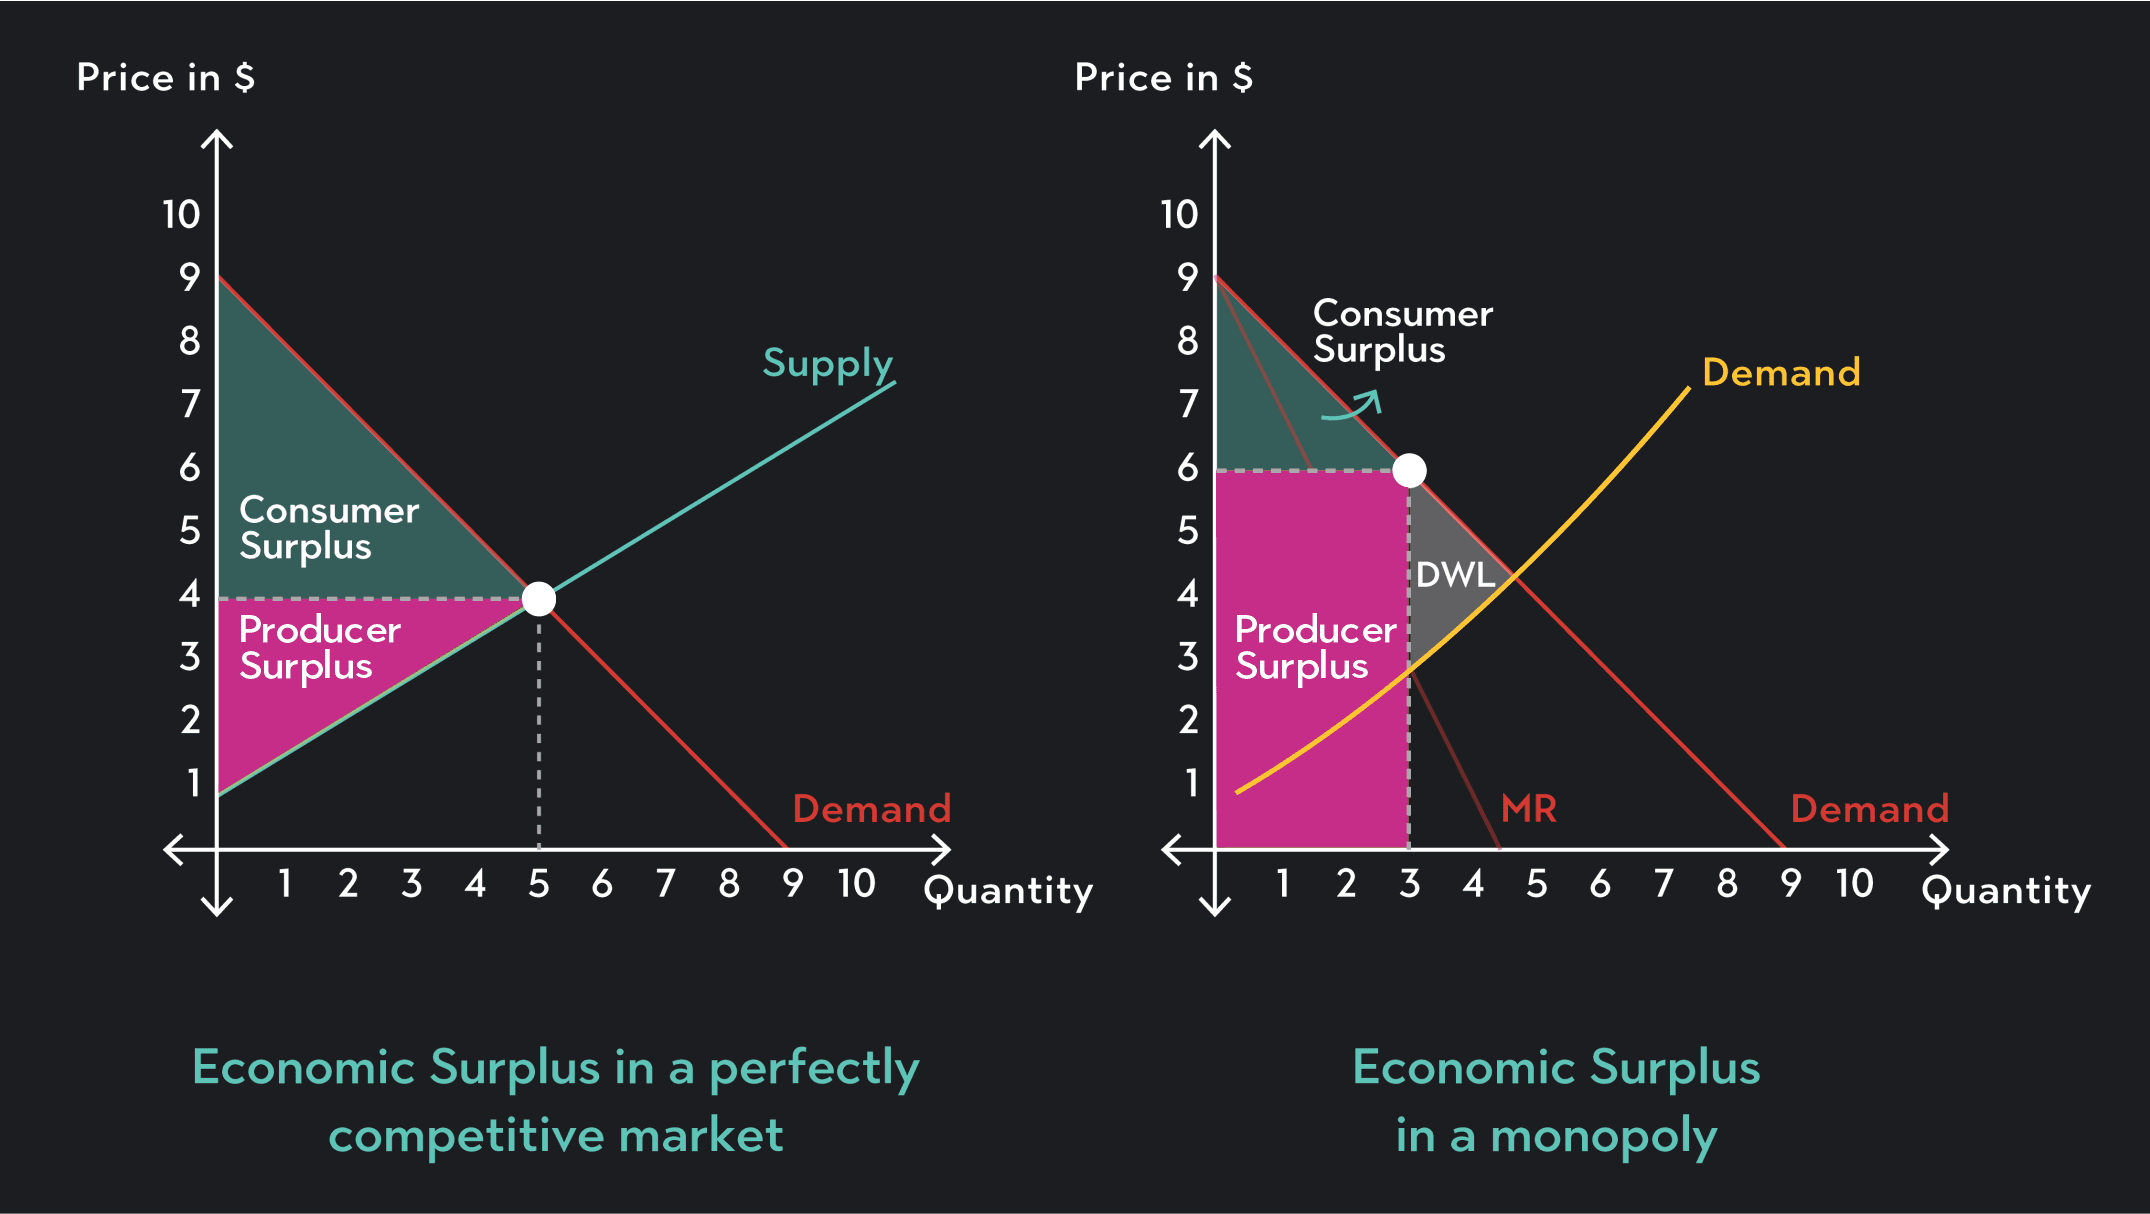
A perfectly competitive market is allocatively efficient when the equilibrium price is charged and the equilibrium quantity is sold. At the equilibrium, total surplus is maximized, so there is no way to increase total surplus in the market. Any combination of price and quantity other than the equilibrium price and quantity will lead to less economic surplus. A deviation from the equilibrium will be allocatively inefficient.

Unlike perfectly competitive markets, equilibrium in a monopoly is not allocatively efficient and results in deadweight loss — a loss of economic surplus. Monopolies have the power to set their own prices and to maximize profits. A monopolist will choose a price and quantity of production that results in an amount of total surplus that is lower than what it would be if the market was perfectly competitive. Furthermore, total surplus in a monopoly favors the monopolist. The monopolist’s portion of the surplus will be large relative to consumer surplus.
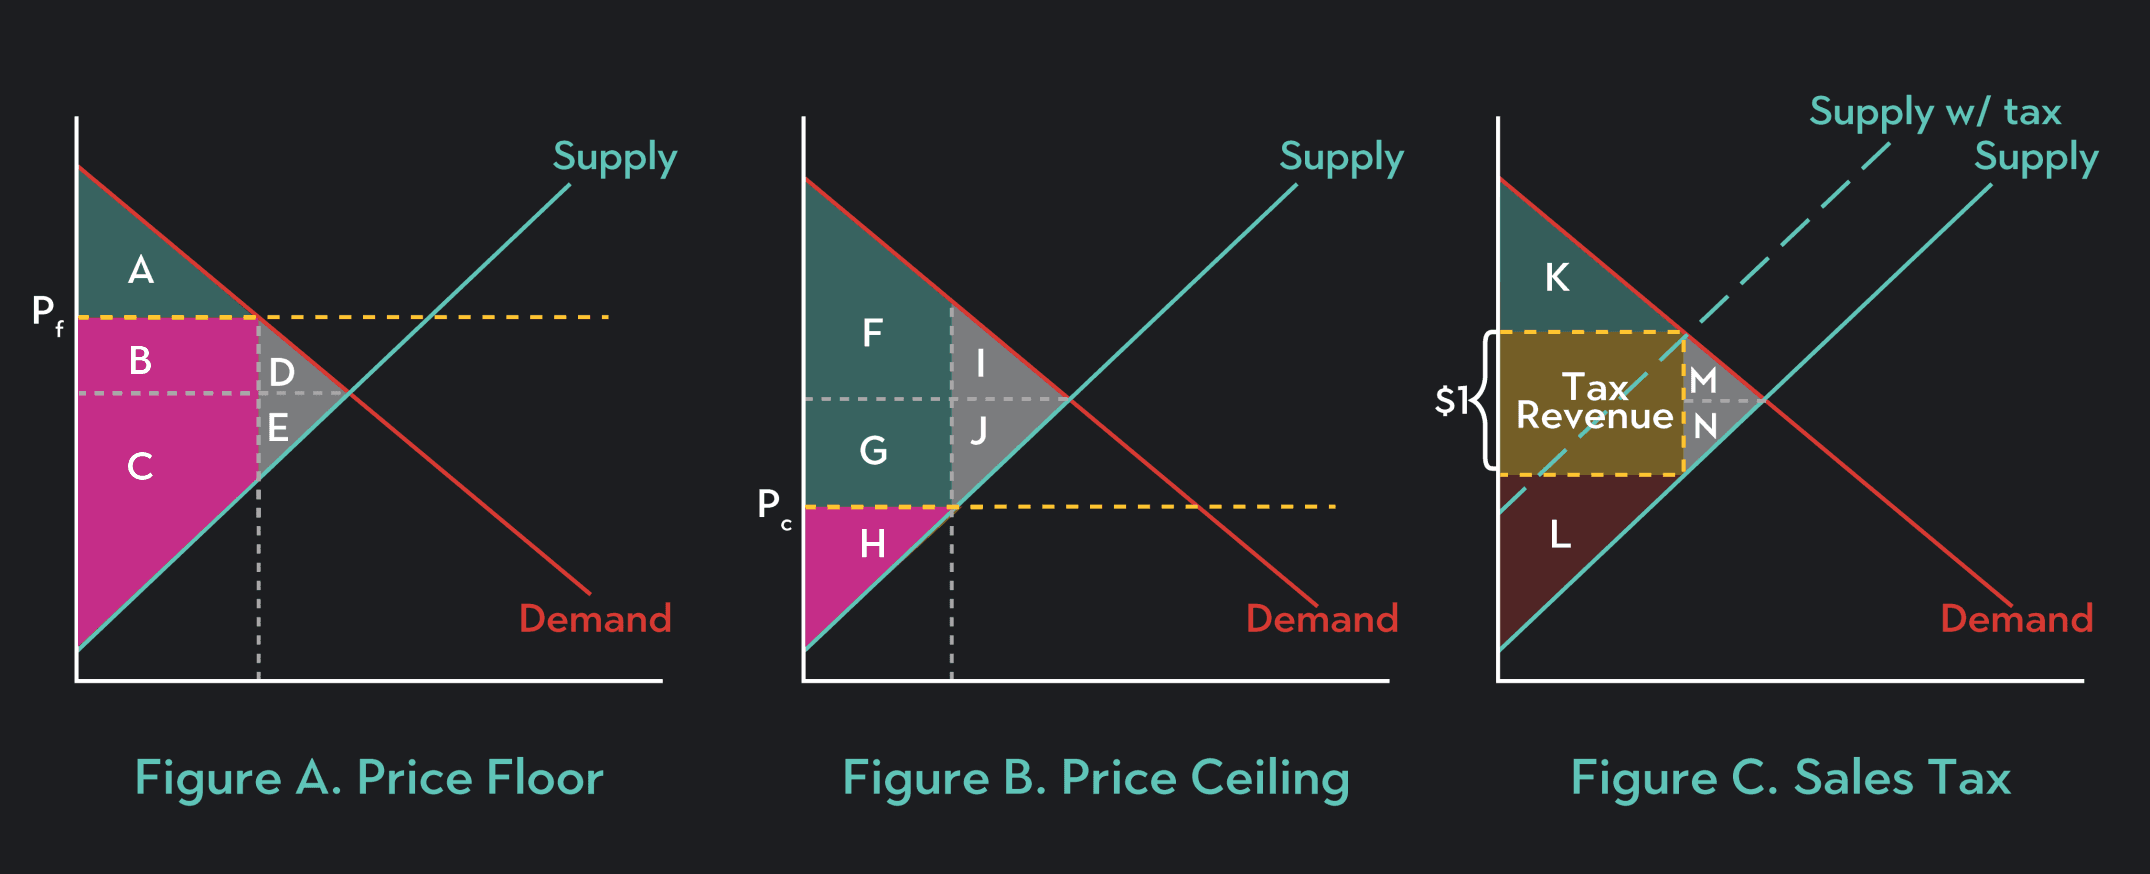
When prices in the market change, the amount of consumer and producer surplus can also change. Below are three examples of how surplus is affected by price changes in a perfectly competitive market.

Figure A shows how a price floor affects surplus. A price floor is a legal restriction on how low the price in the market can be. When price floors are implemented, they tend to push the market price above the equilibrium price. This creates a loss in total surplus called a deadweight loss. The deadweight has a component that is a loss of consumer surplus and another component that is a loss of producer surplus. In the figure, the deadweight loss that results from a price floor set at Pf is equal to the areas D + E. Area D is the loss in consumer surplus, and Area E is the loss in producer surplus.
A price floor will also change the composition of total surplus. Of the remaining surplus in the market, some of it will be reallocated from consumers to producers. This is because a price floor raises the market price, which benefits producers but is harmful to consumers. This reallocated surplus is equal to Area B in the figure.
Figure B shows how a price ceiling affects surplus. A price ceiling is a legal restriction on how high the market price can be. When price ceilings are implemented, they tend to push the market price below the equilibrium price. Price ceilings (like price floors) create a deadweight loss in the market. Part of the deadweight loss is a loss in consumer surplus and part is a loss in producer surplus. The deadweight loss that results from a price ceiling set at Pc is equal to the areas I + J in the figure. Area I is the loss in consumer surplus, and Area J is the loss in producer surplus.
A price ceiling will also change the composition of total surplus but in the opposite direction of a price floor. Of the remaining surplus in the market, some of it will be reallocated from producers to consumers. This is because a price ceiling lowers the market price, which benefits consumers but is harmful to producers. The reallocated surplus is equal to Area G in the figure.
Figure C shows how a fixed sales tax can affect surplus. If the government imposes a $1 tax on every unit sold in the market, it will cause the supply curve to shift inward to the left. Producer and consumer surplus are affected in two ways when this happens. First, the reduction in supply causes a deadweight loss equal to Areas M + N. In addition, the government collects $1 for every unit sold in the market. The total tax revenue ($1 x the total number of units sold) also represents a loss in producer and consumer surplus. When a fixed sales tax is implemented, the total economic surplus in the market falls by a quantity equal to the total tax revenue + the deadweight loss. The tax will affect consumer surplus and producer surplus to different degrees depending on the elasticity of supply and the elasticity of demand. To read more about how taxes affect consumers and producers read this article on tax incidence.
The final thing to understand about economic surplus is its relationship to inequality and to gains and losses that are related to but exist outside of the market. Maximizing total economic surplus is an important goal in economics, but it is not the only thing that people or society care about. A market that efficiently allocates goods in a way that maximizes consumer and producer surplus is not the same as a market that allocates goods fairly or in a way that might improve inefficiencies that exist beyond the market.
As an example, think of who benefits from consumer surplus. The beneficiaries of consumer surplus are the buyers in the market whose willingness to pay is high relative to other potential consumers. Willingness to pay a high price is often associated with the degree to which an individual buyer values and will benefit from a good. Sometimes this is the case. If Sally really likes a band that her brother doesn’t particularly like, it makes sense that she would be willing to pay a higher price to go see the band in concert. You might even argue that she is more deserving of a ticket.
In other instances, a high willingness to pay might only be a reflection of one consumer’s greater ability to pay for a good or service. If a millionaire is willing to spend tens of thousands of dollars on a plane ticket to fly away on a two-day vacation, and a low-income individual is unwilling to spend $100 for an airplane ticket to visit an ailing family member, can you really say the millionaire values and is more deserving of the ticket? Extreme inequality among market participants is one reason why maximizing economic surplus is not the only outcome that society pursues, and it is a reason why governments may choose to intervene in markets.
A second consideration comes into play when markets impose substantial benefits or injuries on people other than the buyers and sellers in the market. Economists call such benefits and injuries positive and negative externalities. As an example, think of a company that uses the profits it makes to invest in infrastructure and architectural upgrades around its office or retail spaces. This could create a positive externality for people living in the area who can also enjoy the upgrades. It might also create a negative externality if the upgrades lead to higher real estate prices in the area and existing residents are no longer able to afford to live in the area. When a market produces significant externalities, it makes sense to consider what those externalities are in addition to taking into account total consumer and producer surplus.
Outlier (from the co-founder of MasterClass) has brought together some of the world's best instructors, game designers, and filmmakers to create the future of online college.
Check out these related courses:

Economics
Learn about what a supply curve is, how a supply curve works, examples, and a quick overview of the law of demand and supply.
Subject Matter Expert

Economics
This article gives a quick overview of perfect competition in microeconomics with examples.
Subject Matter Expert

Economics
This article is a comprehensive guide on the causes for a demand curve to change. Included are five common demand shifter examples.
Subject Matter Expert