
Economics
What Is a Monopoly? [Economics 101]
Learn what monopoly in economics is and why it is important. We’ll also go over the types of monopolies, their characteristics, pros, and cons.
Sarah Thomas
Subject Matter Expert

Economics
02.07.2023 • 5 min read
Subject Matter Expert
Learn about consumer and producer surplus, their formula, how they affect the economy, and how the elasticity of goods can affect them.
In This Article
In economics, consumer surplus is the difference between the maximum price consumers are willing to pay for a good and the actual price they pay.
Imagine you’re thirsty and craving a soda.
You’re willing to pay $5 for a can, but you find a vending machine selling sodas for $1. Your consumer surplus—if you buy the soda—is the benefit you get from paying less for the can than you were otherwise willing to pay. In this case, your consumer surplus is $4—the $5 you were willing to pay minus the $1 you pay.
On a supply and demand graph with linear (straight) supply and demand curves, a triangle represents consumer surplus.
These 3 items form the sides of this triangle:
The vertical axis of the graph
A horizontal line placed where the market price (or equilibrium price) is
The demand curve
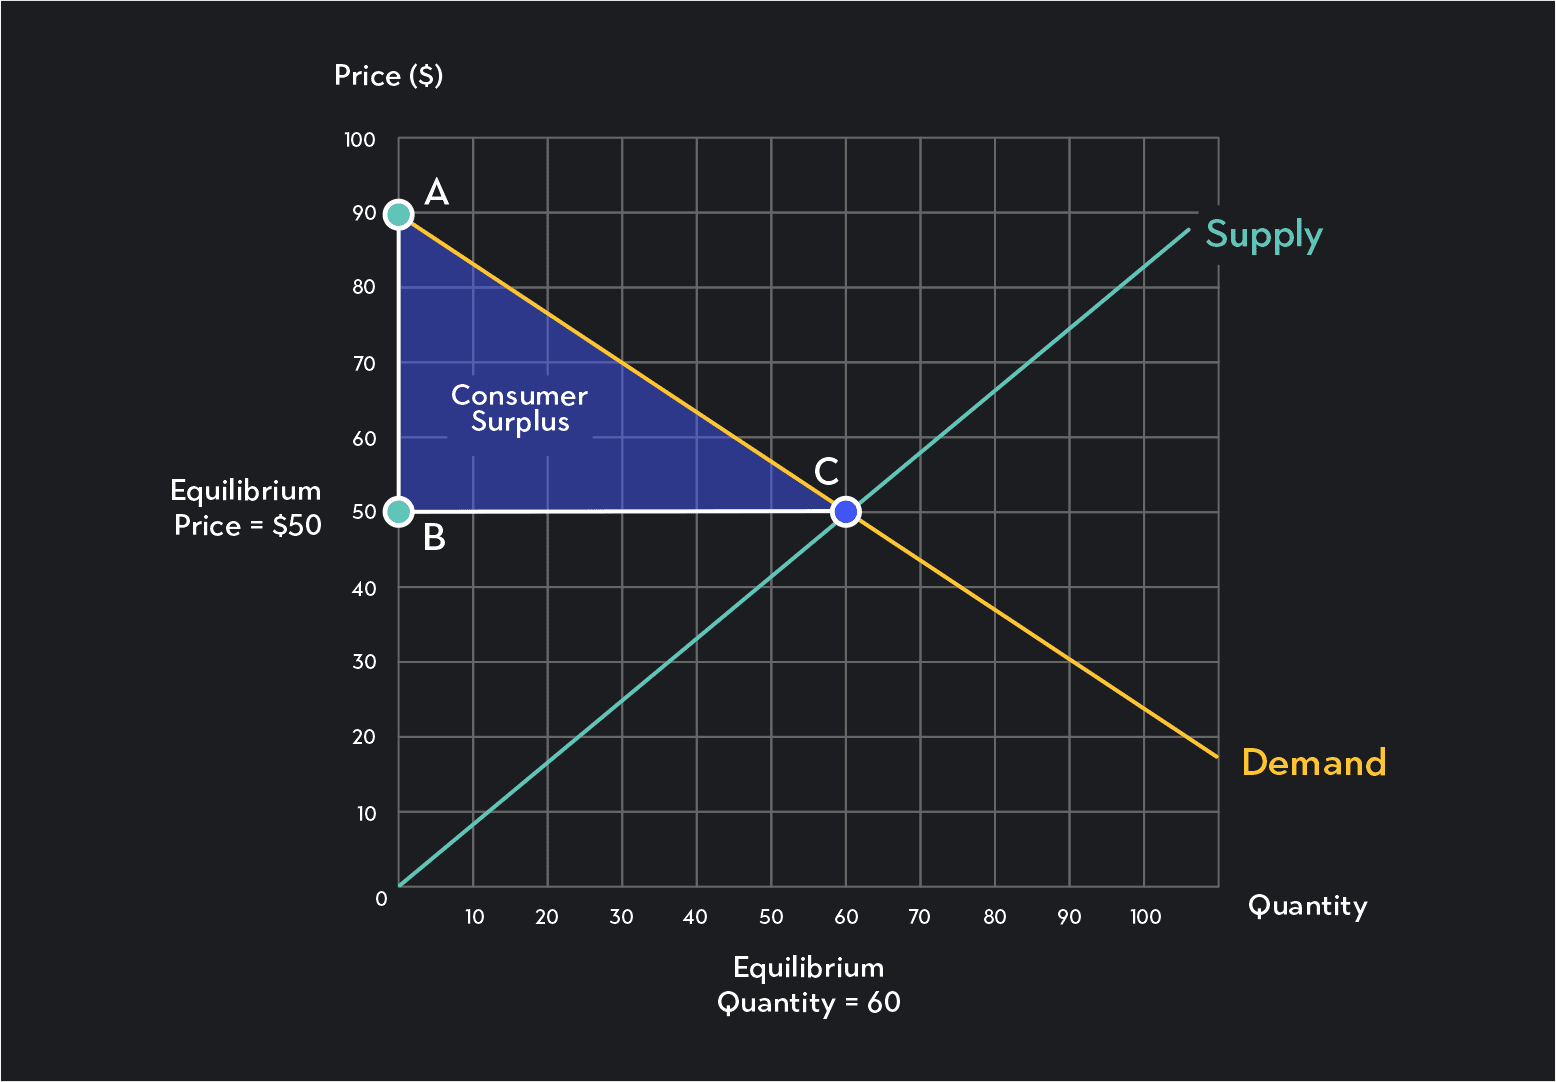
In the supply and demand graph above, triangle ABC represents the total consumer surplus. It represents all of the combined consumer surpluses buyers in the markets have gained across all transactions.
To calculate total consumer surplus, all you have to do is calculate the area of the consumer surplus triangle. The area of a triangle is equal to ½ the base of the triangle times its height.
In our example, consumer surplus equals: ½ x 60 x 40 = $1200.
Again, this area is the sum of all consumer surpluses gained from each transaction in the market.
For example, for the 10th unit sold, somebody in the market was willing to pay about $83 but purchased the unit for $50. This buyer gained a consumer surplus of $33. The buyer of the 20th unit had a consumer surplus equal to $76-$50 or $26, and so on. If we add up the individual surpluses gained from each of the 60 units sold, we would get an amount equal to the area of the triangle.
Producer surplus is the difference between what a seller receives as payment for a product (the price) and the lowest price they were willing to accept.
Imagine you’re an artist.
You create a sculpture you’re willing to sell for $30. A buyer enters your gallery and falls in love with your work. Before you even have a chance to say how much it costs, the buyer offers you $100 for the sculpture. Your producer surplus if you sell the piece to this customer is the benefit you get from selling at a higher price than you were willing to charge.
In this case, your producer surplus is $70—the $100 you earned from the sale minus the $30 you were willing to accept for it.
On a supply and demand graph with straight supply and demand curves, these items represent producer surplus:
A triangle formed by the vertical axis of the graph
A horizontal line where the market price is
The supply curve
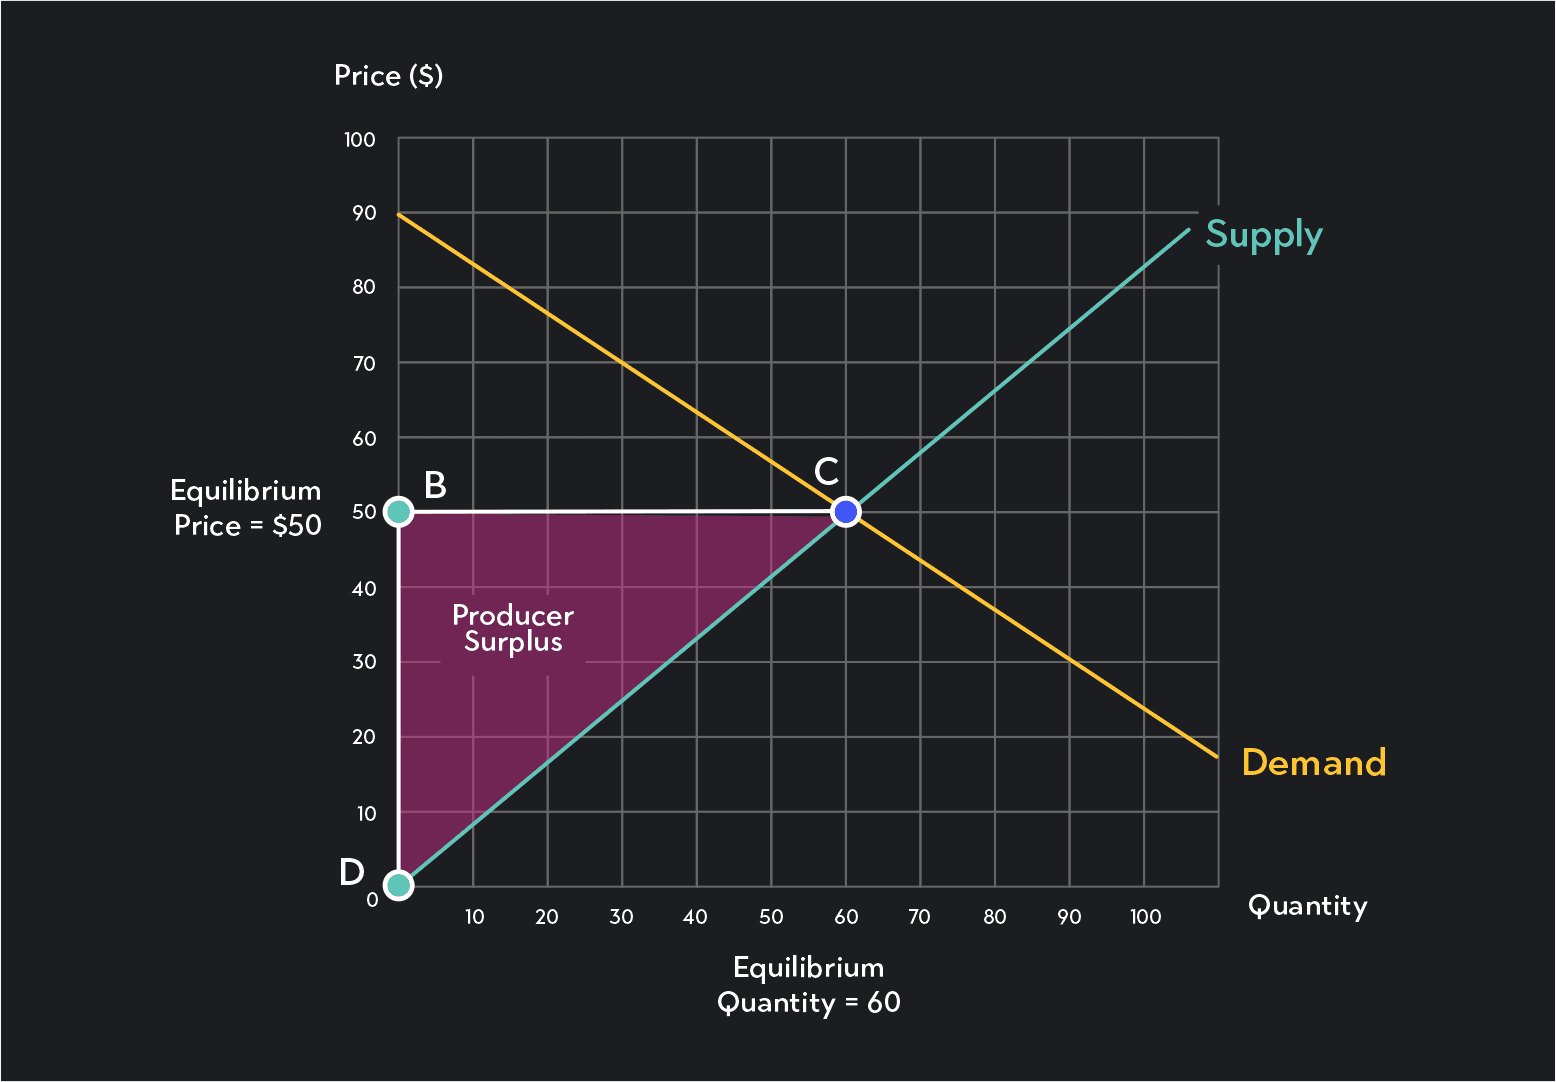
In the graph above, triangle BCD represents the total producer surplus. That is, it represents all of the combined producer surpluses sellers in the market have gained across all transactions.
To calculate total producer surplus, you need to calculate the area of the producer surplus triangle.
The area of a triangle is equal to ½ the base of the triangle times its height.
In this example, producer surplus equals ½ x 60 x 50 = 1,500.
Similar to consumer surplus, the area of the triangle is the sum of all producer surpluses gained from each transaction in the market. For the 10th unit sold, somebody was willing to charge about $9 but could make a sale for $50, thereby gaining a producer surplus of $41. The seller of the 20th unit sold had a consumer surplus equal to about $50 - $16 or $34, and so on. If we add up producer surpluses gained from each of the 60 units sold, we would get an amount equal to the producer surplus triangle’s area!
Economists refer to the combined value of consumer and producer surplus as total social surplus or total economic surplus.
Total surplus in a market represents all the net benefits gained from trade in a particular market. It represents the degree to which market participants are better off due to buying and selling.
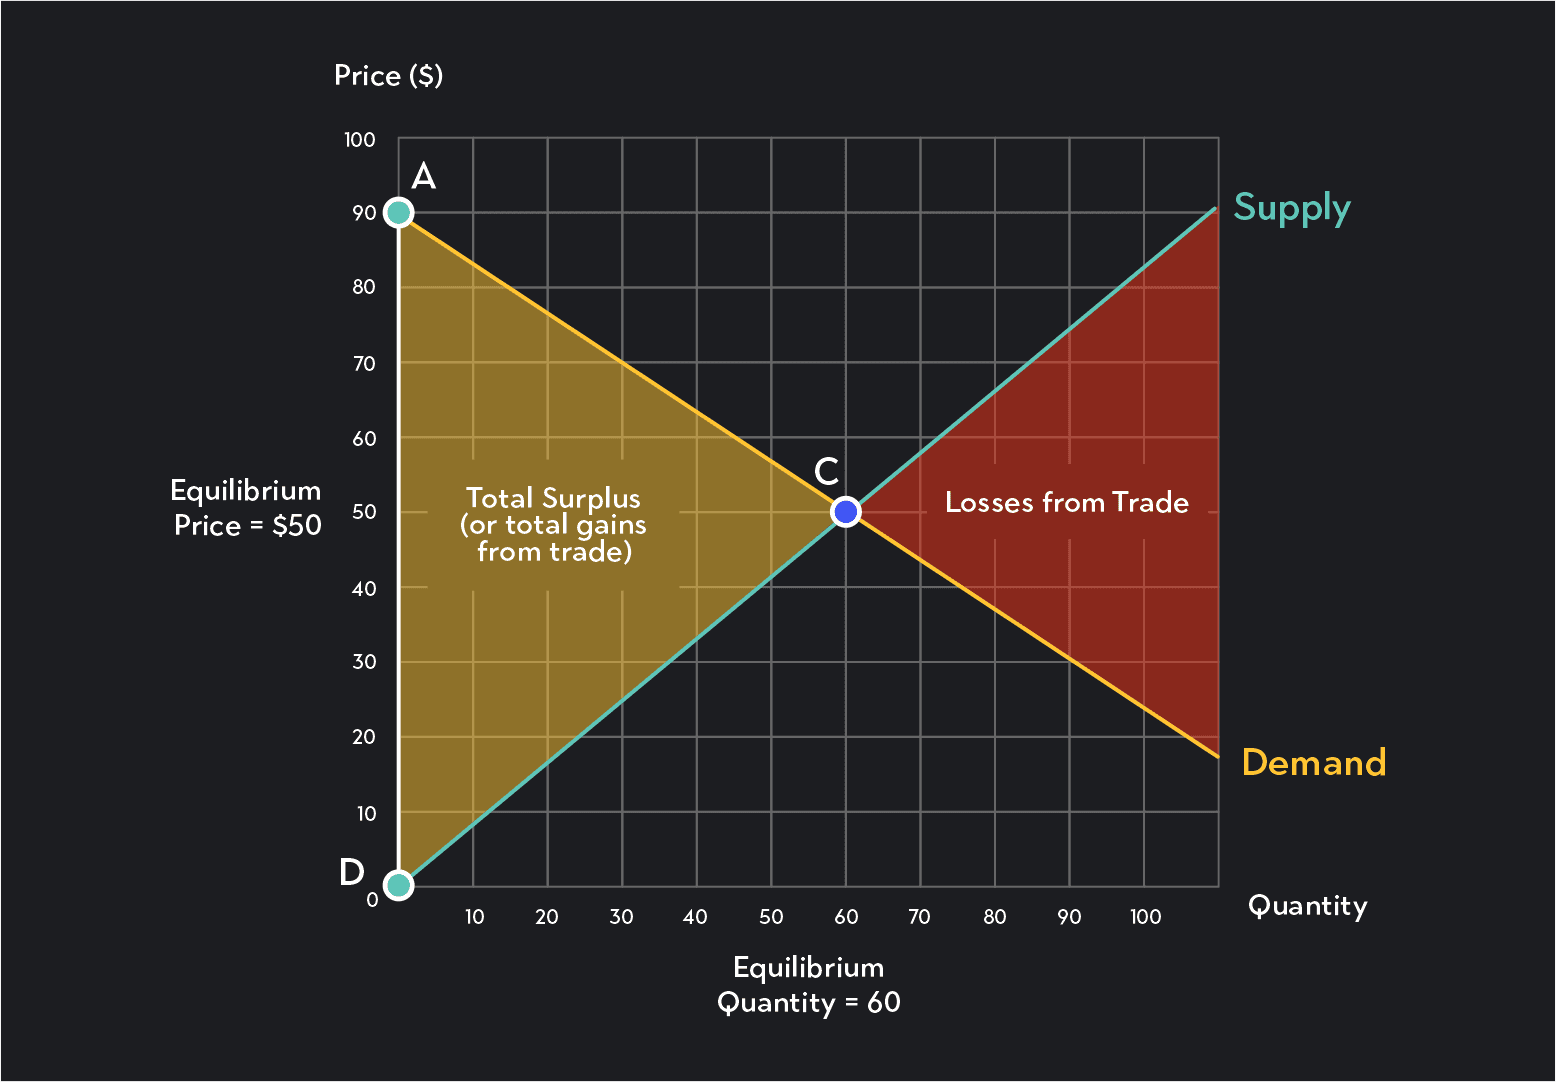
In a perfectly competitive market, total social surplus is maximized at the market equilibrium price and quantity. All buyers willing to pay at or above the market price have been matched with sellers willingness to sell at equal or below the market price.
The equilibrium point represents an allocation that is economically efficient.
At any quantity below the equilibrium quantity, there will be gains from trade that haven’t been realized. This means there will still be sellers and buyers who could benefit from trade but are not. This amount of unrealized potential surplus is called deadweight loss. At the equilibrium point, no deadweight loss exists.
At any quantity above the equilibrium quantity, the price sellers are willing to accept is higher than the price buyers are willing to pay. This means any transaction would result in a net loss (rather than a net gain) for market participants.
Price elasticity of demand measures changes in quantity demanded relative to changes in price. It tells you whether consumers will adjust the quantities they demand by a lot or a little in response to a change in price.
Dr. Homa Zarghamee is one instructor of Outlier.org's Principles of Economics. She explains price elasticity of demand:
When consumer demand is sensitive to price changes—i.e., quantity demanded changes by a lot relative to price—demand is elastic. The flatter a demand curve is, the more elastic demand is.
When demand is perfectly elastic, the demand curve is a horizontal line, and consumer surplus will equal zero.
When consumer demand is insensitive to changes in price—i.e., quantity demanded changes by a little relative to price—demand is inelastic. The steeper the demand curve is, the more inelastic consumer demand is.
When demand is perfectly inelastic, the demand curve is a vertical line, and consumer surplus will be infinite.
Price elasticity of supply measures changes in quantity supply relative to changes in price. It tells you whether sellers will adjust the quantity supplied by a lot or little in response to a change in the market price.
When consumer demand is sensitive to price changes—i.e., quantity demanded changes by a lot relative to price)—demand is elastic. The flatter a supply curve is, the more elastic demand is.
When supply is perfectly elastic, the supply curve is a horizontal line, and producer surplus will equal zero.
When consumer demand is insensitive to price changes—i.e., quantity demanded changes by a little relative to price—demand is said to be inelastic. The steeper the demand curve is, the more inelastic consumer demand is. When supply is perfectly inelastic, the supply curve is a vertical line, and producer surplus will be infinite.
Outlier (from the co-founder of MasterClass) has brought together some of the world's best instructors, game designers, and filmmakers to create the future of online college.
Check out these related courses:


Economics
Learn what monopoly in economics is and why it is important. We’ll also go over the types of monopolies, their characteristics, pros, and cons.
Subject Matter Expert

Economics
Learn what is a budget constraint, how to create one, and how to implement it in an economic situation, along with some examples.
Subject Matter Expert

Economics
Learn what economic efficiency is, its relationship with demand and supply, and efficiency and equilibrium in competitive markets.
Subject Matter Expert