
Economics
Understanding the Supply Curve & How It Works
Learn about what a supply curve is, how a supply curve works, examples, and a quick overview of the law of demand and supply.
Alejandro Diaz Herrera
Subject Matter Expert

Economics
05.24.2022 • 11 min read
Subject Matter Expert
Learn what is a budget constraint, how to create one, and how to implement it in an economic situation, along with some examples.
In This Article
Budget constraints are graphs or equations that help you understand how to allocate a fixed budget across the consumption of two or more goods. A budget constraint tells you what consumption options are feasible, which are not, how to use your budget efficiently, and what your tradeoffs are.
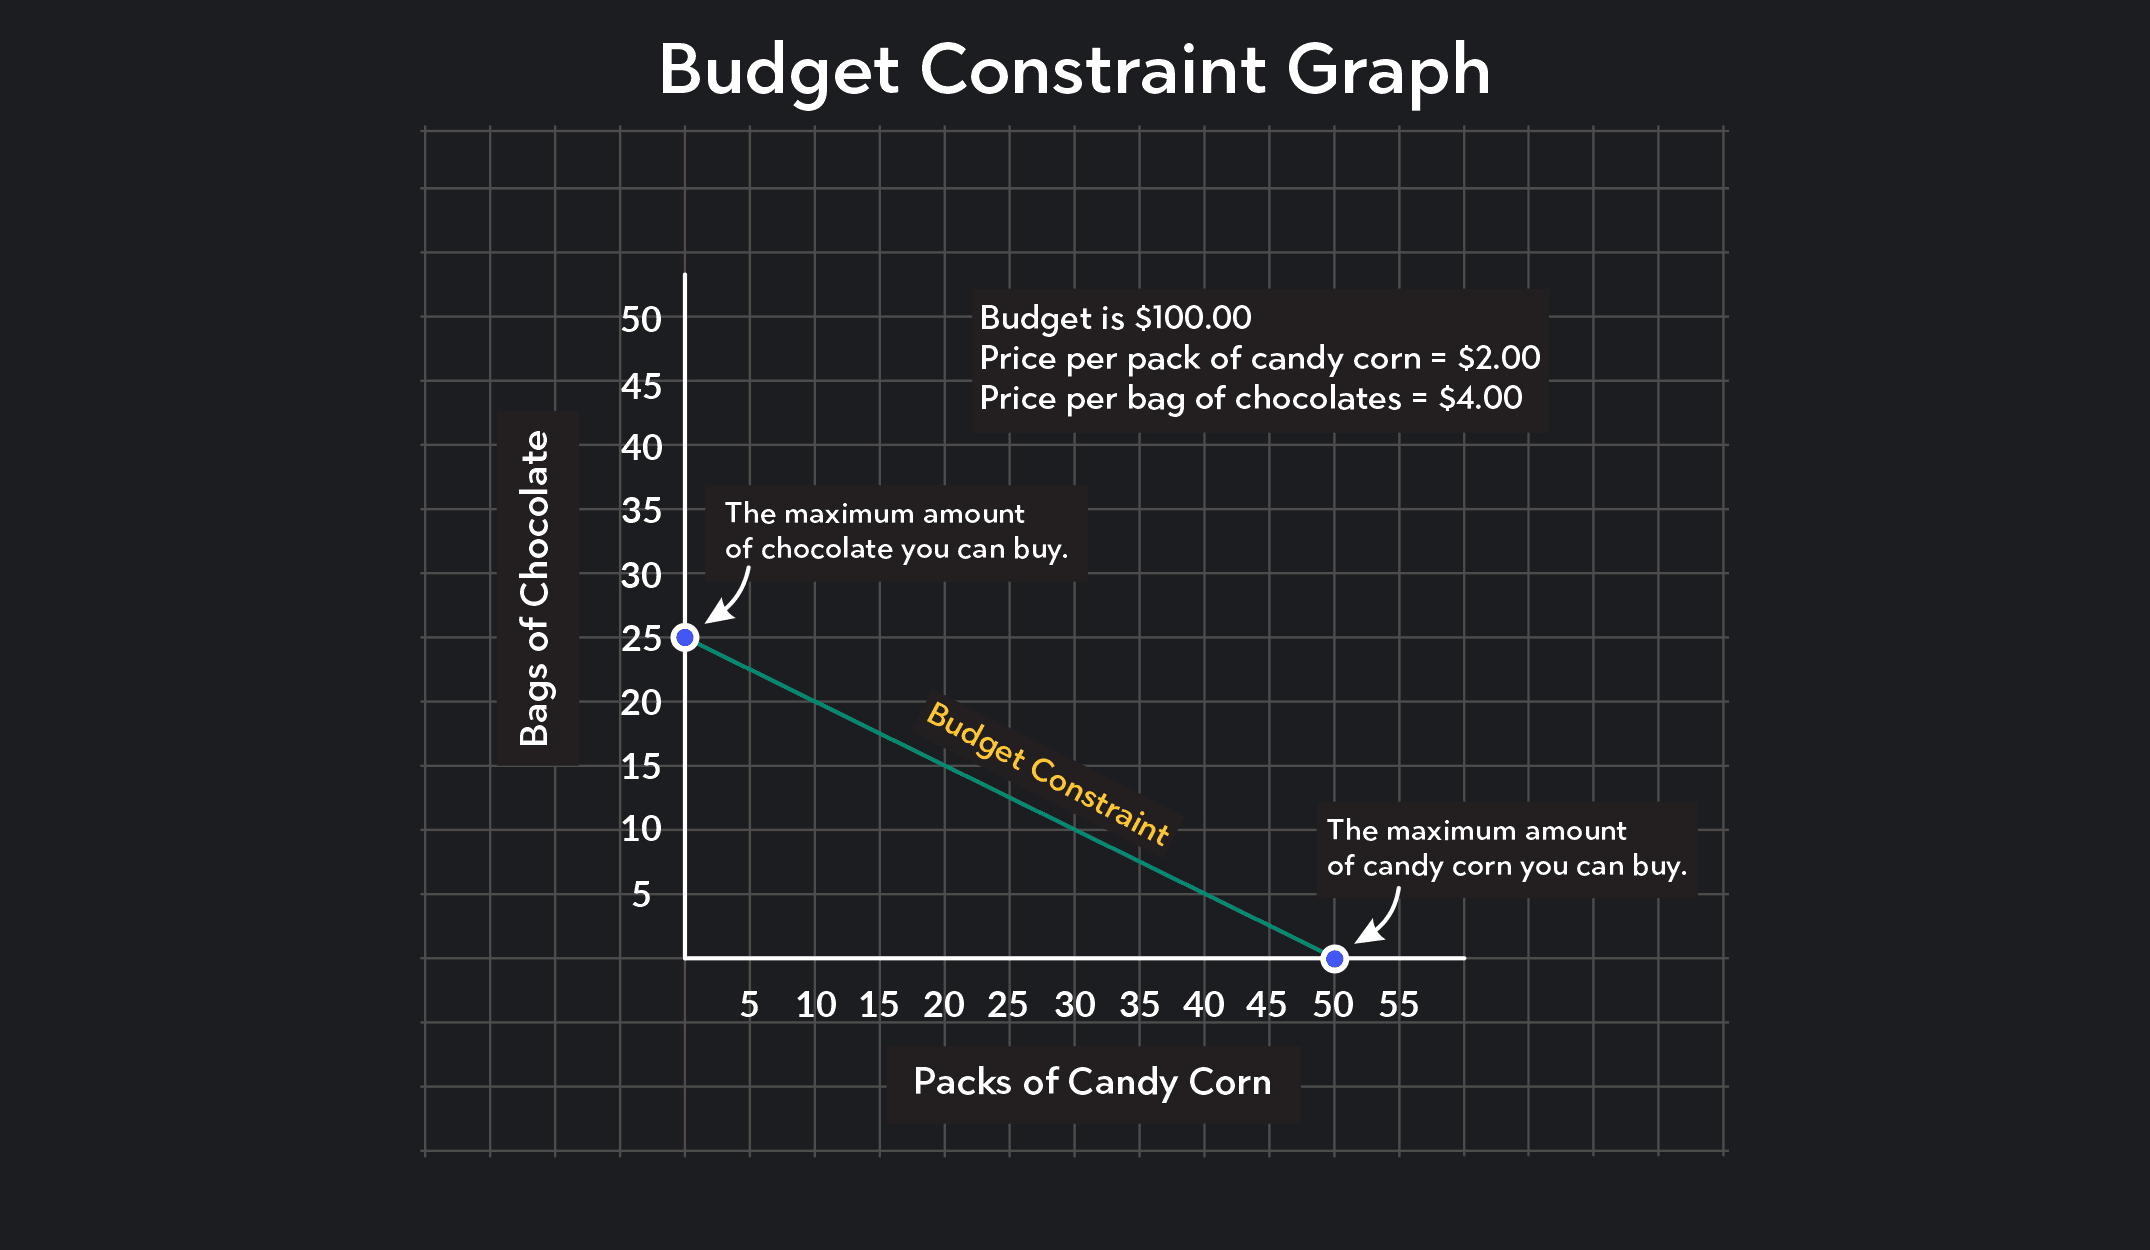
For example, say you enter a candy store with $100 to spend on Halloween candy. The store sells packs of assorted chocolate bars, which cost $4 per pack, and packs of candy corn, which cost $2 per pack. How much candy can you afford to buy?
If you spend all your money on the assorted packs of chocolate, you can buy $100 ÷ $4 = 25 packs of chocolate. If you spend all your money on candy corn, you can afford to buy $100 ÷ $2 = 50 packs of candy corn. A budget constraint graph uses these two consumption bundles as anchors and maps all other affordable consumption bundles. Any bundle marked by a point on the budget constraint line or within the line is an affordable bundle. Any bundle marked by a point that lies beyond the budget constraint is unaffordable.
To draw a budget constraint, follow these steps:
Label the axes by placing the quantity of one good on the horizontal axis (the x-axis) and the quantity of the other good on the vertical axis (the y-axis). In our candy example, we placed chocolate on the vertical axis and candy corn on the horizontal axis, but it doesn’t matter which good you assign to which axes.
On a budget constraint, the vertical intercept is the maximum amount of Good Y (the good plotted on the vertical axis) that you can buy if you spend your entire budget purchasing that good. In our candy example, chocolate is on the vertical axis. We have already found that the largest amount of $4 chocolate packs you can buy with a budget of $100 is $100 ÷ $4 = 25 packs. So, you mark the vertical intercept at 25. To find the maximum amount of a good you can buy, always divide the budget by the price of the good.
The horizontal intercept is the maximum amount of Good X (the good plotted on the horizontal axis) you can buy if you spend your entire budget purchasing that good. In our candy example, candy corn is on the horizontal axis, and the largest amount of candy corn you can buy if you spend the entire budget of $100 is 50 packs. The horizontal intercept is therefore marked at 50.
By connecting the two intercepts, you get the budget constraint (also called the budget line). The budget constraint tells you which combination of goods is affordable. Any combination of goods that lies on the budget constraint and any combination of goods that lies below and to the left of the budget constraint is affordable. Any combination of goods that lies beyond the budget constraint line is not affordable. That’s it! You’ve got your budget constraint graph.
A budget constraint graph can tell you three things very quickly. Given the budget you have, it can tell you which combinations of goods are:
Feasible (i.e., affordable)
Both feasible and efficient
Unaffordable
Efficiency here means that you have spent your entire budget, and there is no money left over, which you could have spent buying more of either product.
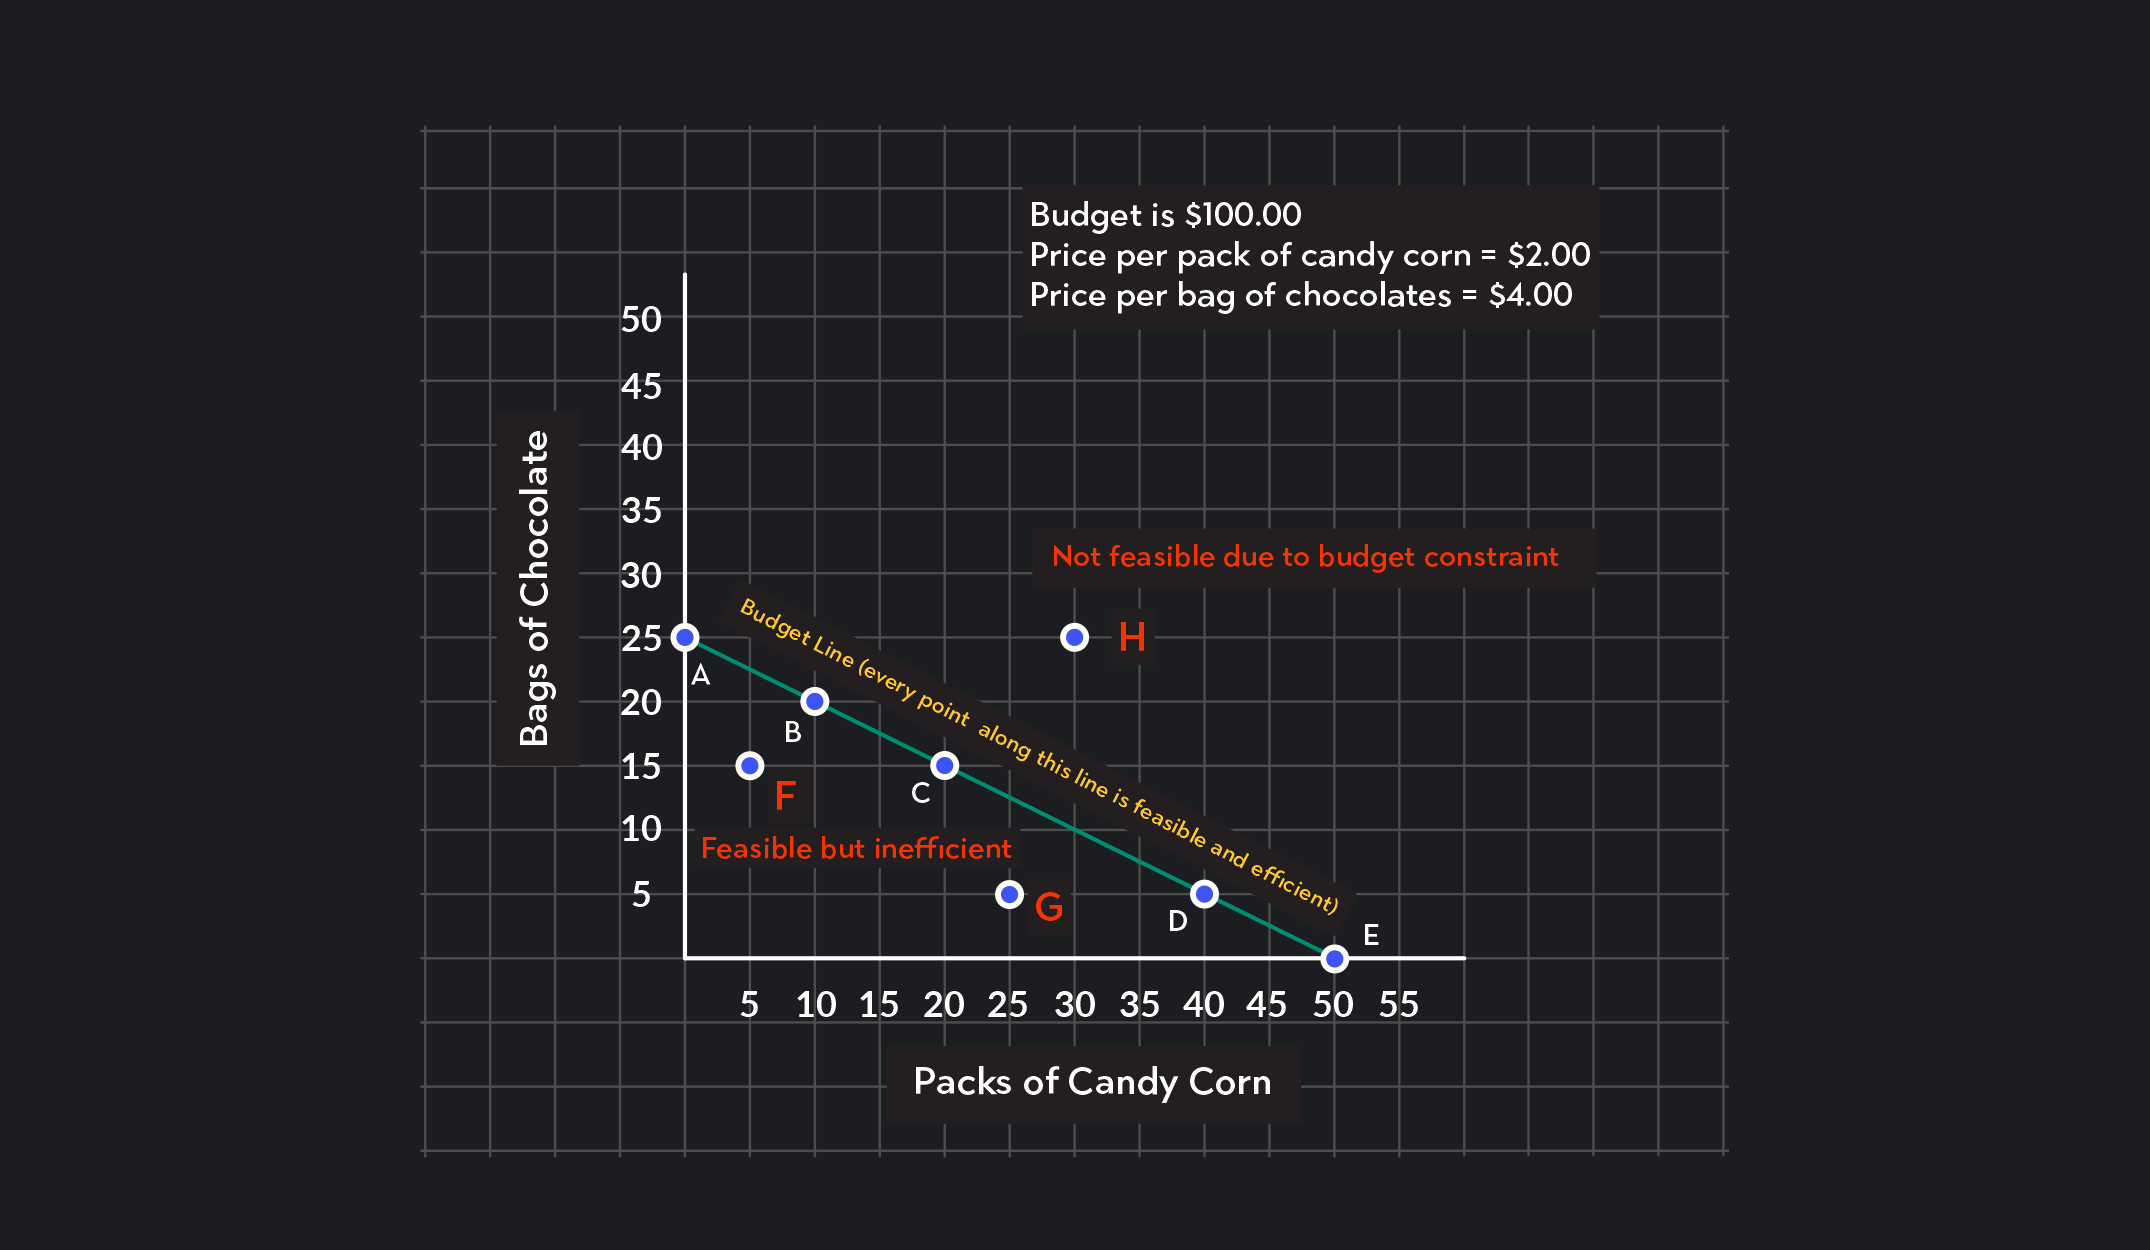
Any combination of goods that lies on the budget constraint OR below and to the left of the budget constraint is feasible given the consumer’s income. Points A, B, C, D, and E in our candy example are all feasible consumption bundles, but so are points F and G.
For feasible bundles, the total amount spent on the goods will be less than or equal to the budget:
≤ budget
Any combination that lies on the budget constraint is a feasible bundle that is also efficient. Points along the budget constraint represent bundles where the entire budget has been spent with no money left over. In our example, points A, B, C, D, and E, and any other point along the budget constraint are feasible and efficient consumption bundles.
For bundles that are both feasible and efficient, the total amount spent on the goods will be exactly equal to the budget:
= budget
Any point that lies above and to the right of the budget constraint represents an infeasible bundle. These bundles are not affordable given the existing budget. For example, Point H represents an infeasible bundle of 25 packs of chocolate and 30 packs of candy corn. Buying that bundle would cost $160, but you only have $100 to spend.
Bundles that are infeasible cost more than the budget:
As you may have already noticed, we can also express budget constraints as equations. The budget constraint formula is:
is the budget |
is the price of the good plotted on the horizontal axis |
is the quantity of the good on the horizontal axis |
is the price of the good plotted on the vertical axis |
is the quantity of the good on the vertical axis |
We can also rewrite the budget constraint equation to take the form of an equation for a line, which makes sense since the budget constraint in our graph is a straight line.
The equation of a straight line is:
is the value of the variable on the vertical axis |
is the slope of the line |
is the value of the variable on the horizontal axis |
is the vertical intercept |
Here’s the equation of a budget constraint line:
is the budget |
is the quantity of the good on the vertical axis |
is the price of the good plotted on the horizontal axis |
is the quantity of the good on the horizontal axis |
is the price of the good plotted on the vertical axis |
is the quantity of the good on the vertical axis |
There are three things to take note of in the above equation.
1. The slope is negative. The slope of the budget constraint is negative indicating that the budget constraint is downward sloping. Budget constraints are always downward sloping because to get more of one good, you must give up some of the other good.
2. The slope is equal to the divided price. The slope of the budget constraint is equal to the price of the good on the horizontal axis divided by the price of the good on the vertical axis.
3. The vertical intercept is equal to budget divided by price. The vertical intercept of the budget constraint is equal to the budget, B, divided by the price of the good on the vertical axis. This is the same calculation we used to find the maximum amount of chocolate you could afford in the candy example.
In economics, opportunity cost refers to what you have to give up in order to gain something else. Economists use opportunity costs to emphasize the fact that when resources are scarce, obtaining one thing comes at the cost of something else.
We can see opportunity costs at work in the budget constraint. If you are consuming a bundle on the budget constraint, the only way to increase your consumption of one of the two goods is to lower your consumption of the other. If you’re about to buy 20 packs of chocolate and 10 packs of candy corn, and you decide you actually want more candy corn, the only way to increase your consumption of candy corn is to reduce your consumption of chocolate! In a budget constraint with two goods, we calculate opportunity costs using the prices of goods.
The opportunity cost of consuming an additional unit of the good on the horizontal axis is equal to the price of that good divided by the price of the good on the vertical axis . This is equal to the slope of the budget constraint. In our candy example, the opportunity cost of consuming one more pack of candy corn is half a pack of chocolate = .
The opportunity cost of consuming an extra unit of the good on the vertical axis is . The opportunity cost of consuming one extra pack of chocolate is two packs of candy corn = 2.
When using budget constraints, economists assume that sunk costs do not affect the decisions consumers make. Sunk costs are costs that were incurred in the past that we cannot recover. These costs might be monetary or non-monetary, but we cannot recoup them. Rather than dwelling on consumption decisions that were made in the past, the budget constraint framework assumes that consumers only think about their current budgets and what they can buy with it.
A budget constraint tells you what you can and cannot afford to buy, but it does not tell you how much of each good you should buy. Consumer choices about which goods to buy will depend on each consumer’s preferences. If you don’t like the idea of giving out candy corn on Halloween, you might spend all your money on chocolates. If your neighbor loves the idea of handing out candy corn, they might spend more of their budget on candy corn and spend less of it on chocolate. Each individual consumer has different preferences, so depending on the consumer, the preferred bundle of goods will be different.
In economics, we model and map preferences using indifference curves, and if you use indifference curves together with budget constraints, you can model a consumer’s utility-maximizing point of consumption. A utility-maximizing point ties the concepts of budget constraints and consumer preferences together. It is the point that maximizes a consumer’s satisfaction (or benefit) subject to a budget constraint.
You can use budget constraints to analyze consumption patterns for many other things than Halloween candy. Below are three examples of budget constraints. Based on the information given, see if you can answer some of the questions.
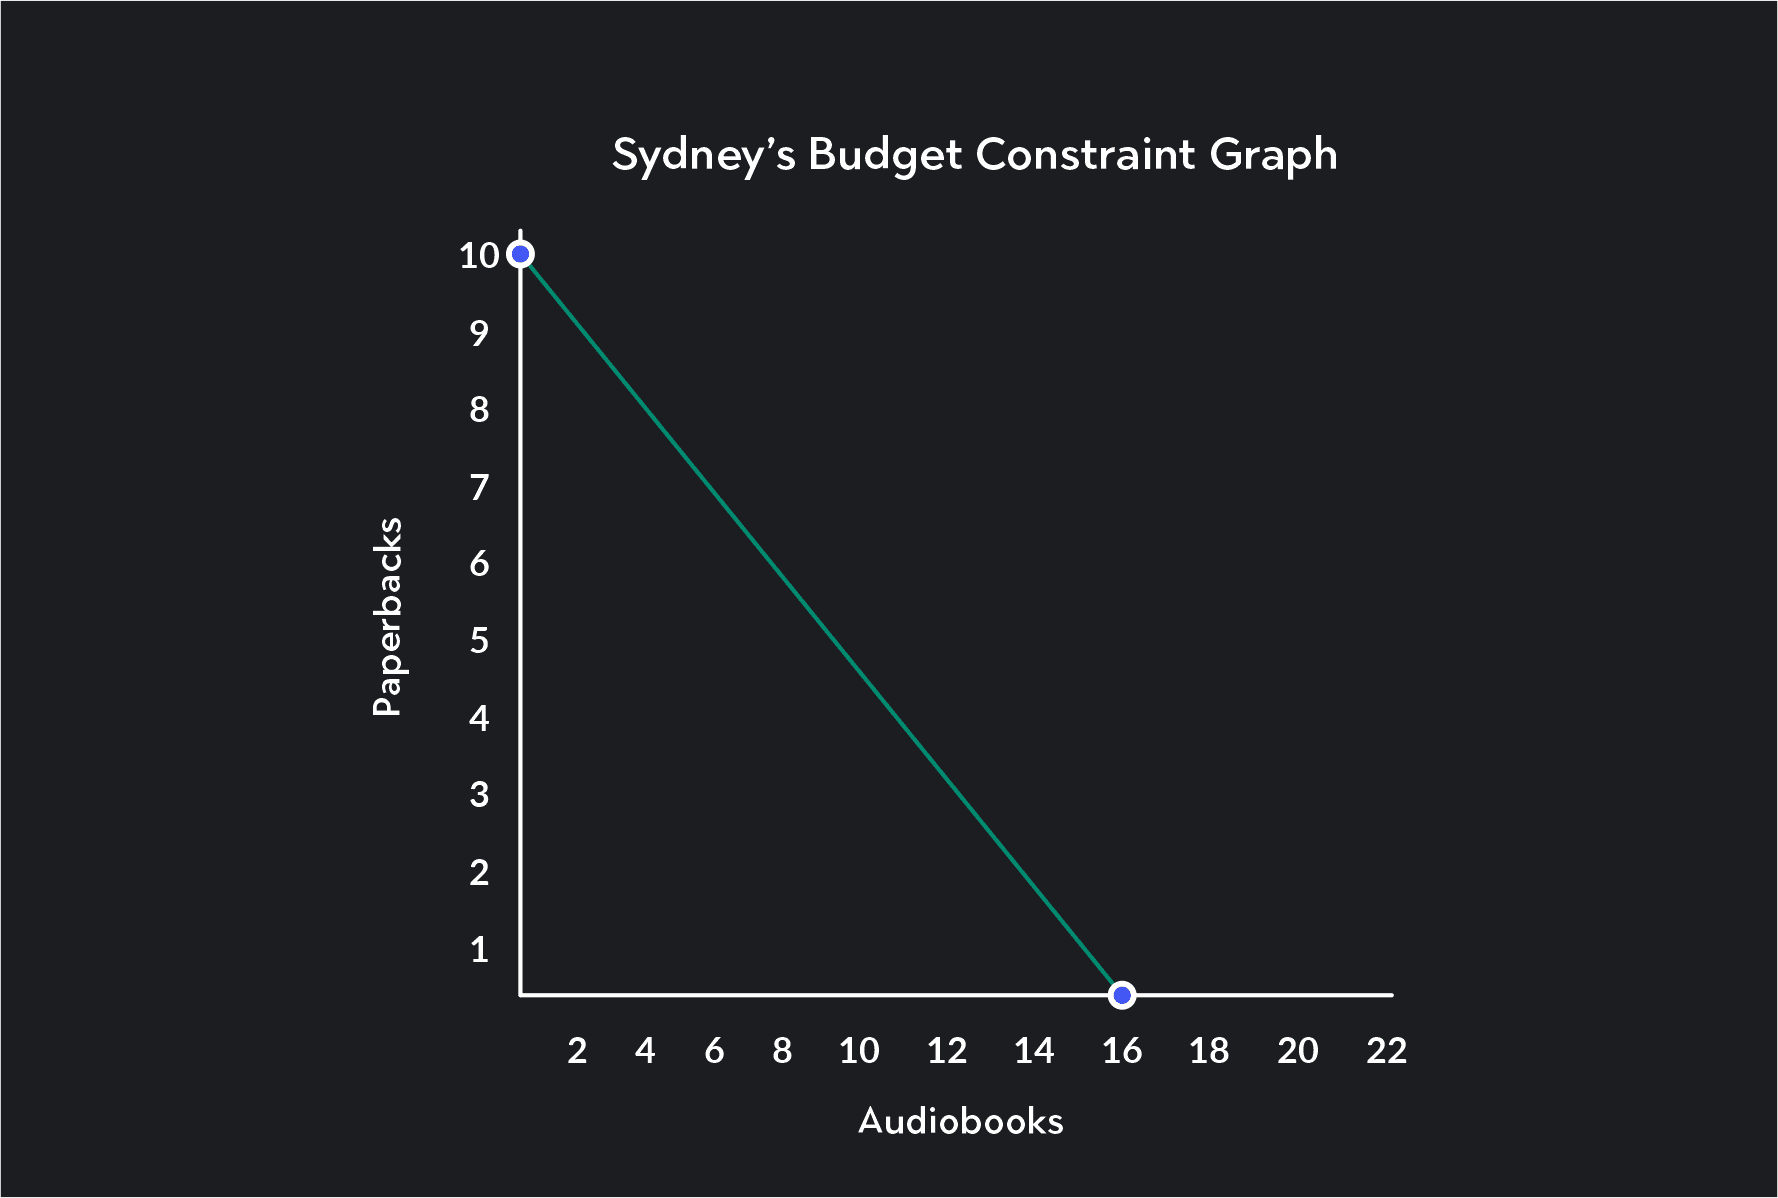
Sydney is an avid consumer of books and buys new books every month. Her monthly book budget is $80, which she can spend buying paperbacks and audiobooks. Paperbacks cost $10 per book, and audiobooks cost $5 per book.
What is the maximum number of paperbacks Sydney can buy each month?
What is the maximum number of audiobooks Sydney can buy each month?
Draw Sydney’s budget constraint.
Given the amount of money she has, can Sydney afford to buy a bundle with five paperbacks and seven audiobooks?
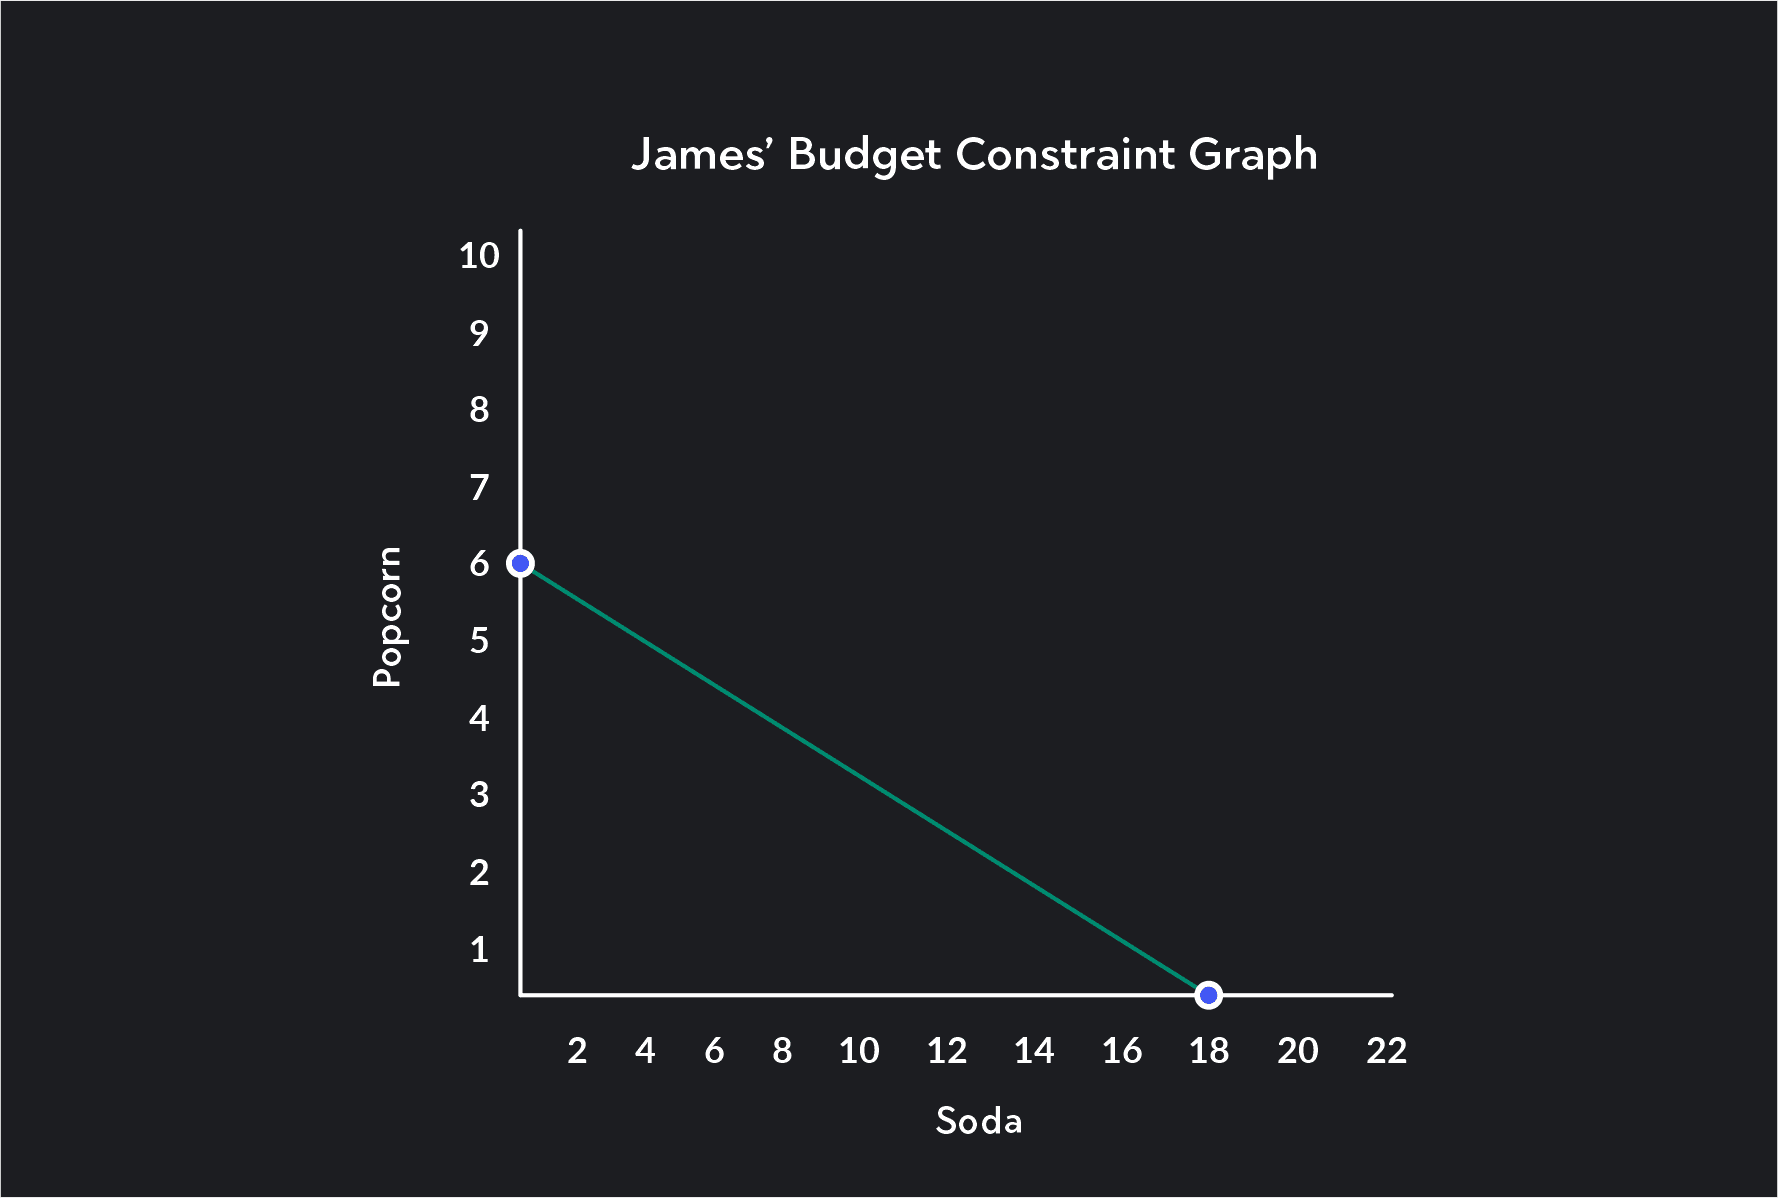
James is at the movie theater and has $54 to spend on popcorn and soda for himself and his kids. Popcorn costs $9 per pack, and sodas cost $3 per soda.
Draw James’ budget constraint?
Write out the formula for James’ budget constraint as an equation for a line.
How much popcorn and soda should Jame buy?
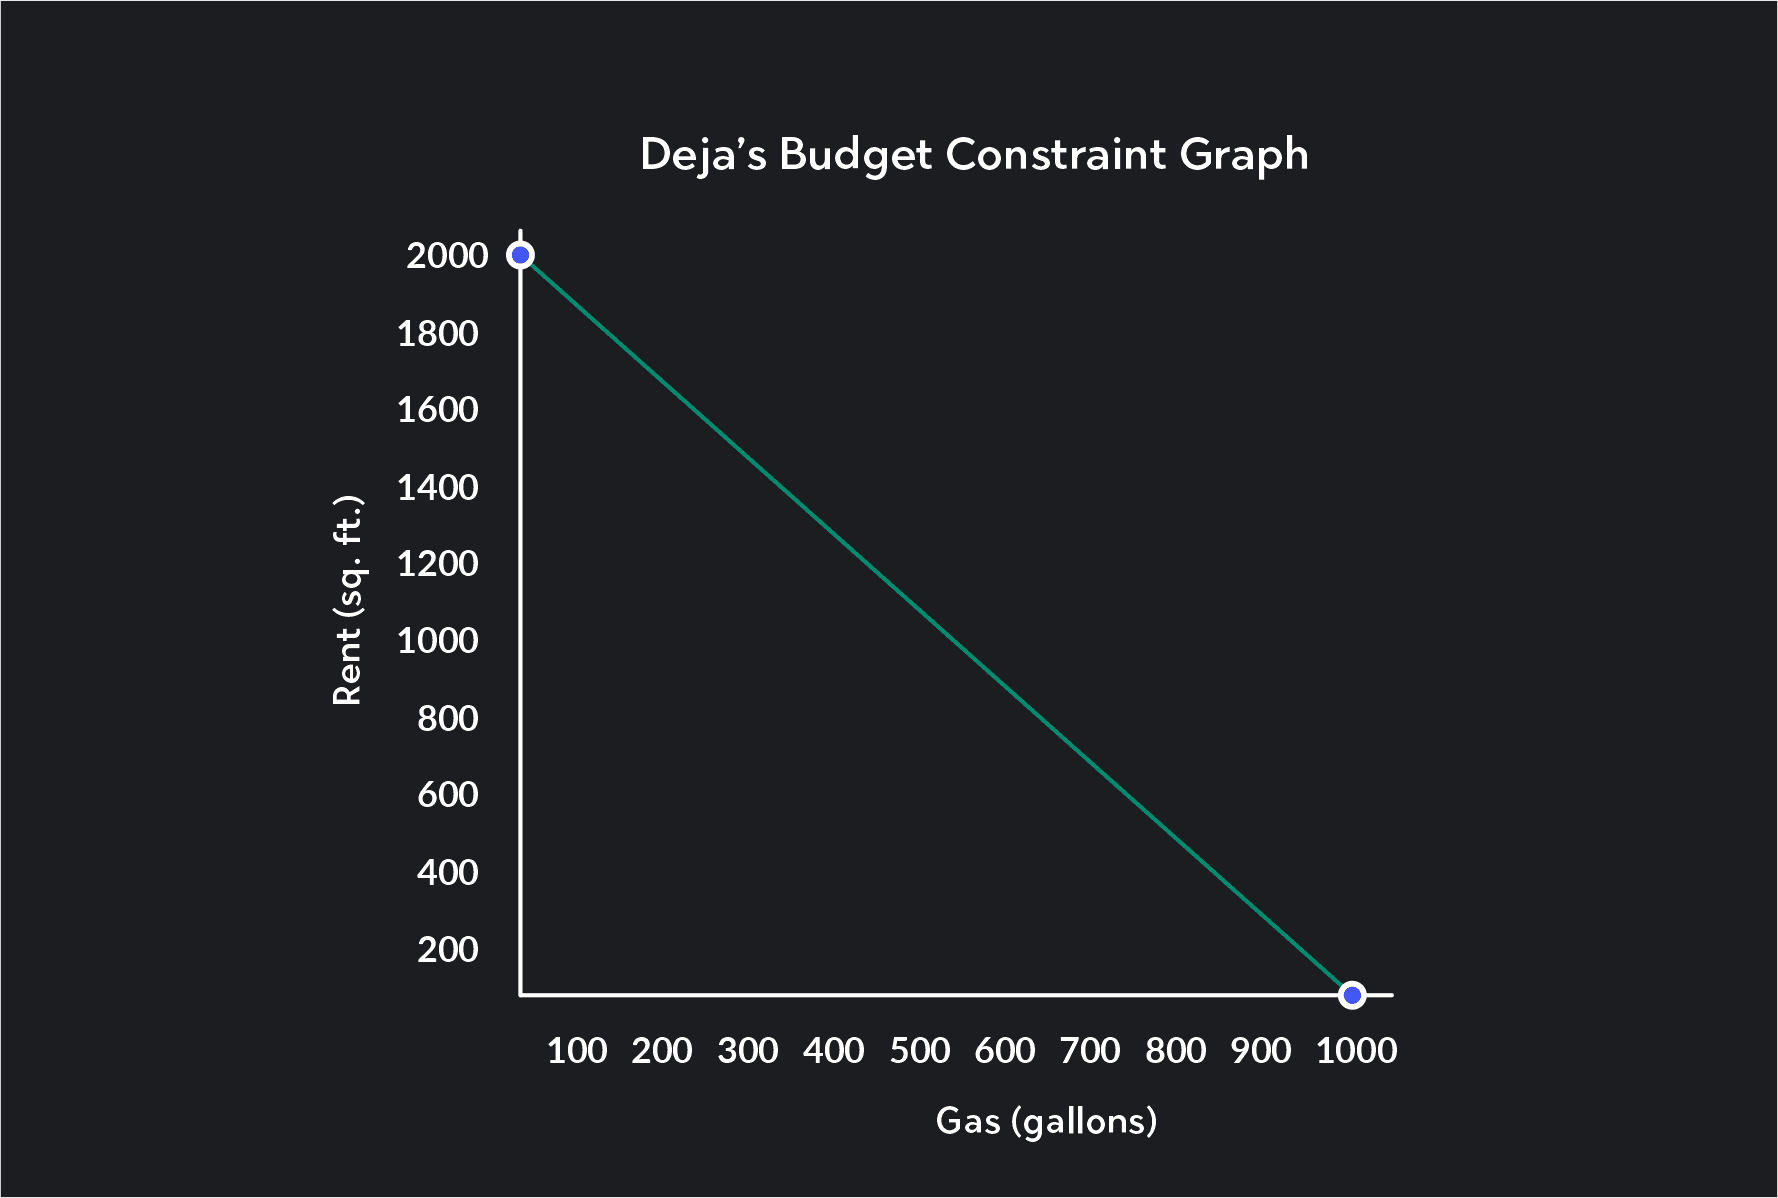
Deja wants to use $3,000 of her monthly income on rent and gas for her car. Rent in her city costs $150 for every 100 square feet, and gas is $3 per gallon.
Draw Deja’s budget constraint.
What is the opportunity cost of an extra 100 square feet in an apartment in terms of gas?
Challenge question! What is the opportunity cost of an extra gallon of gas in terms of square footage in an apartment?
The maximum number of paperbacks Sydney can afford each month is $80 ÷ $10 = 8. The maximum number of audiobooks Sydney can afford each month is $80 ÷ $5 = 16. A bundle with 5 paperbacks and 7 audiobooks is NOT a feasible bundle for Sydney. It lies beyond her budget constraint and would cost $85.
The equation for Jame’s budget constraint is:
+ 6
We cannot say how much popcorn or soda James should buy. His consumption choice depends on his preferences, which we do not have information about.
For Deja, the opportunity cost of an extra 100 square feet in an apartment in terms of gas is $150 ÷ $3 = 50 gallons. Deja would have to give up 50 gallons of gas a month for an apartment with an extra 100 square feet. The opportunity cost of an extra gallon of gas in terms of square footage is $3 ÷ $150 = 0.02 of 100 square feet, so Deja would have to give up 0.02 x 100 = 2 square feet for every extra gallon of gas she wants to consume.
Outlier (from the co-founder of MasterClass) has brought together some of the world's best instructors, game designers, and filmmakers to create the future of online college.
Check out these related courses:


Economics
Learn about what a supply curve is, how a supply curve works, examples, and a quick overview of the law of demand and supply.
Subject Matter Expert

Economics
This article gives a quick overview of perfect competition in microeconomics with examples.
Subject Matter Expert

Economics
This article is a comprehensive guide on the causes for a demand curve to change. Included are five common demand shifter examples.
Subject Matter Expert