In economics, a demand curve is a graph showing the relationship between the price of a good or service and the quantities of the good or service consumers are willing to buy.
Demand curves can be straight lines or curves, but they almost always slope downward following the Law of Demand—the observation that all other things being equal, consumers will demand less of a good at higher prices and more of the good at lower prices.
As an example of the law of demand, think of oranges (or any other fruit you like) sold at a farmer's market. How many oranges would you buy if the price was $5 per orange? All else being equal, if the price per orange was $1, would you buy more or less? Your answer is likely more. The law of the demand and the downward slope of demand curves describes an inverse relationship between price and quantity demanded.
Dr. Homa Zarghamee gives a good overview of the demand curve:
How Does the Demand Curve Work?
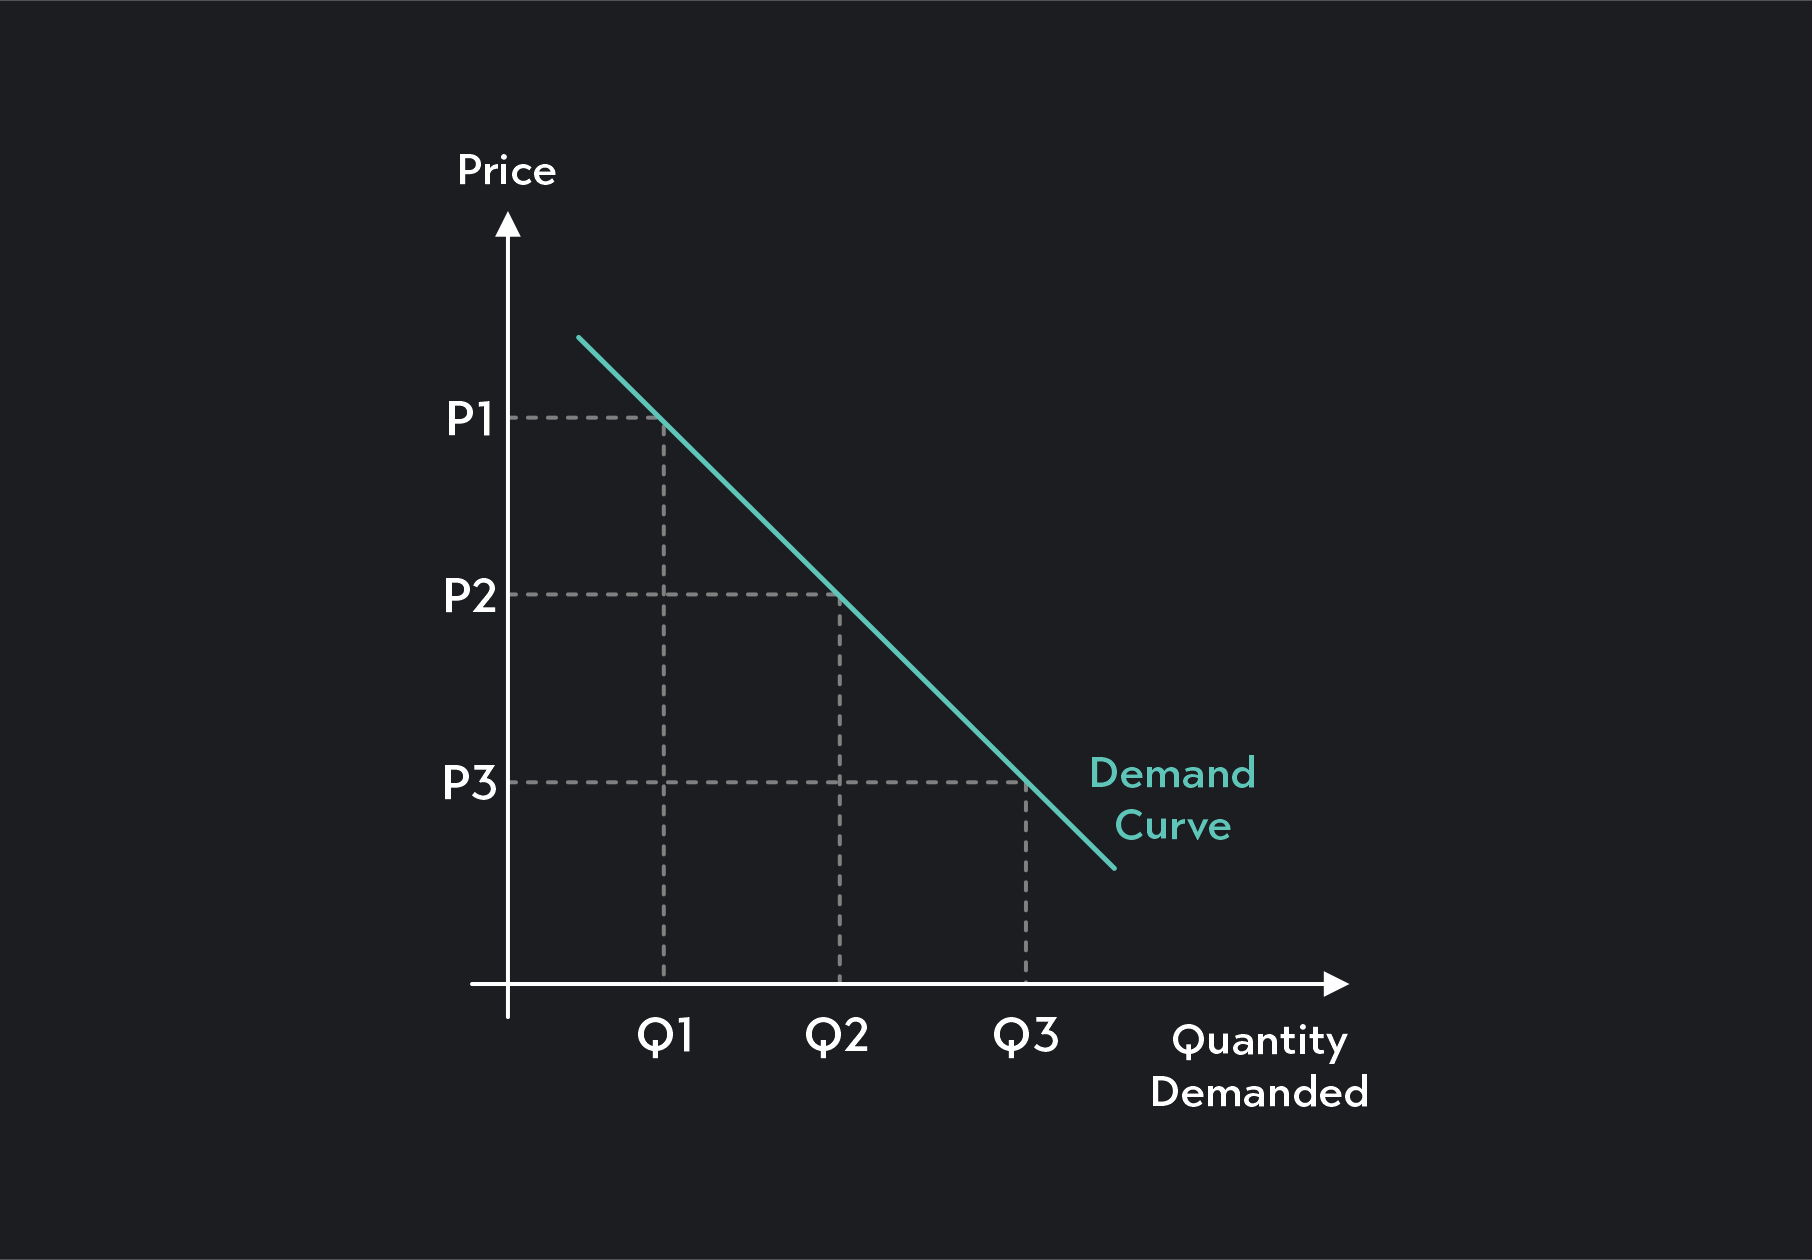
On a demand curve graph, you plot prices on the vertical axis (or y-axis) and quantities on the horizontal axis (or x-axis).
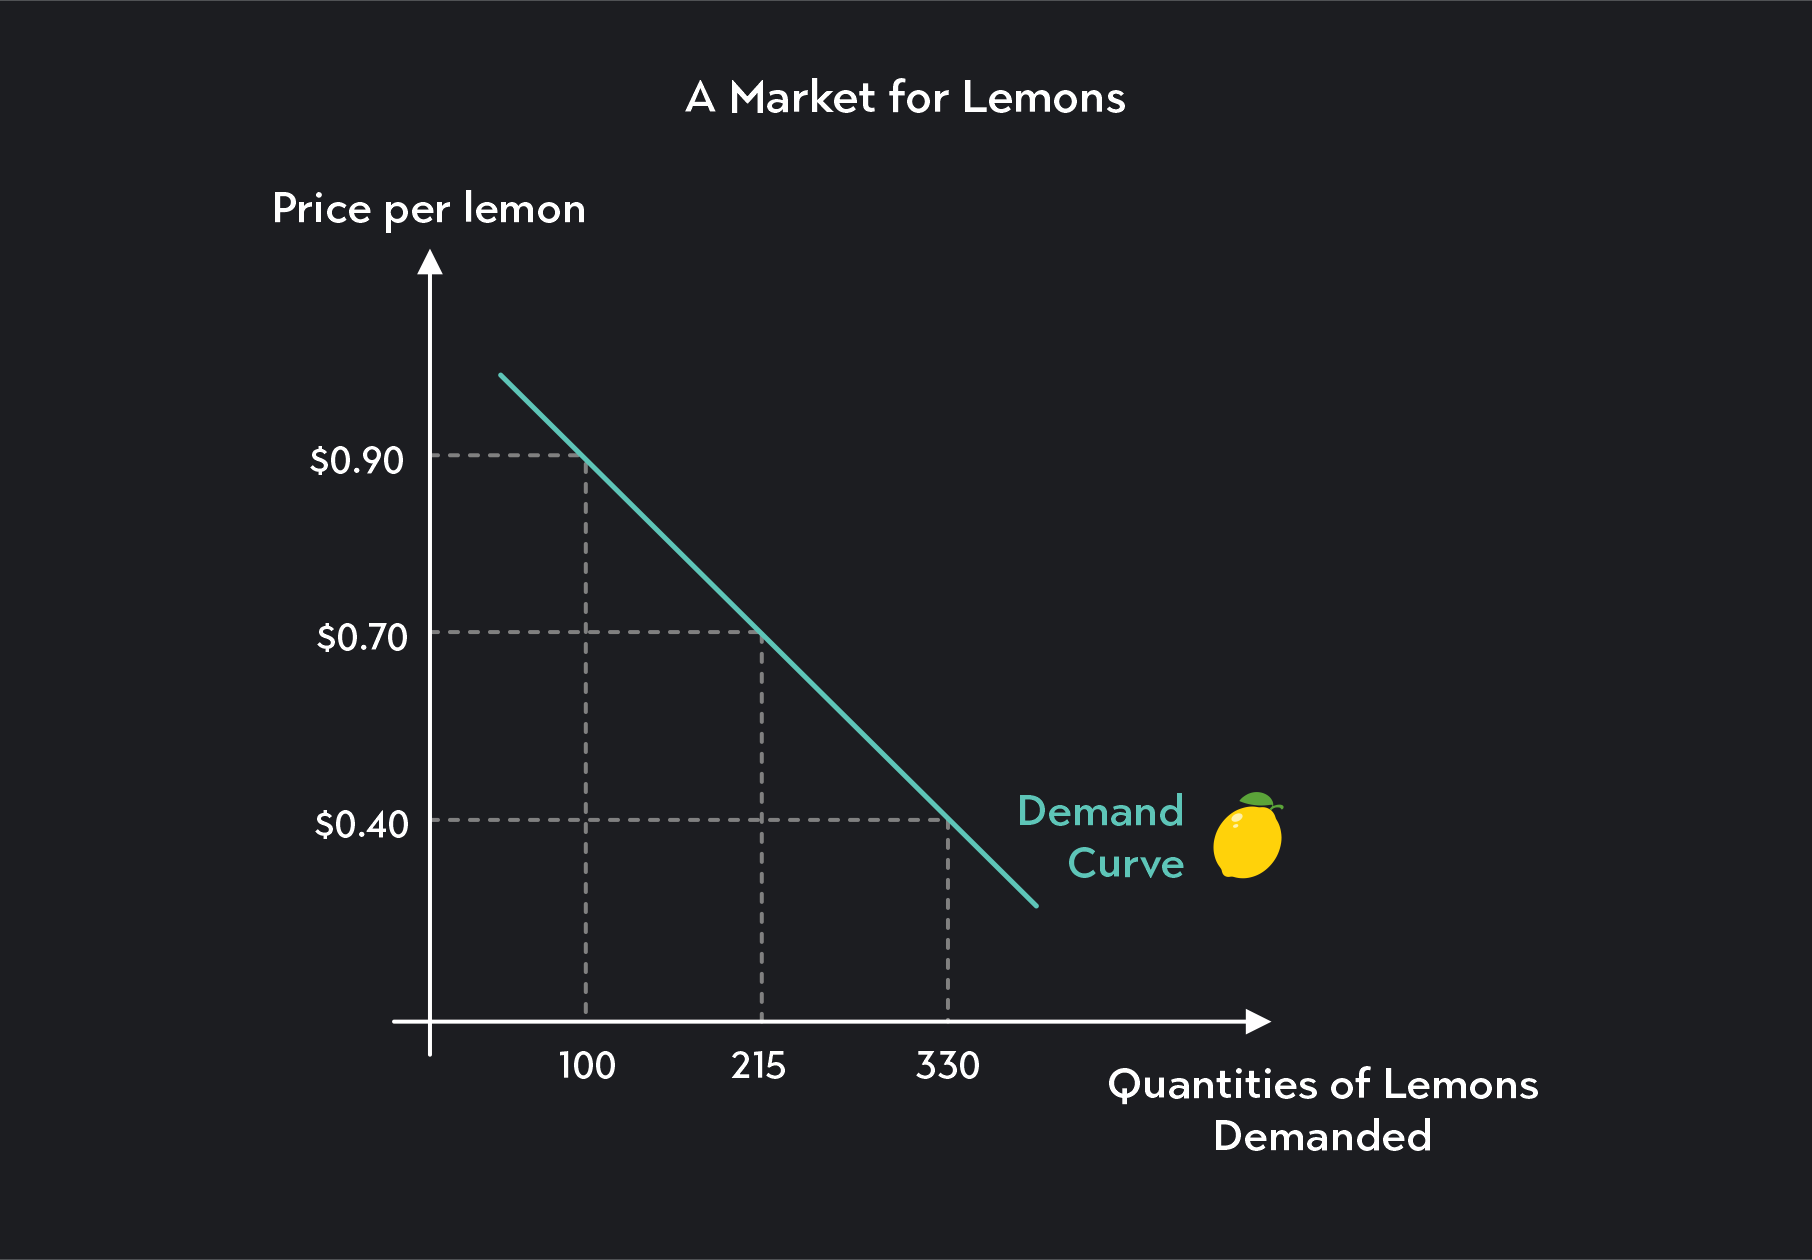
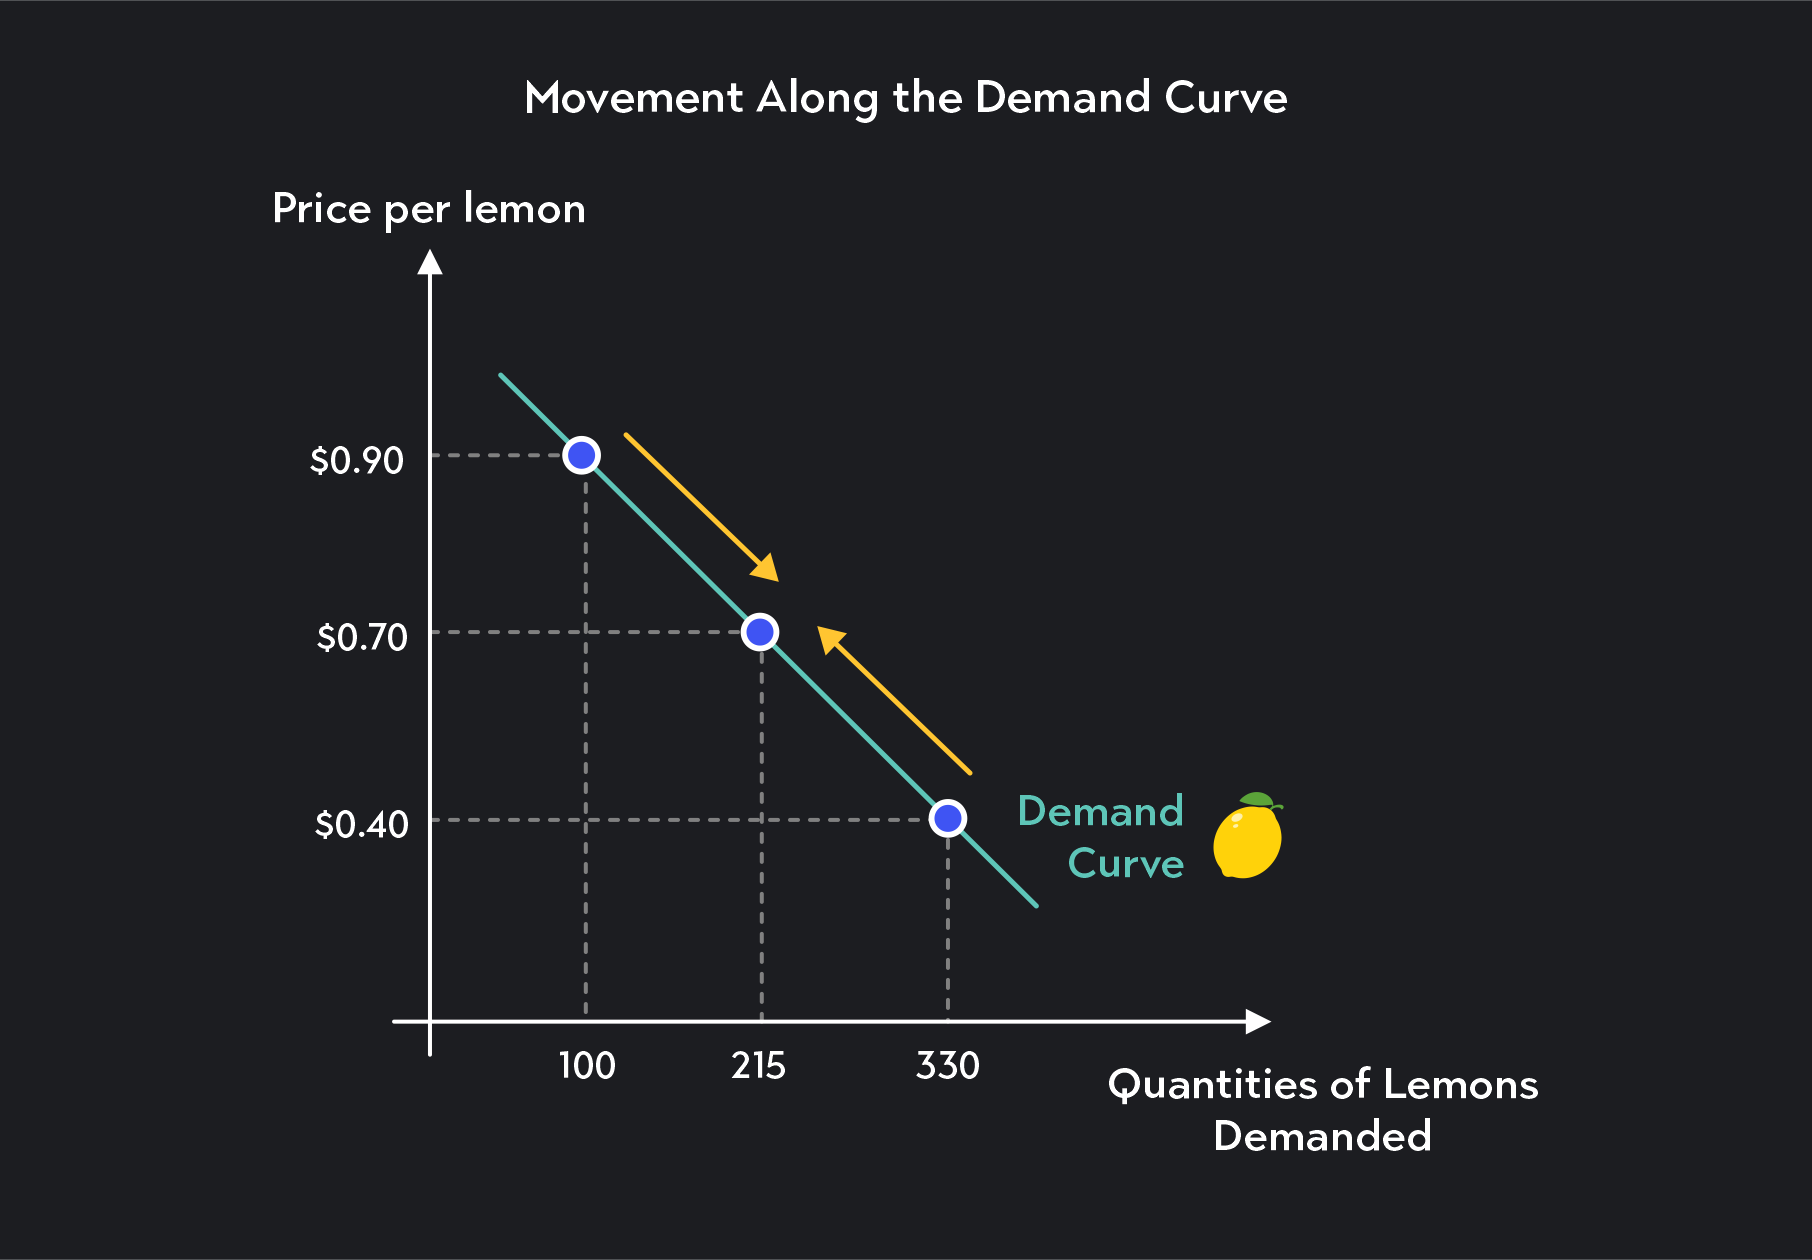
The demand curve below shows demand in a market for lemons. As you can see, the per unit price of lemons is on the vertical axis. The quantities demanded at various prices are shown on the horizontal axis.
Consumers in this market are willing to purchase 100 lemons at a price of $0.90. If the price falls, they are willing to buy more. For example, at $0.70, they are willing to buy 215 lemons, and at $0.40, they are willing to buy 330 lemons. Every point on a demand curve links a particular price to a specific quantity demanded.
2 Ways To Read a Demand Curve
You can read a demand curve in two ways:
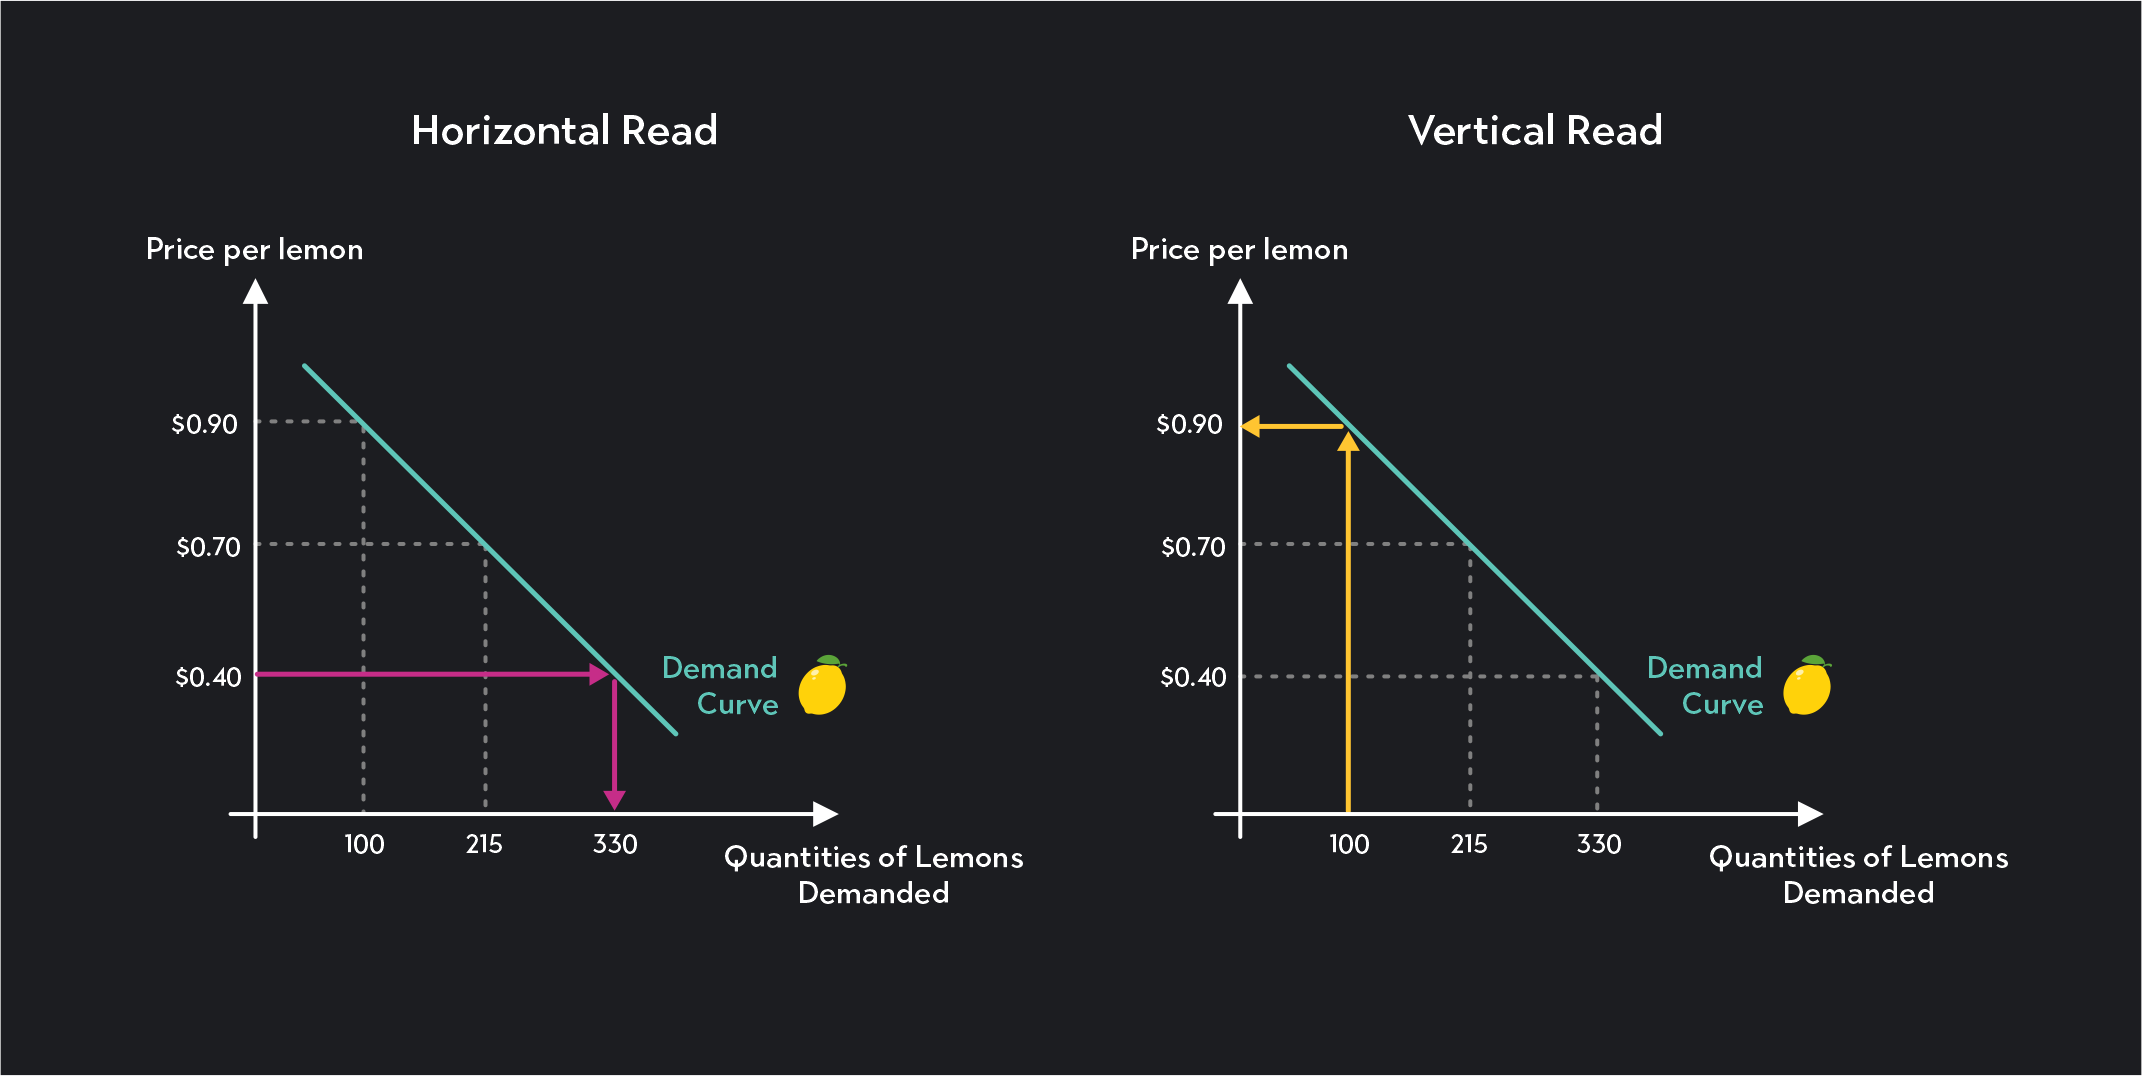
1. Horizontal Read
In a horizontal read of the demand curve, you start with a price, move horizontally to the demand curve, and then down to the x-axis to find the associated quantity demanded.
At $0.40 per lemon, consumers are willing to buy 330 lemons.
2. Vertical Read
In a vertical read of the demand curve, you start with a quantity, move vertically up to the demand curve, and then across to the left to find the associated maximum price consumers are willing to pay for that quantity of the good.
For the 100th lemon, consumers are willing to pay at most $0.90.
Types of Demand Curves
While the downward slope of a demand curve reflects the law of demand, the steepness of the demand curve can tell you about the price elasticity of demand.
Price elasticity of demand measures the sensitivity of consumer demand in response to changes in price. It tells you whether the quantity demanded changes by a lot or a little as the price increases or decreases.
You can calculate the elasticity of demand by dividing the percentage change in quantity demanded by the percentage change in price. In both cases, you should use the absolute value of the percentage change.
Price Elasticity of Demand=| % change in price || % change in quantity demanded |
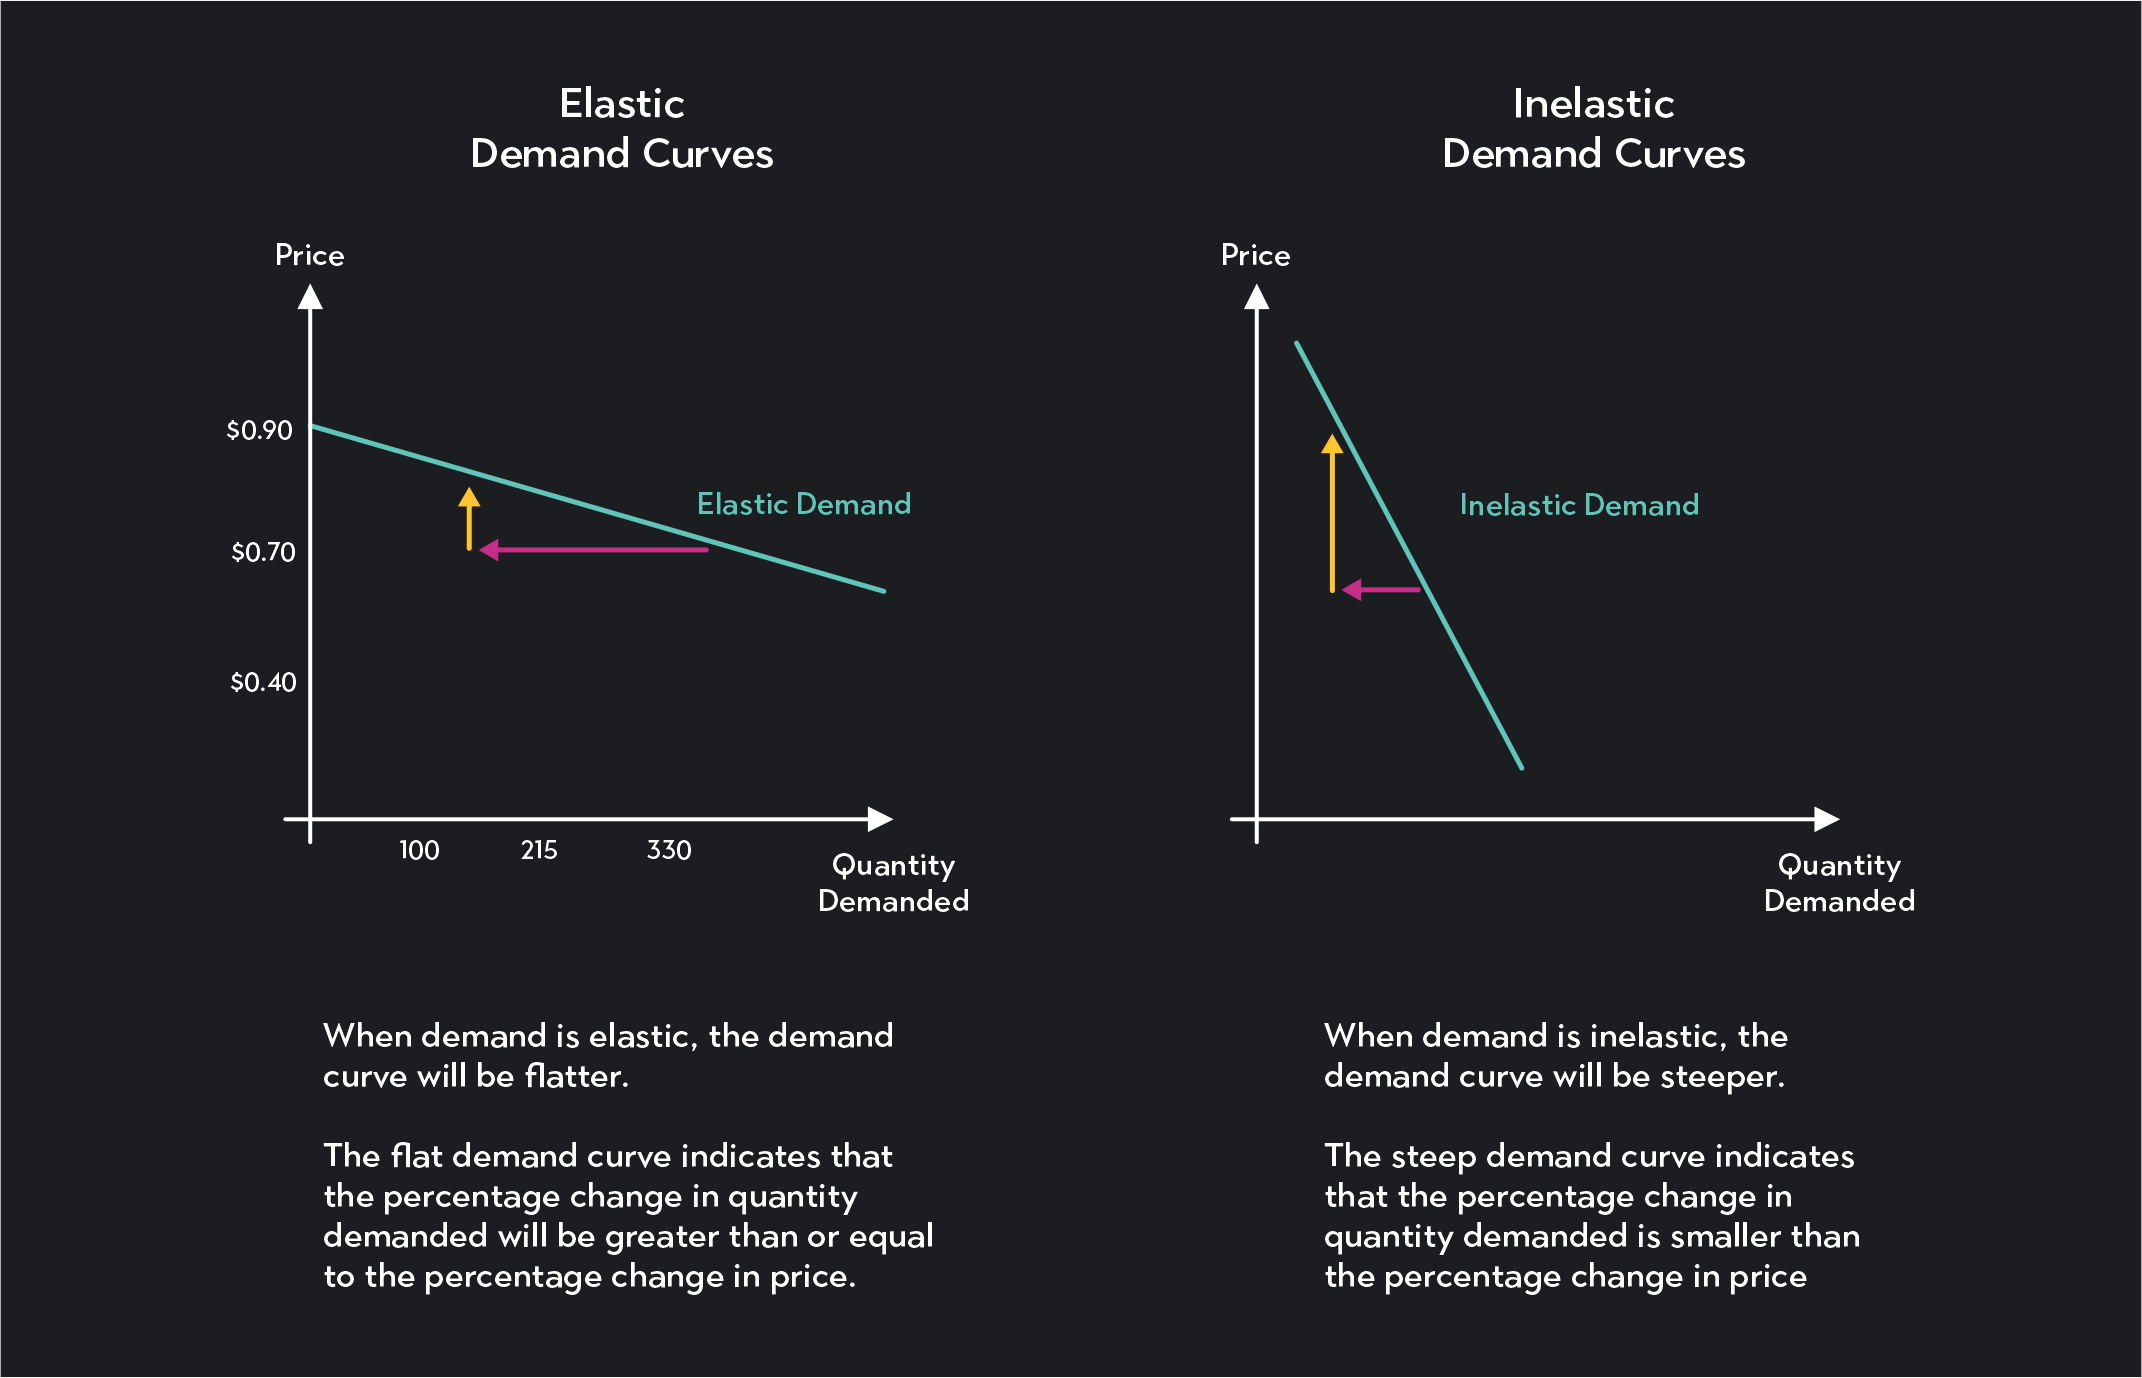
Elastic Goods Mean a Flatter Demand Curve
Elastic goods are goods or services for which demand is sensitive to price changes. Goods and services that are elastic have a price elasticity greater than or equal to one. This means a given percentage change in price will result in an equivalent or greater percentage change in quantity demanded.
When demand is elastic, the demand curve is relatively flat—i.e., it has a gentler slope.
Inelastic Goods Mean a Steeper Demand Curve
Inelastic goods are goods or services for which demand is relatively insensitive to price changes.
For inelastic goods, the price elasticity is less than 1, meaning the percentage change in quantity demanded is smaller than the percentage change in price.
When demand is inelastic, the demand curve is steeper. Keep in mind, however, although price elasticity and the slope of the demand curve are related, they are not the same thing. An elasticity of 1 does not mean the slope of the curve is equal to 1.
Individual Demand & Market Demand
Demand curves can show a single buyer’s demand, or they can show the total demand of all buyers in a market.
Demand curves that show a single buyer’s demand are called individual demand curves, and demand curves that show total demand across all buyers in the market are called market demand curves. A market demand curve is the horizontal summation of the individual demand curves for all buyers in a market.
Movement Along the Demand Curve
When economists talk about demand curves, they distinguish between movements along the demand curve and shifts of the demand curve.
A movement along a demand curve compares two or more points along a single demand curve. When you study a movement, you compare the quantity demanded at different price points while holding all other relevant factors constant. This assumption that all other relevant factors are held constant is a simplifying assumption that economists call the ceteris paribus assumption.
Shifts of the Demand Curve
In reality, factors other than price can affect consumer demand. A demand curve shift represents a change in one of these other factors.
Increase in Demand or Rightward Shift of the Demand Curve
A rightward shift of the demand curve implies something has caused an overall increase in consumer demand. The entire demand curve shifts to the right to indicate that consumers are now willing to buy more goods at every price. At every price, the quantity demanded will be higher on the shifted demand curve.
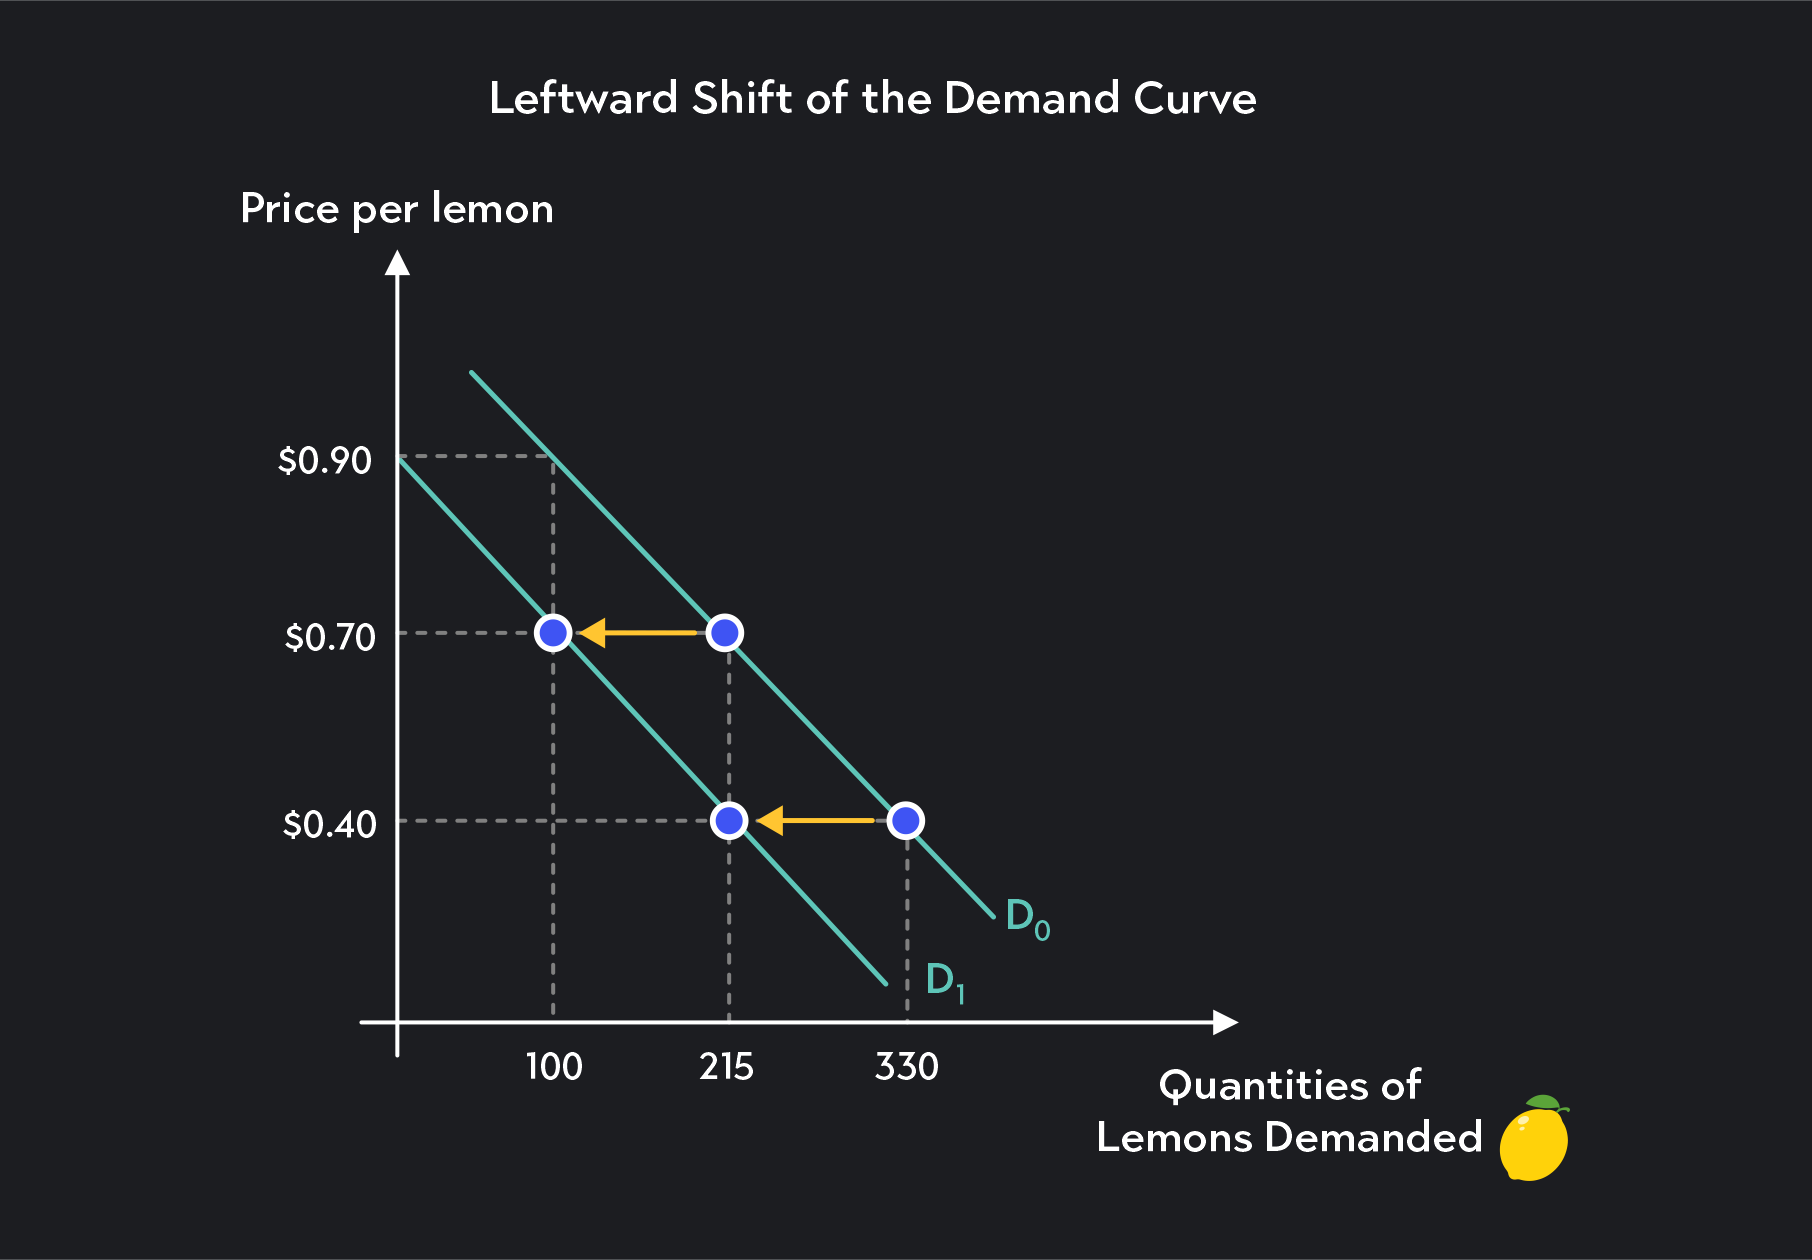
Decrease in Demand or Leftward Shift of the Demand Curve
A leftward shift of the demand curve implies something has caused an overall decrease in consumer demand. The entire curve shifts to the left to indicate that consumers are now willing to buy fewer goods at every price. The quantity demanded will be lower than before the shift at any given price.
The graph below shows an example of a leftward demand shift from D_0 to D_1. The leftward shift indicates an overall decrease in demand. Choose any price, and you’ll notice that the quantity demanded is lower for the new demand curve D_1 than for the initial demand curve D_0.
Originally, at a price of $0.70, consumers demanded 215 lemons, but after the shift, quantity demanded is reduced to 100 lemons. Similarly, at a price of $0.40, consumers were originally willing to buy 330 lemons but are now only willing to purchase 215.
5 Factors That Shift the Demand Curve
Demand can shift for many reasons. Below are five common determinants of demand that can shift the demand curve.
1. Changes in Consumer Incomes
When consumer incomes increase, demand for most goods and services increases—a rightward shift of the demand curve. Such goods and services are called normal goods. When consumer incomes decrease, demand for normal goods will decrease—a leftward shift of the demand curve.
Some exceptions exist to this general rule. Inferior goods are goods and services for which demand and income move in opposite directions. Think of cheap food like boxed mac and cheese or instant noodles. When consumer incomes decrease, demand for these products will increase as consumers try to stretch their incomes further by buying cheaper (or inferior) things. When consumer incomes go up, demand for inferior goods decreases.
2. Changes in Consumer Preferences
Tastes and preferences also affect demand. If a product suddenly becomes fashionable, demand for it will increase—a rightward shift. Similarly, if a product loses popularity, demand will decrease—a leftward shift.
3. Changes in Price of Related Goods & Services
Goods and services can have complements and substitutes.
A complement is a product often consumed together with another—think hamburgers and hamburger buns. All else being equal when the price of a good decreases, demand for its complement will increase. If the price rises, demand for the complement will decrease.
Substitute goods are goods or services that can be consumed in place of other goods and services—think movie tickets at two different theaters. Ceteris paribus, if the price of a product goes up, demand for its substitute will increase since the substitute becomes relatively cheaper. The opposite is also true. If the price of a good or service goes down, demand for its substitute will decrease as the substitute becomes relatively more expensive.
4. Changes in Consumer Expectations About the Future
Expectations about the future can also shift consumer demand. For example, consumers might hold off on buying a smartphone, a laptop, or even a house, if they think that prices will come down in the near future. Alternatively, they might rush to the store if they hear that prices are expected to increase.
5. Changes in Number of Consumers & Other Demographic Changes
Last but not least, demographics and the number of buyers in a market will affect demand. If a neighborhood suddenly experiences an influx of residents, demand for drinks at the local pub may increase. If the number of people who have pets increases, demand for dog food and grooming services could increase. More generally, if the number of consumers in a market increases, demand increases, and vice versa.
Supply and Demand
Just as you can use a demand curve to represent consumer demand, you can use a supply curve to represent the quantities sellers are willing to sell at various prices.
Together, the supply and demand curves make up the supply and demand model and can be used to model competitive markets, as well as, other market structures. Using a supply and demand model, you can identify the market equilibrium price and quantity. You can also model how the equilibrium changes if the supply and/or demand curves shift.
Outlier (from the co-founder of MasterClass) has brought together some of the world's best instructors, game designers, and filmmakers to create the future of online college.