
Statistics
What Are Quartiles? Statistics 101
Learn what quartiles are and how they work in statistics. Understand how to calculate them and why even learn them.
Sarah Thomas
Subject Matter Expert

Statistics
03.31.2023 • 4 min read
Subject Matter Expert
Learn what the interquartile range is, why it’s used in Statistics and how to calculate it. Also read about how it can be helpful for finding outliers.
In This Article
Take Intro to Statistics Online with Outlier.org
From the co-founder of MasterClass, earn transferable college credits from the University of Pittsburgh (a top 50 global school). The world's best online college courses for 50% less than a traditional college.
Get started
In statistics, the interquartile range (IQR) is the difference between the third quartile of your data and the first quartile of your data.
A quartile is one of three markers that divide your data into four equally sized groups, each containing roughly a quarter of your data points.
The first quartile (also called the lower quartile or Q1) marks the 25th percentile of your data, and the third quartile (also called the upper quartile or Q3) marks the 75th percentile.
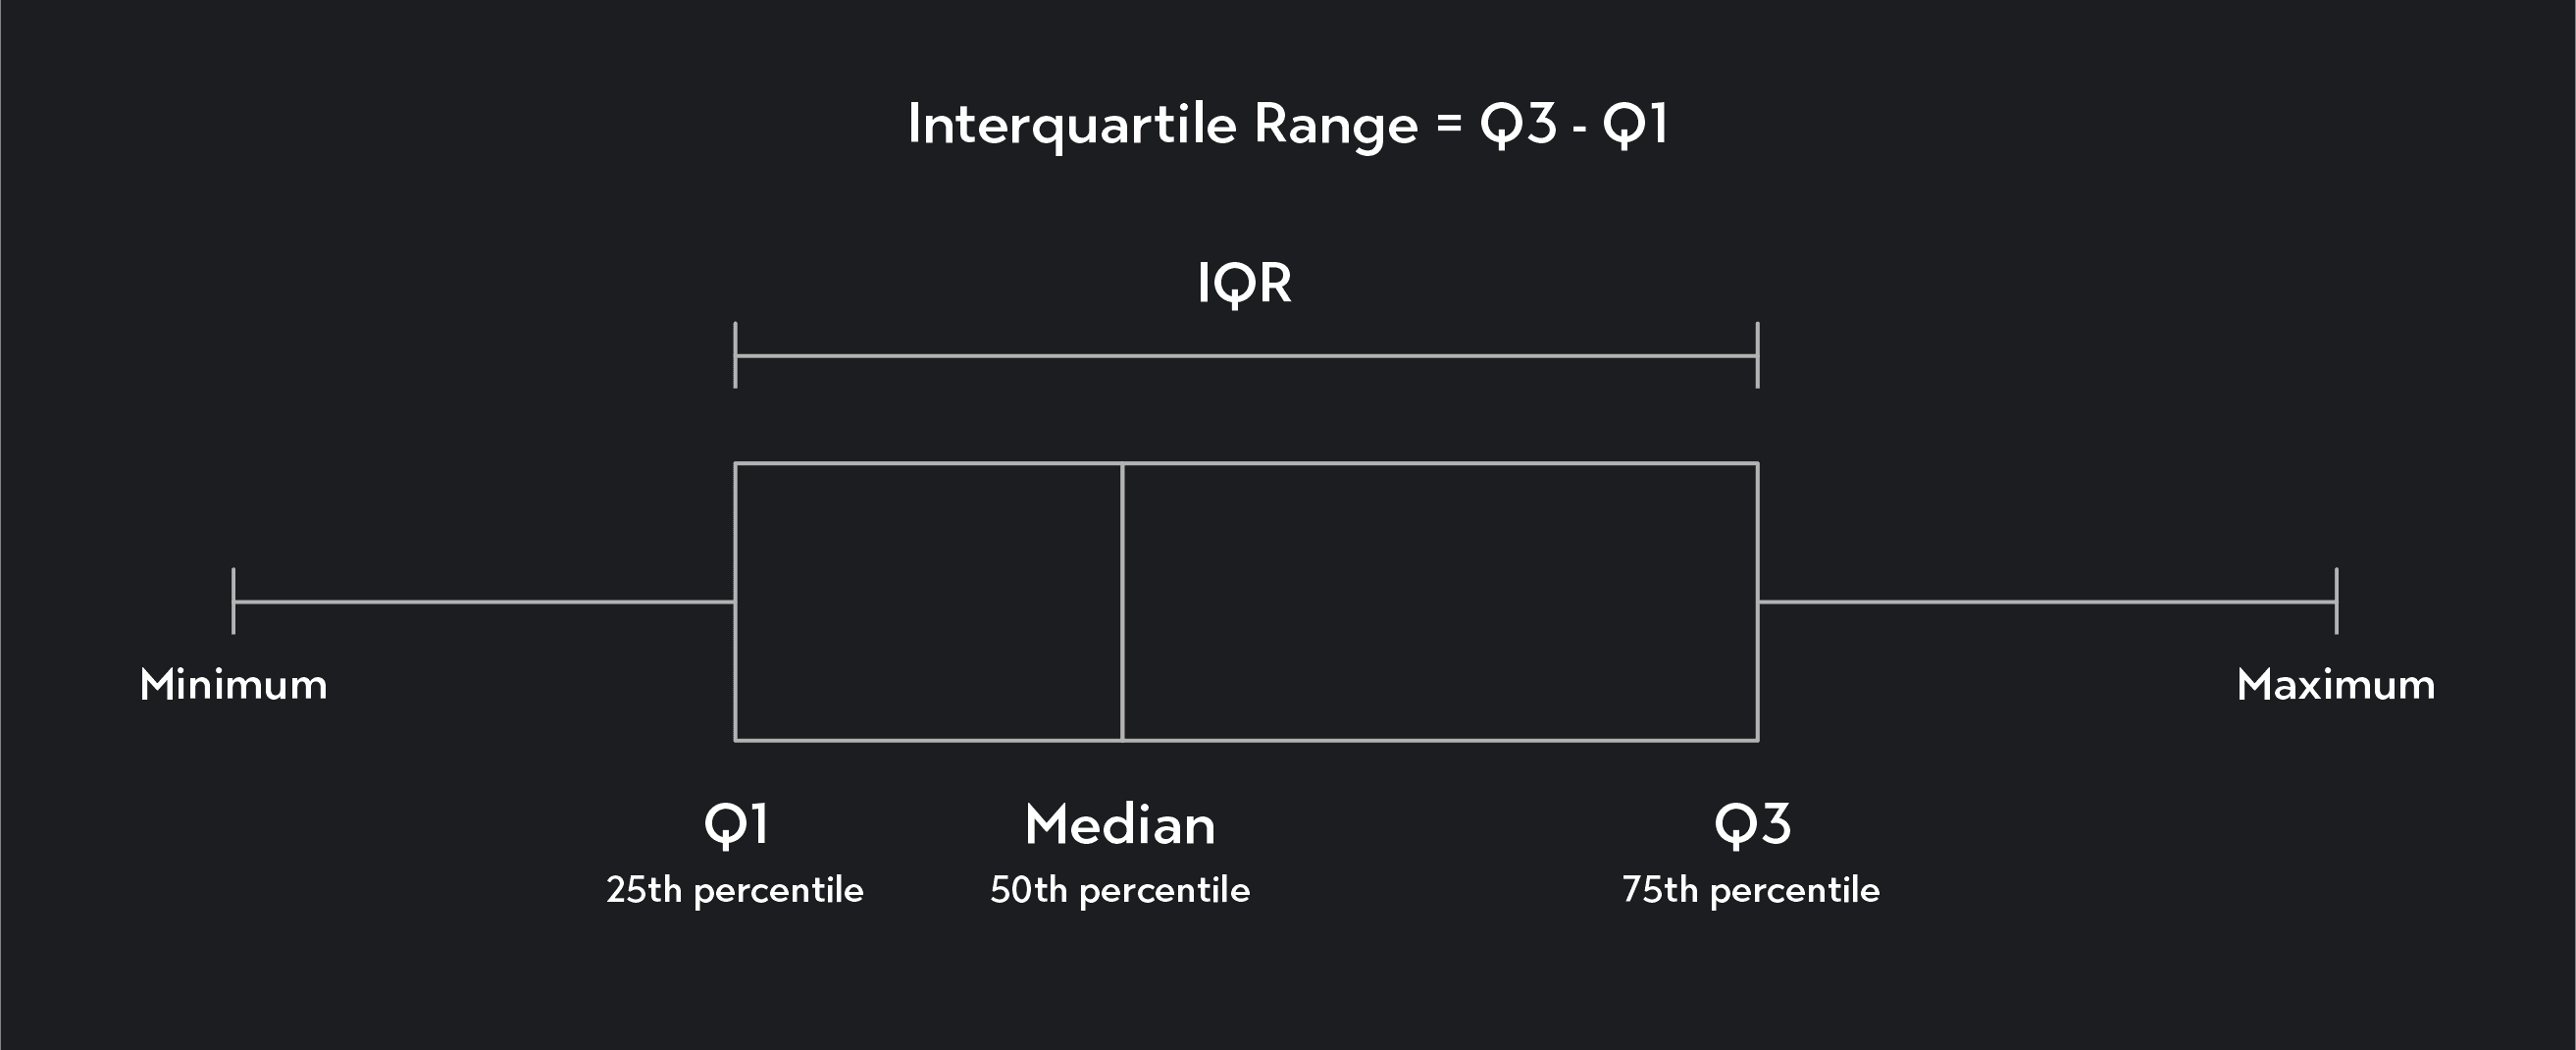
The interquartile range is useful because it tells you how spread out the middle 50 percent of your data is. It gives you the range of values between the 25th percentile and the 75th percentile.
The IQR is also useful as it can be used to identify outliers. We’ll show you how you can do this later in this article, but let’s first take a look at how to calculate the IQR itself.
To calculate the interquartile range, follow these steps.
Count the number of data points and arrange them from smallest to largest. Arrange your data in ascending order from the lowest to the highest value and find the total (n) number of data points.
If you have 10 data points, for example, n=10.
To find Q1, multiply n by 25/100 (or ¼). This will give you a locator value, L.
If L is a whole number, take the average of the Lth value of the data set and the (L+1)th value. This average will be your first quartile.
If L is not a whole number, round L up to the nearest whole number and find the corresponding value in the data set.
To find Q3, use the same method used to find Q1, except this time, multiply n by 75/100 (¾) to get the locator value, L.
Find the interquartile range by subtracting Q3 from Q1.

Now that you know the steps for calculating the IQR by hand, let’s apply the steps to a couple of examples. Notice that we have already taken the step of arranging the data in ascending order.
Find the IQR for the following data set.
Solution:
n=10
The locator value for Q1 is = 2.5
Q1 = 30
The locator value for Q1 is = 7.5
Q3 = 80
IQR = 80-30 = 50
Find the IQR for the following data set.
Solution:
n=16
The locator value for Q1 is = 4
Q1 = (75+78)/2 = 76.5
The locator value for Q1 is = 12
Q3 = (93+95)/2 = 94
IQR = 94-76.5 = 17.5
We can calculate the interquartile range several other ways. Depending on what method you use, you may get slightly different results. Above, we used the locator method for calculating the IQR, but here are a few other methods you may encounter.
An alternative method for calculating the IQR is to first identify the median of your data. The median is also called the second quartile of your data (or Q2). It divides data into two equal groups and marks the 50th percentile of your data.
To find the median, arrange your data in ascending order. If the number of data points you have is odd, the median will be the middle value of your data. If you have an even number of data points, the median will be the average of the two middle numbers in your data.
Once you’ve identified the median of your data, your data will be divided into two equal groups: a lower half and an upper half. You can find Q1 by taking the median of the lower half of the data, and you can find Q3 by taking the median of the upper half of the data. Once you’ve identified Q1 and Q3, you can subtract Q1 from Q3 to find the IQR.
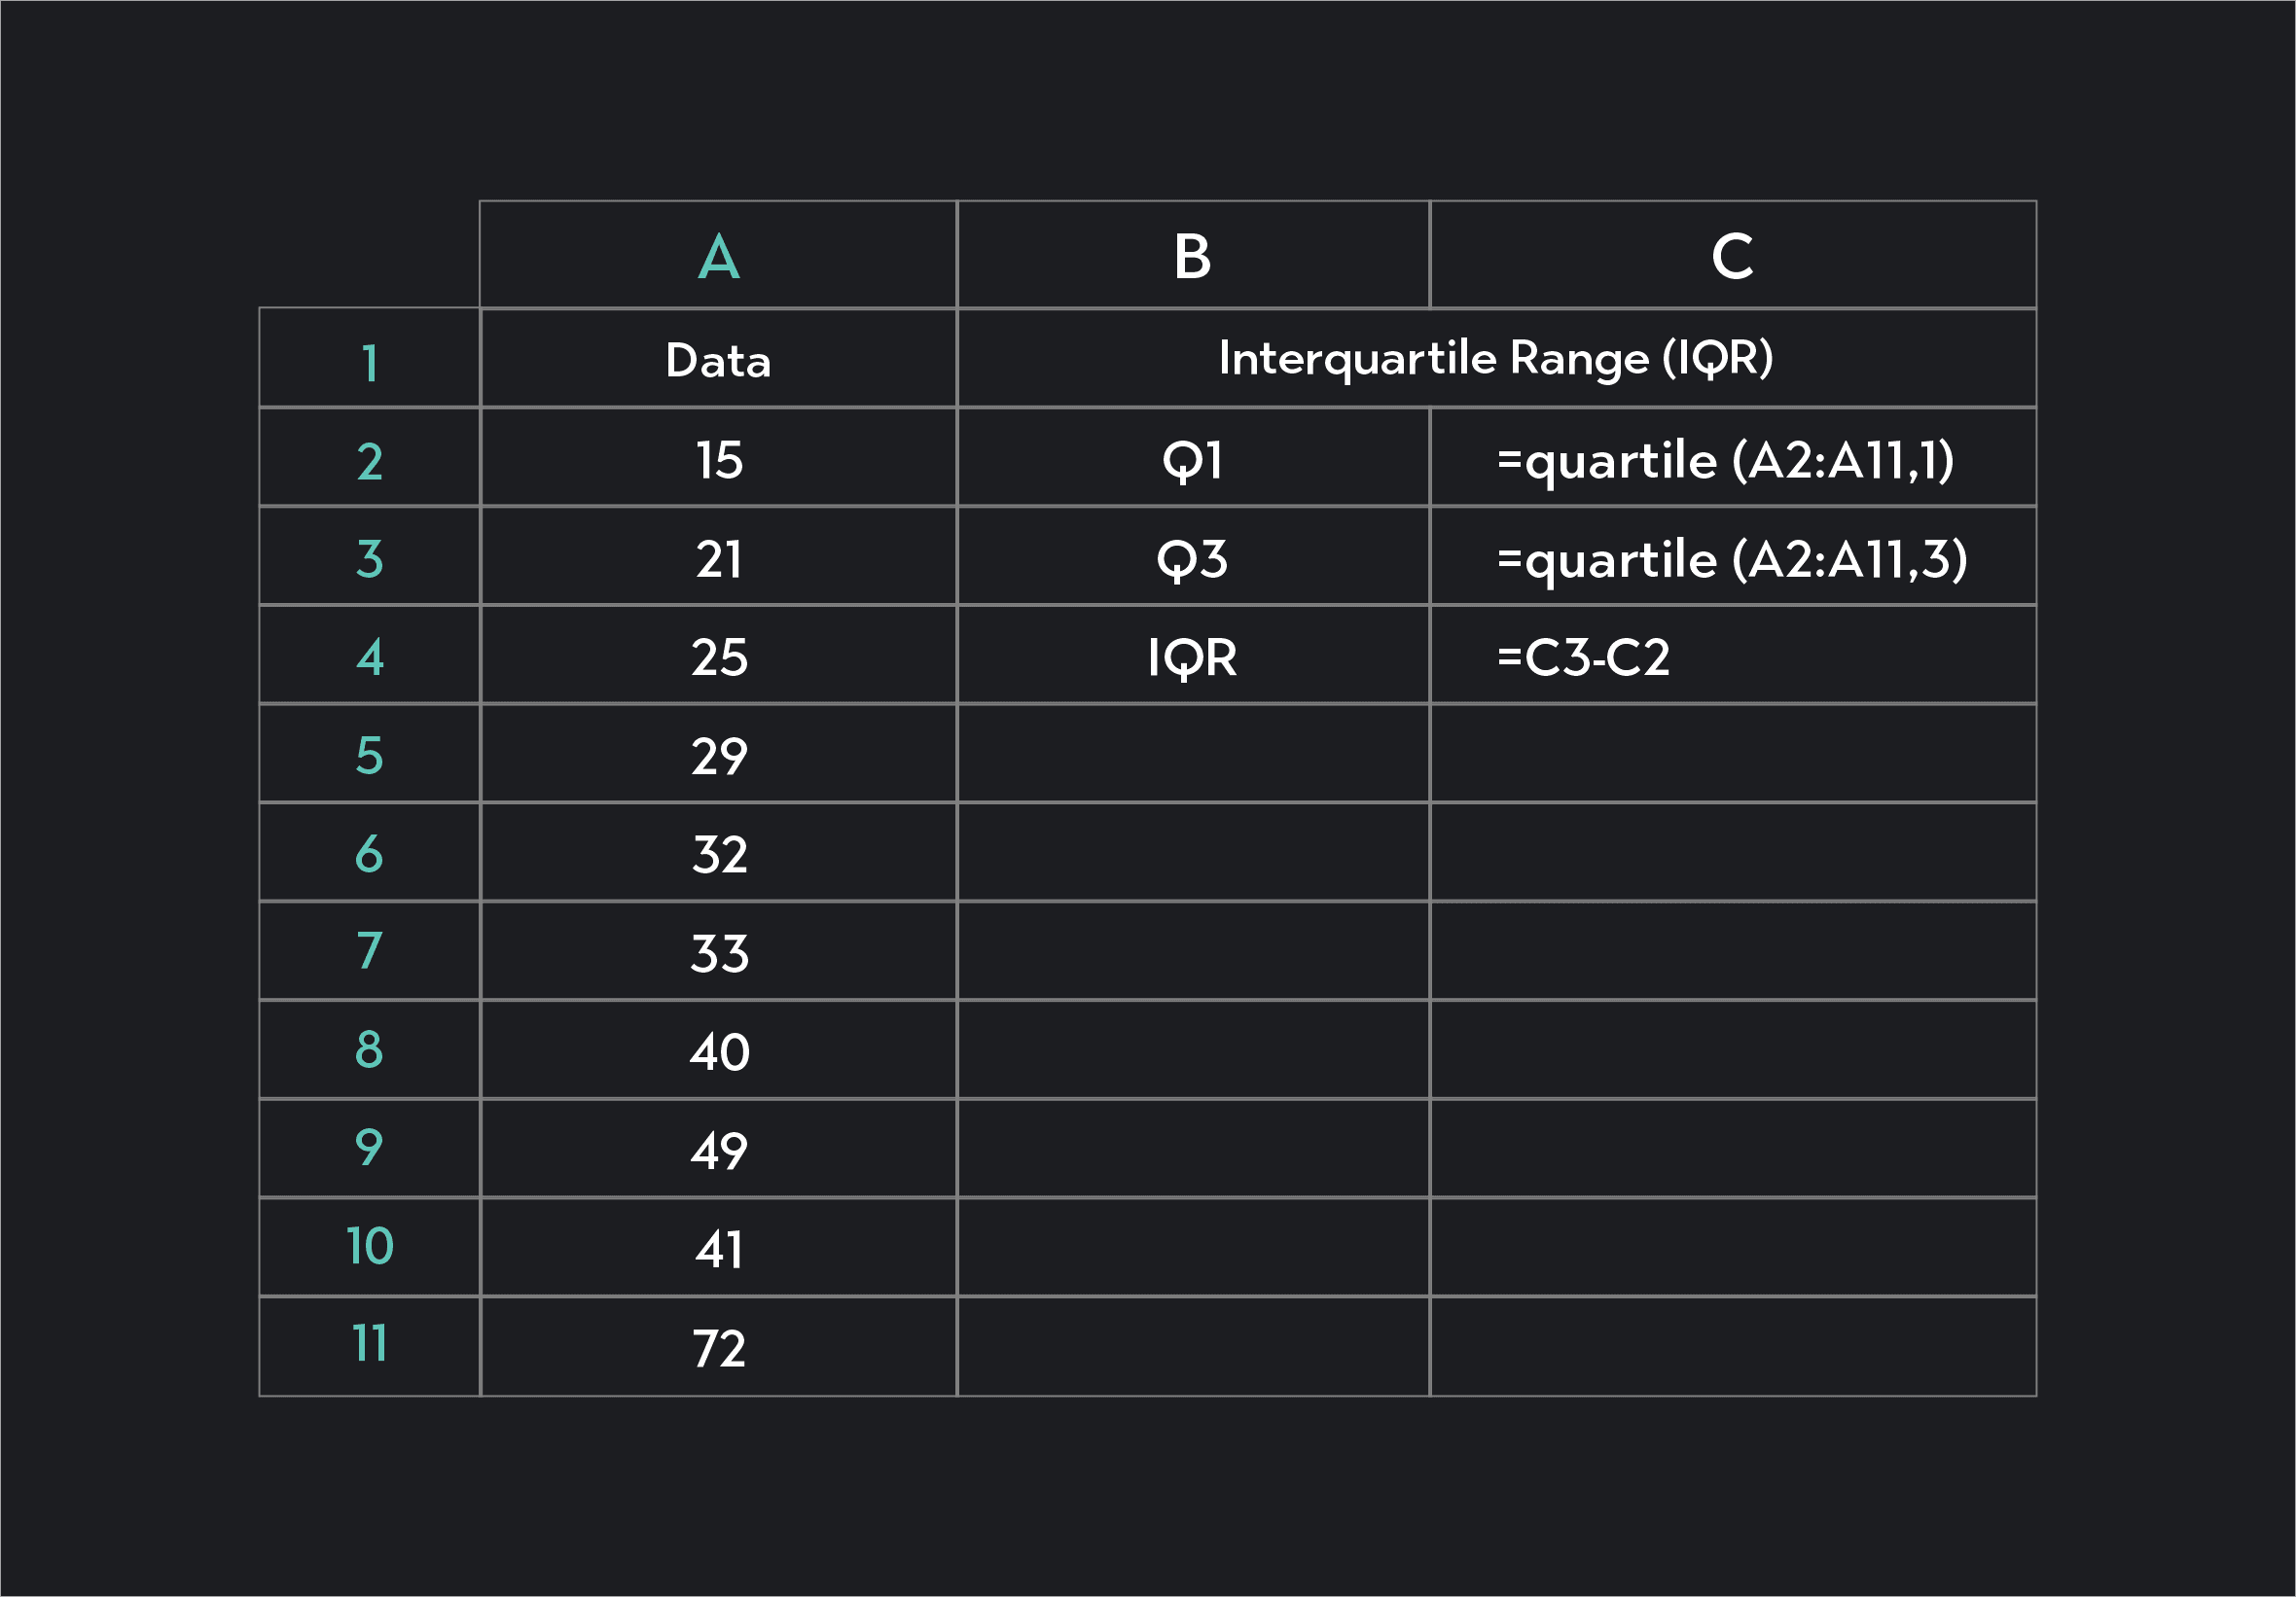
In Excel or Google sheets, you can find the IQR using the =QUARTILE() function.
Suppose you have data in cells A2 through A11 in your spreadsheet. You can find the IQR using these steps.
Find Q1 by typing: =Quartile(A2:A11, 1). Within the parentheses, you first include your data range (A2:A11), followed by a comma and the number 1 for Q1.
Find Q3 by typing: = Quartile(A2:11, 3). The function is the same as the one used in the first step, only this time, you’ll type a 3 before the closing parenthesis. This 3 stands for Q3.
Finally, subtract Q1 from Q3 to get the IQR.
You can find the interquartile range in R, using the IQR() function. For example, if your data is stored as a variable x, you would simply type IQR(x) to find the interquartile range.
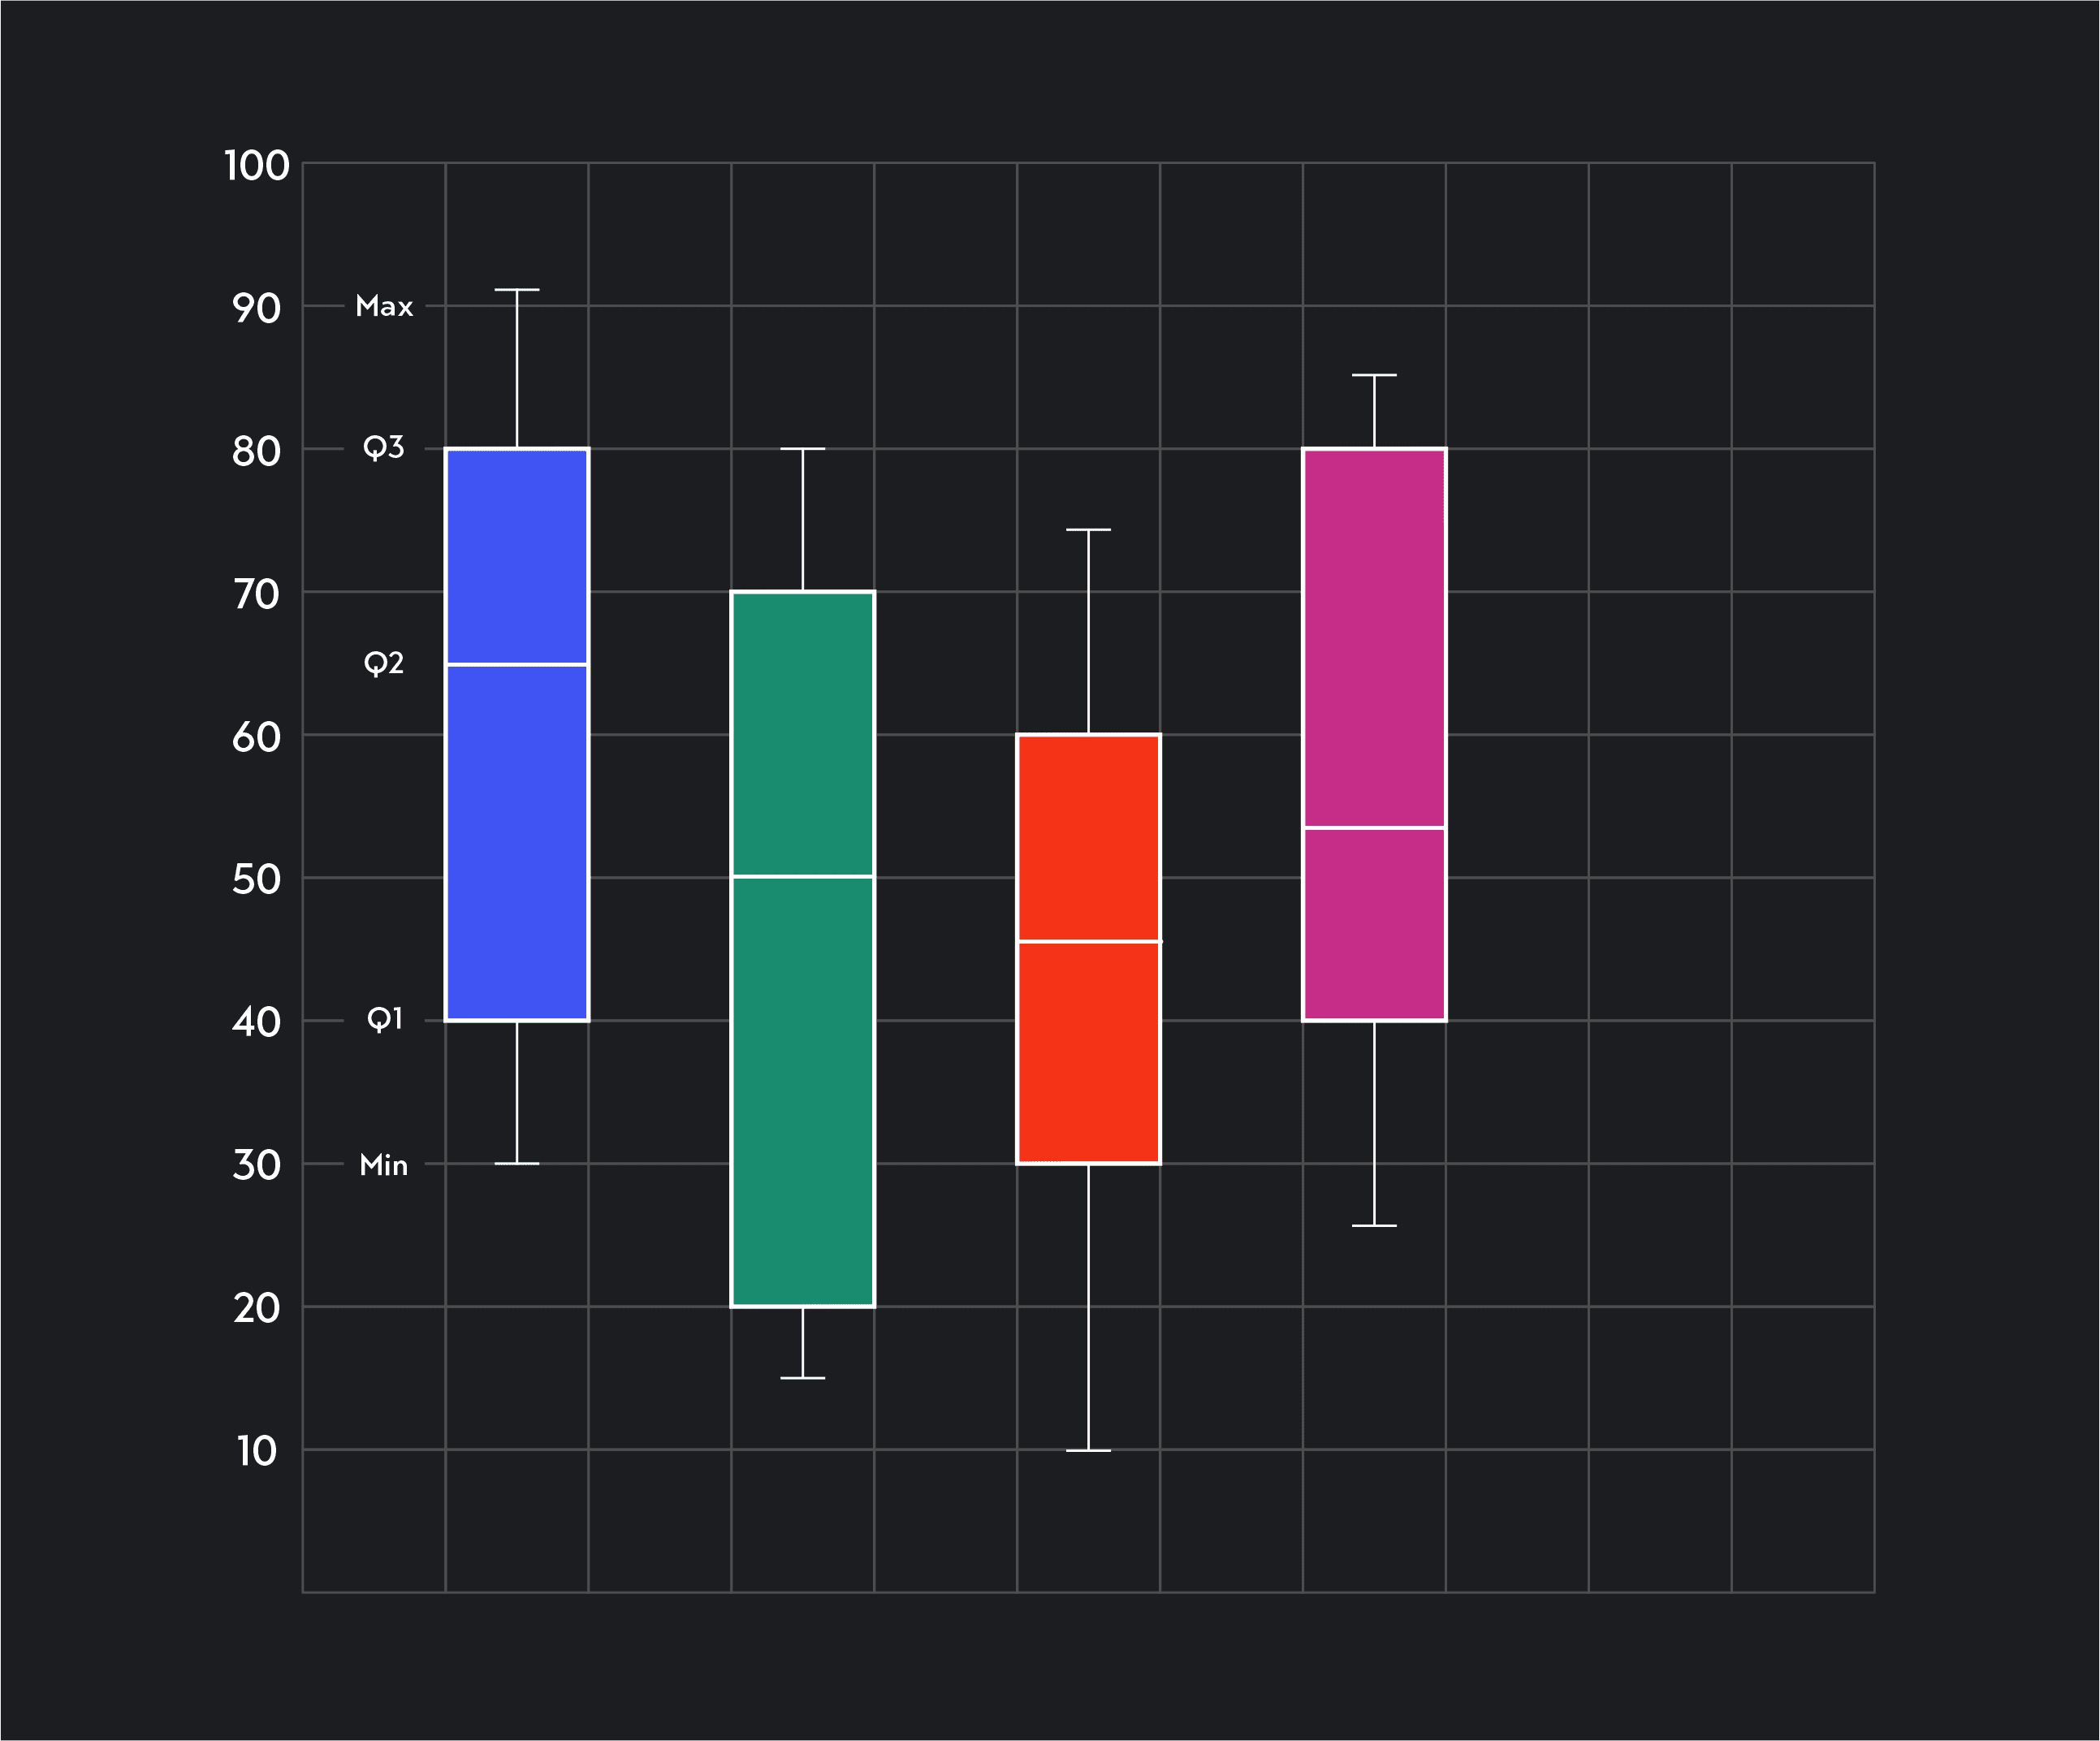
In a boxplot or a box and whisker plot, you can identify the interquartile range by looking at the two shorter ends of the rectangle. Subtract the larger value from the smaller value to find the interquartile range.
In the figure below, the IQR shown by the blue box and whisker plot is 80-40 = 40. The IQR for the pink box and whisker plot is 70-20 = 50.
In addition to simply calculating the interquartile range, you can use the IQR to identify outliers in your data.
The outlier formula—also known as the 1.5 IQR rule—designates any value greater than Q3 + (1.5 x IQR) and any value less than Q1 - (1.5 x IQR) as an outlier.

Outlier (from the co-founder of MasterClass) has brought together some of the world's best instructors, game designers, and filmmakers to create the future of online college.
Check out these related courses:


Statistics
Learn what quartiles are and how they work in statistics. Understand how to calculate them and why even learn them.
Subject Matter Expert

Statistics
Learn the different types of variables in statistics, how they are categorized, their main differences, as well as several examples.
Subject Matter Expert

Statistics
Learn what is standard error in statistics. This overview explains the definition, the process, the difference with standard deviation, and includes examples.
Subject Matter Expert