Measuring mean absolute deviation is an easy way to understand the degree of variation across statistical data points. In this article, we’ll define mean absolute deviation; discuss how it differs from its more common counterpart, standard deviation; and show how to calculate it in four quick steps.
From the co-founder of MasterClass, earn transferable college credits from the University of Pittsburgh (a top 50 global school). The world's best online college courses for 50% less than a traditional college.
What is MAD in math? In math and statistics, MAD stands for mean absolute deviation.
Mean absolute deviation (MAD) is a measure of the average absolute distance between each data value and the mean of a data set. Similar to standard deviation, MAD is a parameter or statistic that measures the spread, or variation, in your data.
Mean Absolute Deviation Definition - A measure of the average absolute distance between your data points and the mean of your data set.
To calculate MAD, we measure the absolute distance (or absolute deviation) between each data point and the mean. We then take the average of those distances. This average distance is what we call the mean absolute deviation.
The Mean Absolute Deviation formula is then:
MAD=n∑∣xi−xˉ∣
Σ is known as Sigma and means to sum up
| | are vertical bars that mean absolute value
xi is each value such as 4 and 9
x̄ is the mean
n is the total number of data points in your data set
Some Easy MAD Examples
Let’s look at two quick examples. Below are two sets of data. What is the mean absolute deviation in each case?
Data Set A
Data Set B
3, 3, 7 ,7
1, 2, 7, 10
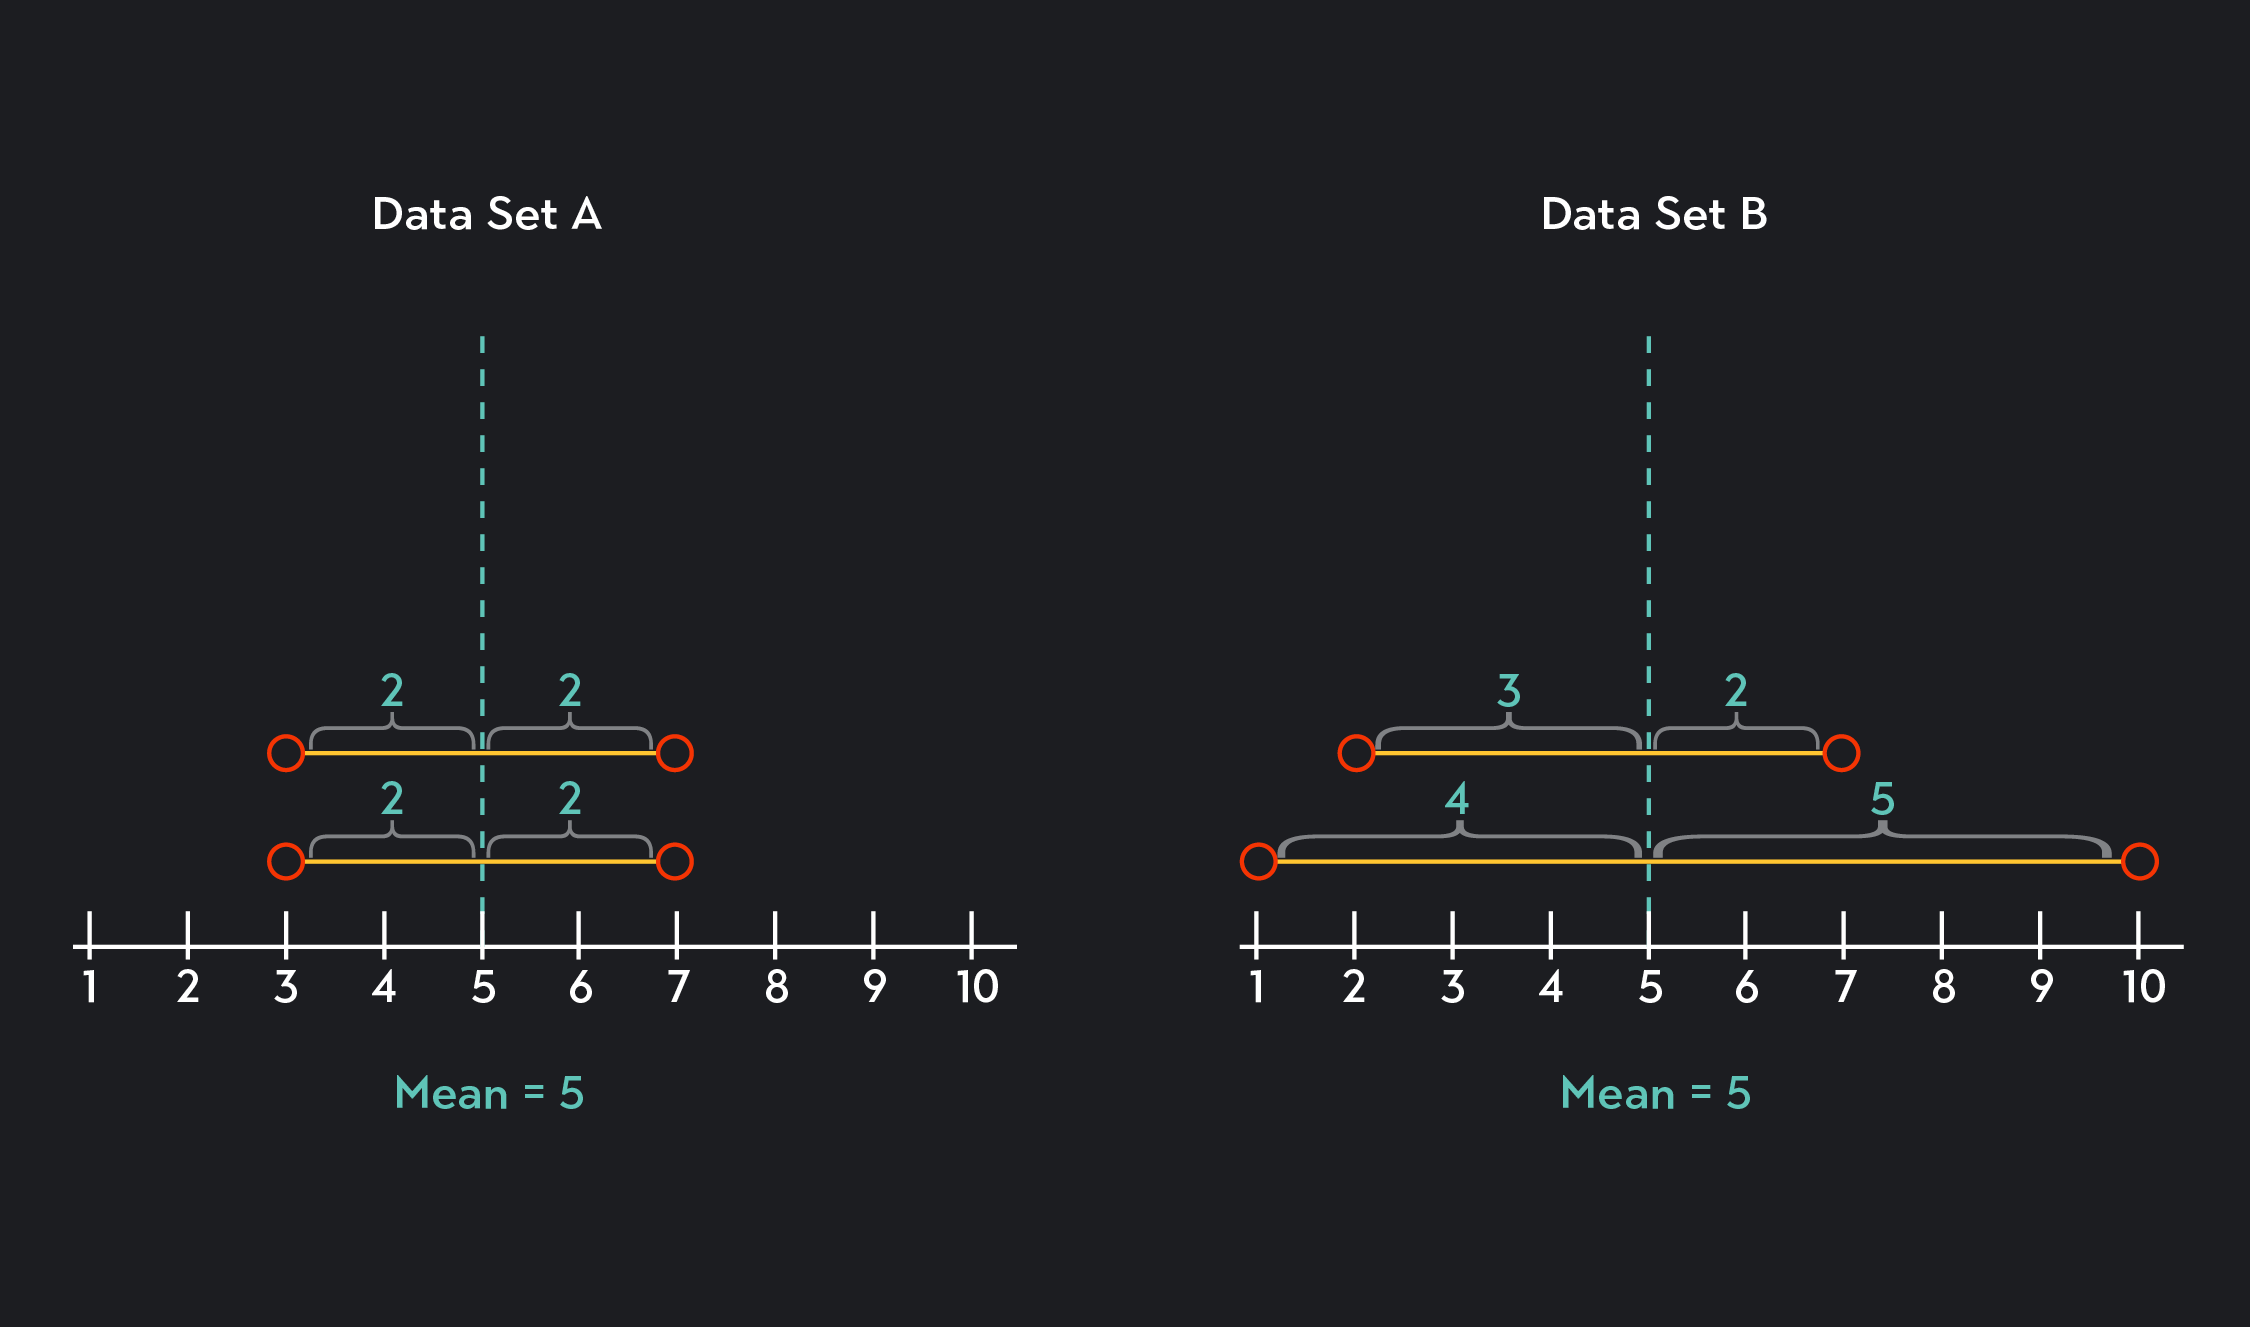
Before we calculate MAD, notice that the mean, or average, of both data sets is 5. In Data Set A, however, the data is more closely clustered around the mean. This tells us that MAD must be smaller for Data Set A than it is for Data Set B since the distances between the data values and the mean are smaller. We can see this more clearly by plotting our data onto dot plots.
Using these dot plots, we can visualize the deviations.
For Data Set A, we see that every single data point deviates from the mean by 2. Calculating MAD in this case is easy; the average of four twos is just two!
MADA=(2+2+2+2)/4=2
For Data Set B, we see that the data is more varied. The absolute deviations are 4, 3, 2, 5. The average of these absolute deviations is 3.5.
MADB=(4+3+2+5)/4=3.5
Concretely, what do these figures tell us? In the first instance, MAD tells us that, on average, the values in Data Set A deviate from the mean by 2.
In the second case, MAD tells us that, on average, the values in Data Set B deviate from the mean by 3.5.
Why Use MAD and Not Standard Deviation?
As we mentioned earlier, MAD and standard deviation are both measures of spread — they tell you how much variation there is in your data relative to the mean. So what then is the difference between MAD and standard deviation, and why would you want to use one of these measures over the other?
While MAD measures the average absolute deviation, standard deviation takes the square root of the average squared deviations.
MAD
Standard Deviation(s)
n∑∣xi−xˉ∣
n−1∑(xi−xˉ)2
At this point, you may be wondering why we bother taking absolute values or squares of the deviations. Good question! Whenever you measure deviations from a mean, you run into the problem of dealing with positive and negative values.
Some data points lie above the mean, while others lie below it, so if you measure the deviations as each data value minus the mean (∣xi−xˉ∣), you’ll end up with positive deviations for values that are greater than the mean and negative deviations for values that are less than the mean. The negative deviations partially or wholly cancel out the positive deviations, and this interferes with the goal of calculating the average deviation.
MAD and standard deviations deal with the problem of having positive and negative deviations in different ways. When you calculate MAD, you take the absolute value of the deviations, which turns all the deviations positive. When you calculate standard deviation, you square all the deviations, which turns the deviations positive but changes the units of the deviations into squared units. As an added step, when calculating standard deviation, you take the square root of the average square deviations to get the units back into their original form.
Although standard deviation seems like the clunkier of the two measurements, it’s actually the more common one. Because calculating standard deviation involves squared deviations, it’s more sensitive to values that are farther away from the mean. You can think of standard deviation as a weighted average that gives less weight to the values that lie close to the mean and more weight to the data points that lie farther away from the mean. For this reason, standard deviation tends to be larger than MAD.
Key Terms to Know
To understand mean absolute deviation, you also need to know the following terms:
Mean: The average of a data set. To find the mean, add up all the values in your data and divide by the total number of data points.
Absolute Value: Absolute value, denoted by two parallel lines | |, is the non-negative value of a real number, x. If x is positive, the absolute value is positive. If x is negative, the absolute value is positive. For example, |5| = 5 and |-3.4| = 3.4. If you have an operation within the absolute value, complete the operation before taking the absolute value. So... |3-5|=|-2|=2. The absolute value essentially removes negative signs from whatever lies within the symbol!
Deviation: The word deviation shows a departure from a standard or a norm. When we calculate deviations in statistics, we’re typically finding the distance between a given value and some norm, such as the mean. As an example, say the average temperature of sodas in a vending machine is 38 degrees Fahrenheit. You buy a soda from the vending machine and it is 39.5 degrees. The deviation between the temperature of your soda and the average temperature of sodas in the vending machine is 1.5 degrees!
Summation: Summation is the process of adding elements together. Taking an average, or mean, involves a summation: you add up all of the elements in the data before dividing by the total number of elements in the data set. In math and statistics, summation is symbolized by the capital Greek letter sigma 𝝨.
4 Steps on How to Find MAD
Assume you have the following data.
-2, 1, 5, 8
To calculate mean absolute deviation without the use of a dot plot, follow these easy steps. Recall that the MAD formula is:
MAD=n∑∣xi−xˉ∣
1. Calculate the mean of the data, xˉ
4−2+1+5+8=3
2. Find the absolute deviation between each data point and the mean,∣xi−xˉ∣
∣−2−3∣=5
∣1−3∣=2
∣5−3∣=2
∣8−3∣=5
3. Take the summation of the distances you found in Step 2, ∑∣xi−xˉ∣
5+2+2+5=14
4. Take the average deviation by dividing the sum found in Step 3 by the total number of data points, n. n∑∣xi−xˉ∣
Outlier (from the co-founder of MasterClass) has brought together some of the world's best instructors, game designers, and filmmakers to create the future of online college.