In this article, we’ll learn the definition of concavity. Using graphs, we’ll compare concave up vs. concave down curves. Then, we’ll discuss how to find points of inflection and identify intervals of concave up and concave down, using examples.
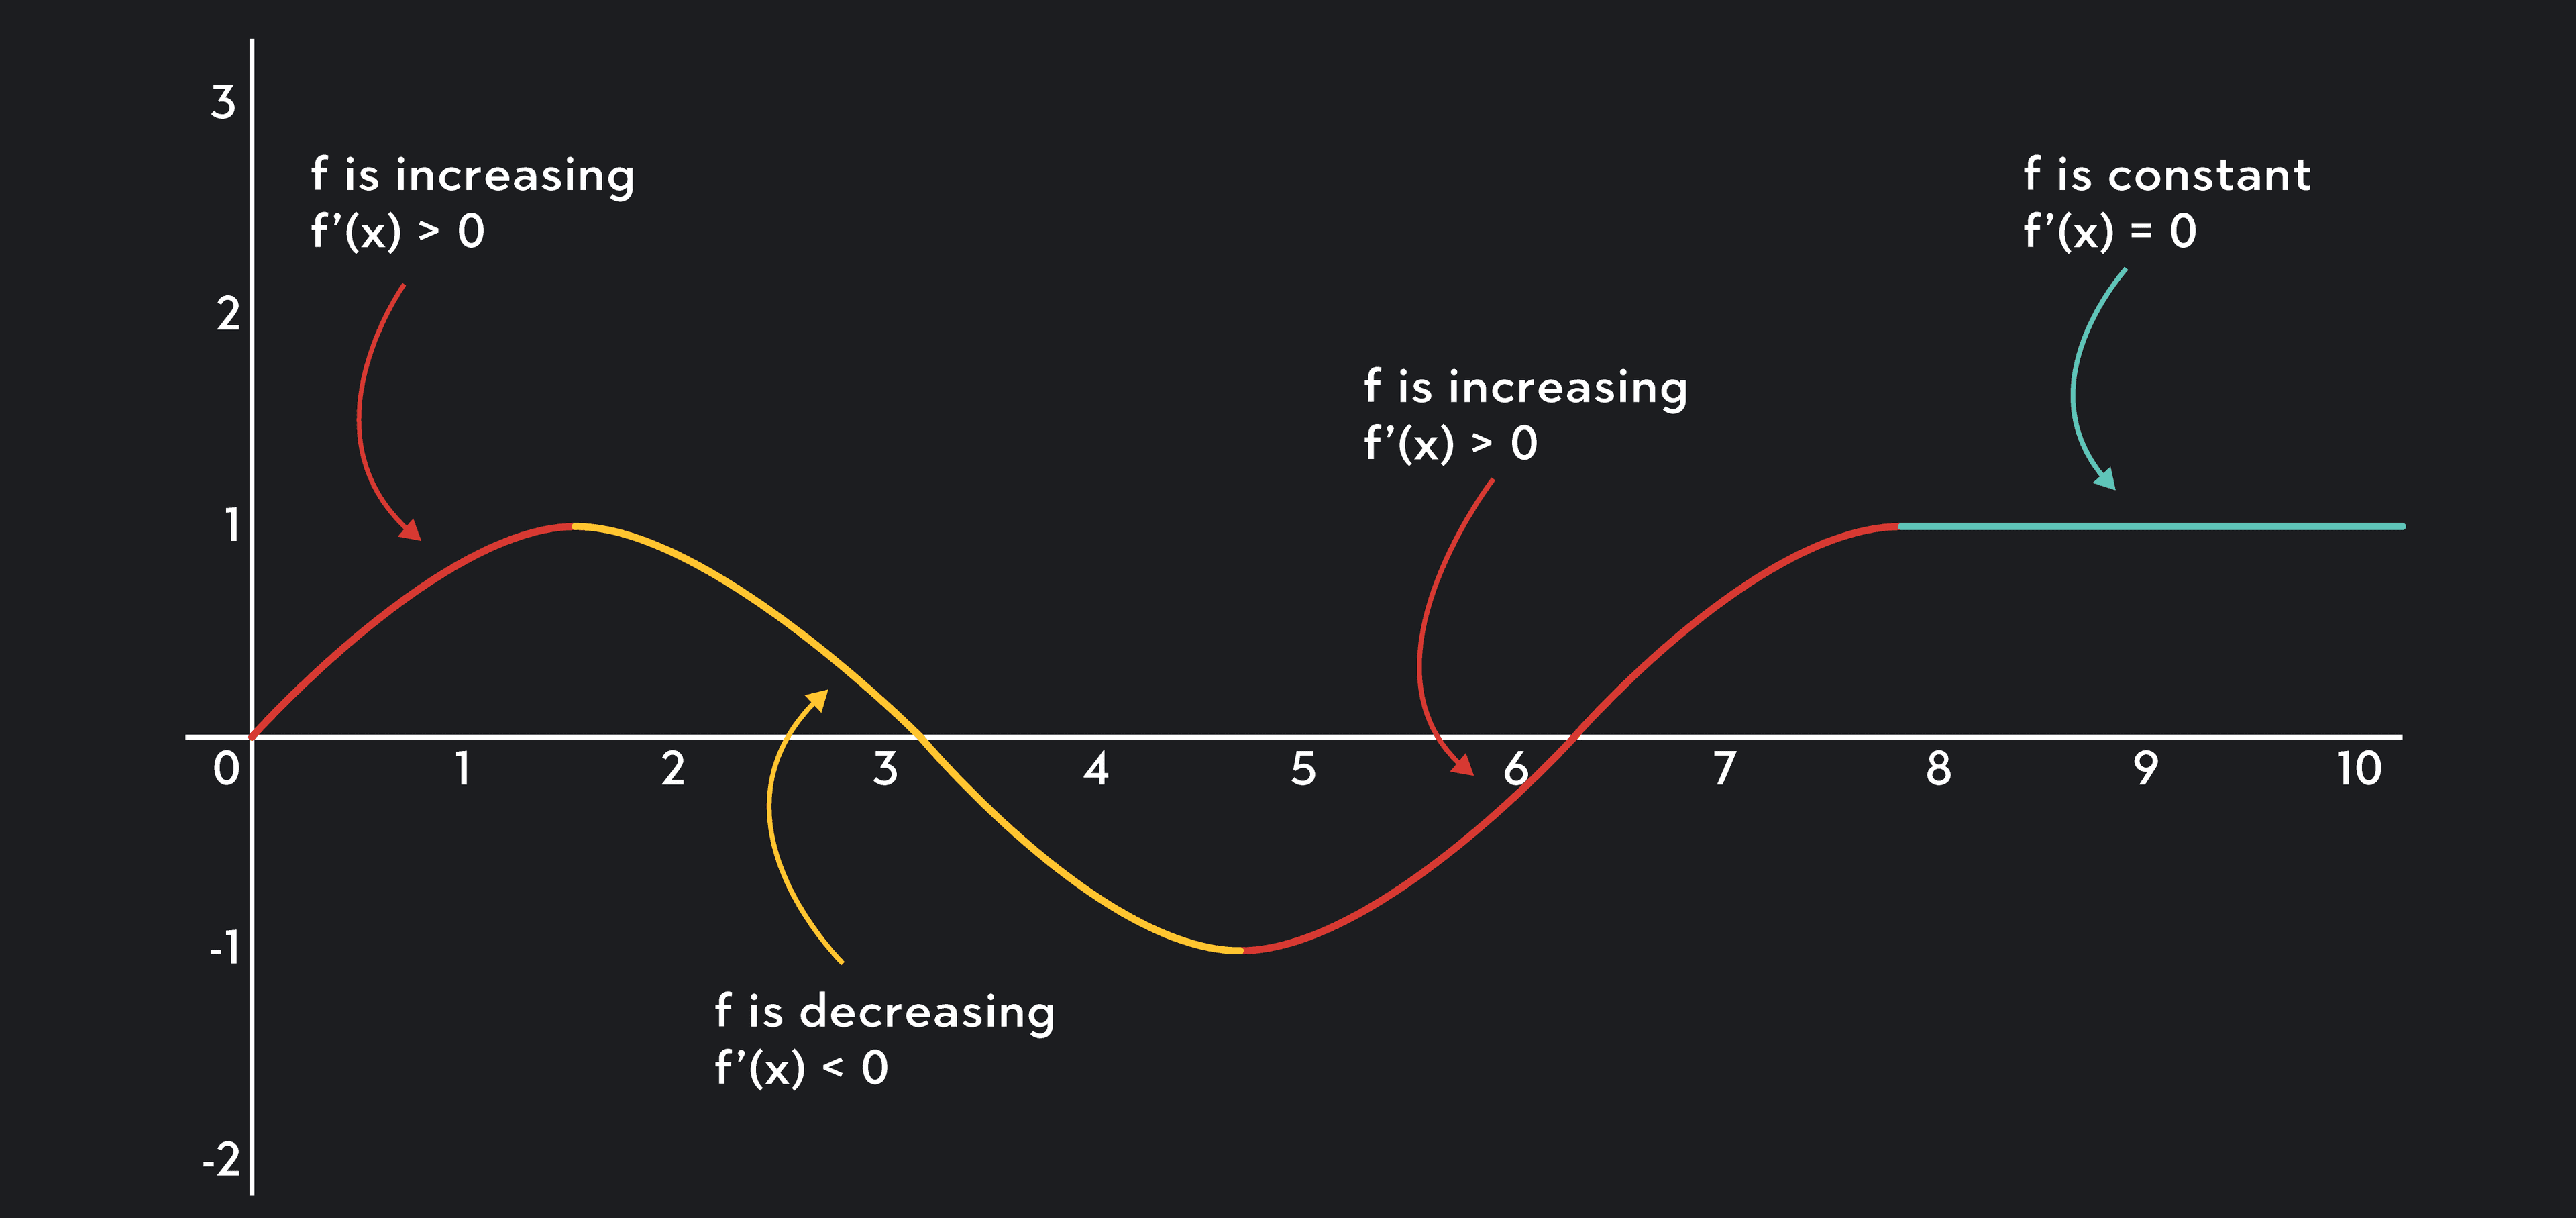
First derivatives tell us very useful information about the behavior of a function. First derivatives are used to determine if a function is increasing, decreasing or constant on an interval. You are probably already familiar with how to test if f(x) is increasing, decreasing, or constant. Suppose a function f is differentiable on the interval I. Then:
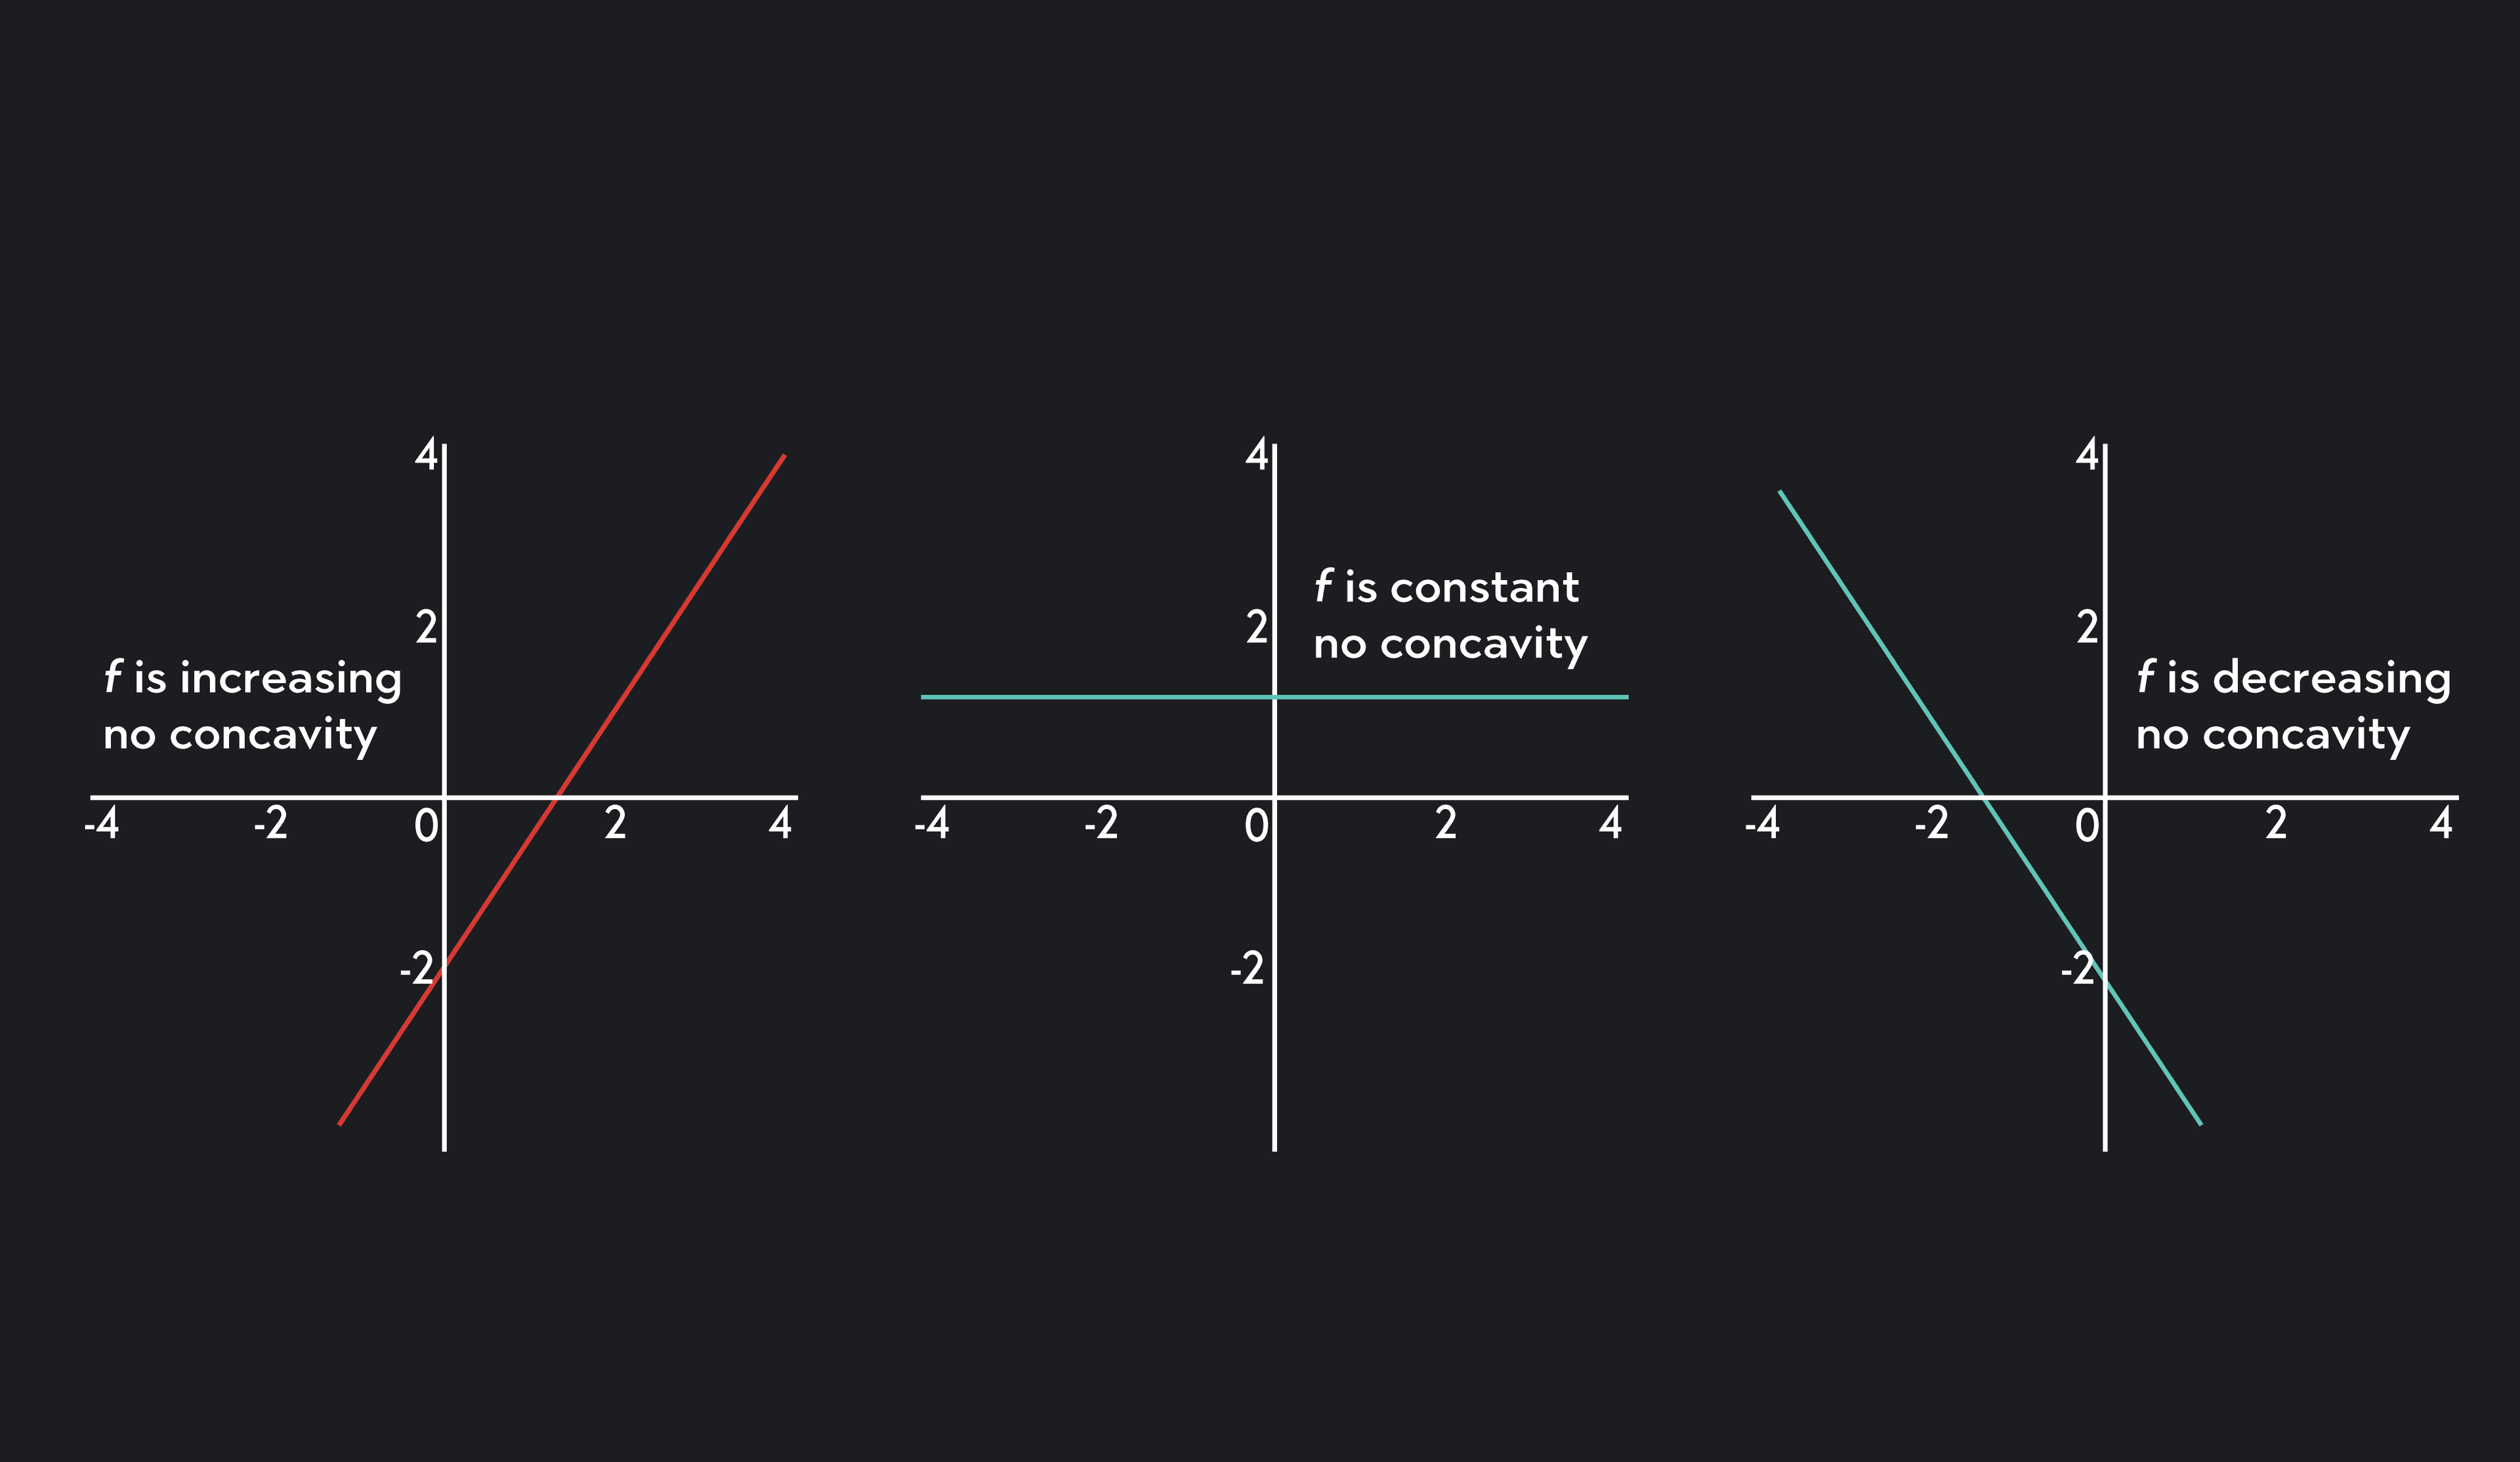
If f’(x)>0 for each x on I, then f is increasing on I.
If f’(x) < 0 for each x on I, then f is decreasing on I.
If f’(x)=0 for each x on I, then f is constant on I.
We can apply a very similar way of thinking to second derivatives. Like first derivatives, second derivatives also tell us useful information about the behavior of a function. You can find a second derivative—usually denoted by f’’—by taking the derivative of the first derivative.
The first derivative f’ can tell us when f is increasing or decreasing, while the second derivative f’’ can tell us the shape of the graph f. More specifically, f’’ tells us the concavity of a graph: whether the graph of f is concave up or concave downward.
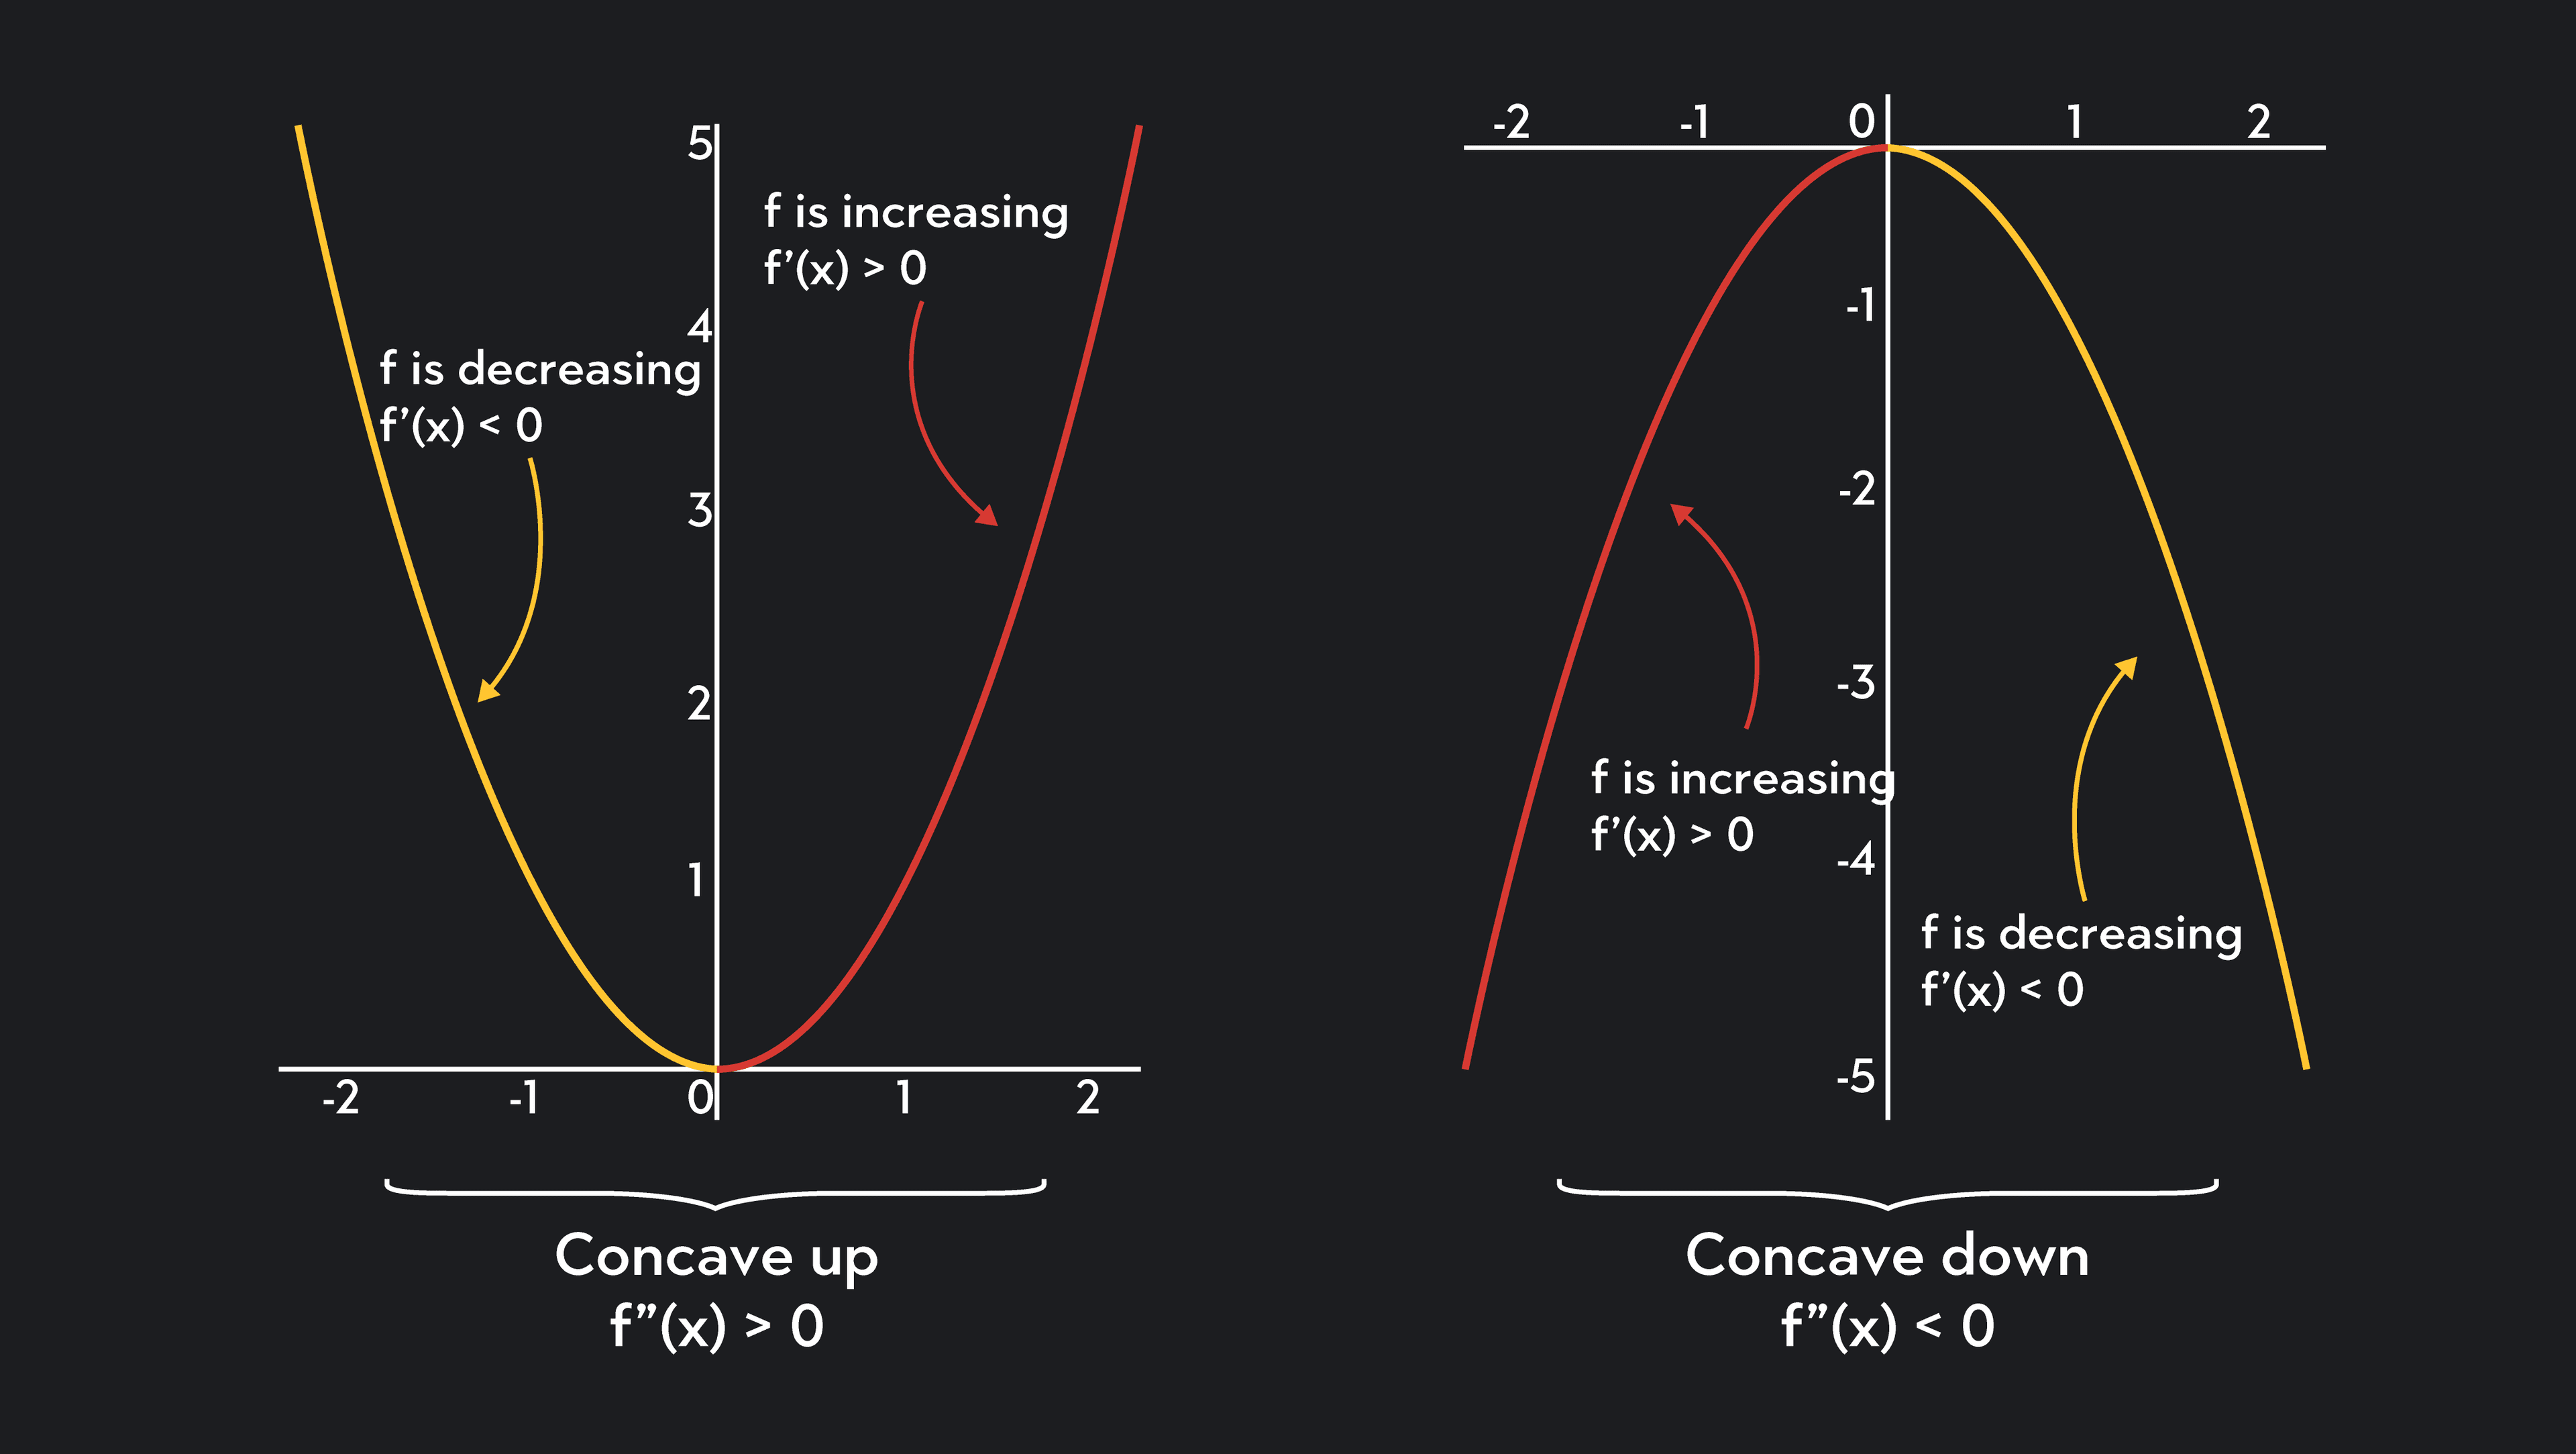
Concave up intervals look like valleys on a graph, while concave down intervals look like mountains. It might be helpful to visualize that concave up intervals could hold water, while concave down intervals could not hold water. Concave downward curves are also referred to as “concave curves” and concave up curves are also referred to as “convex curves.”
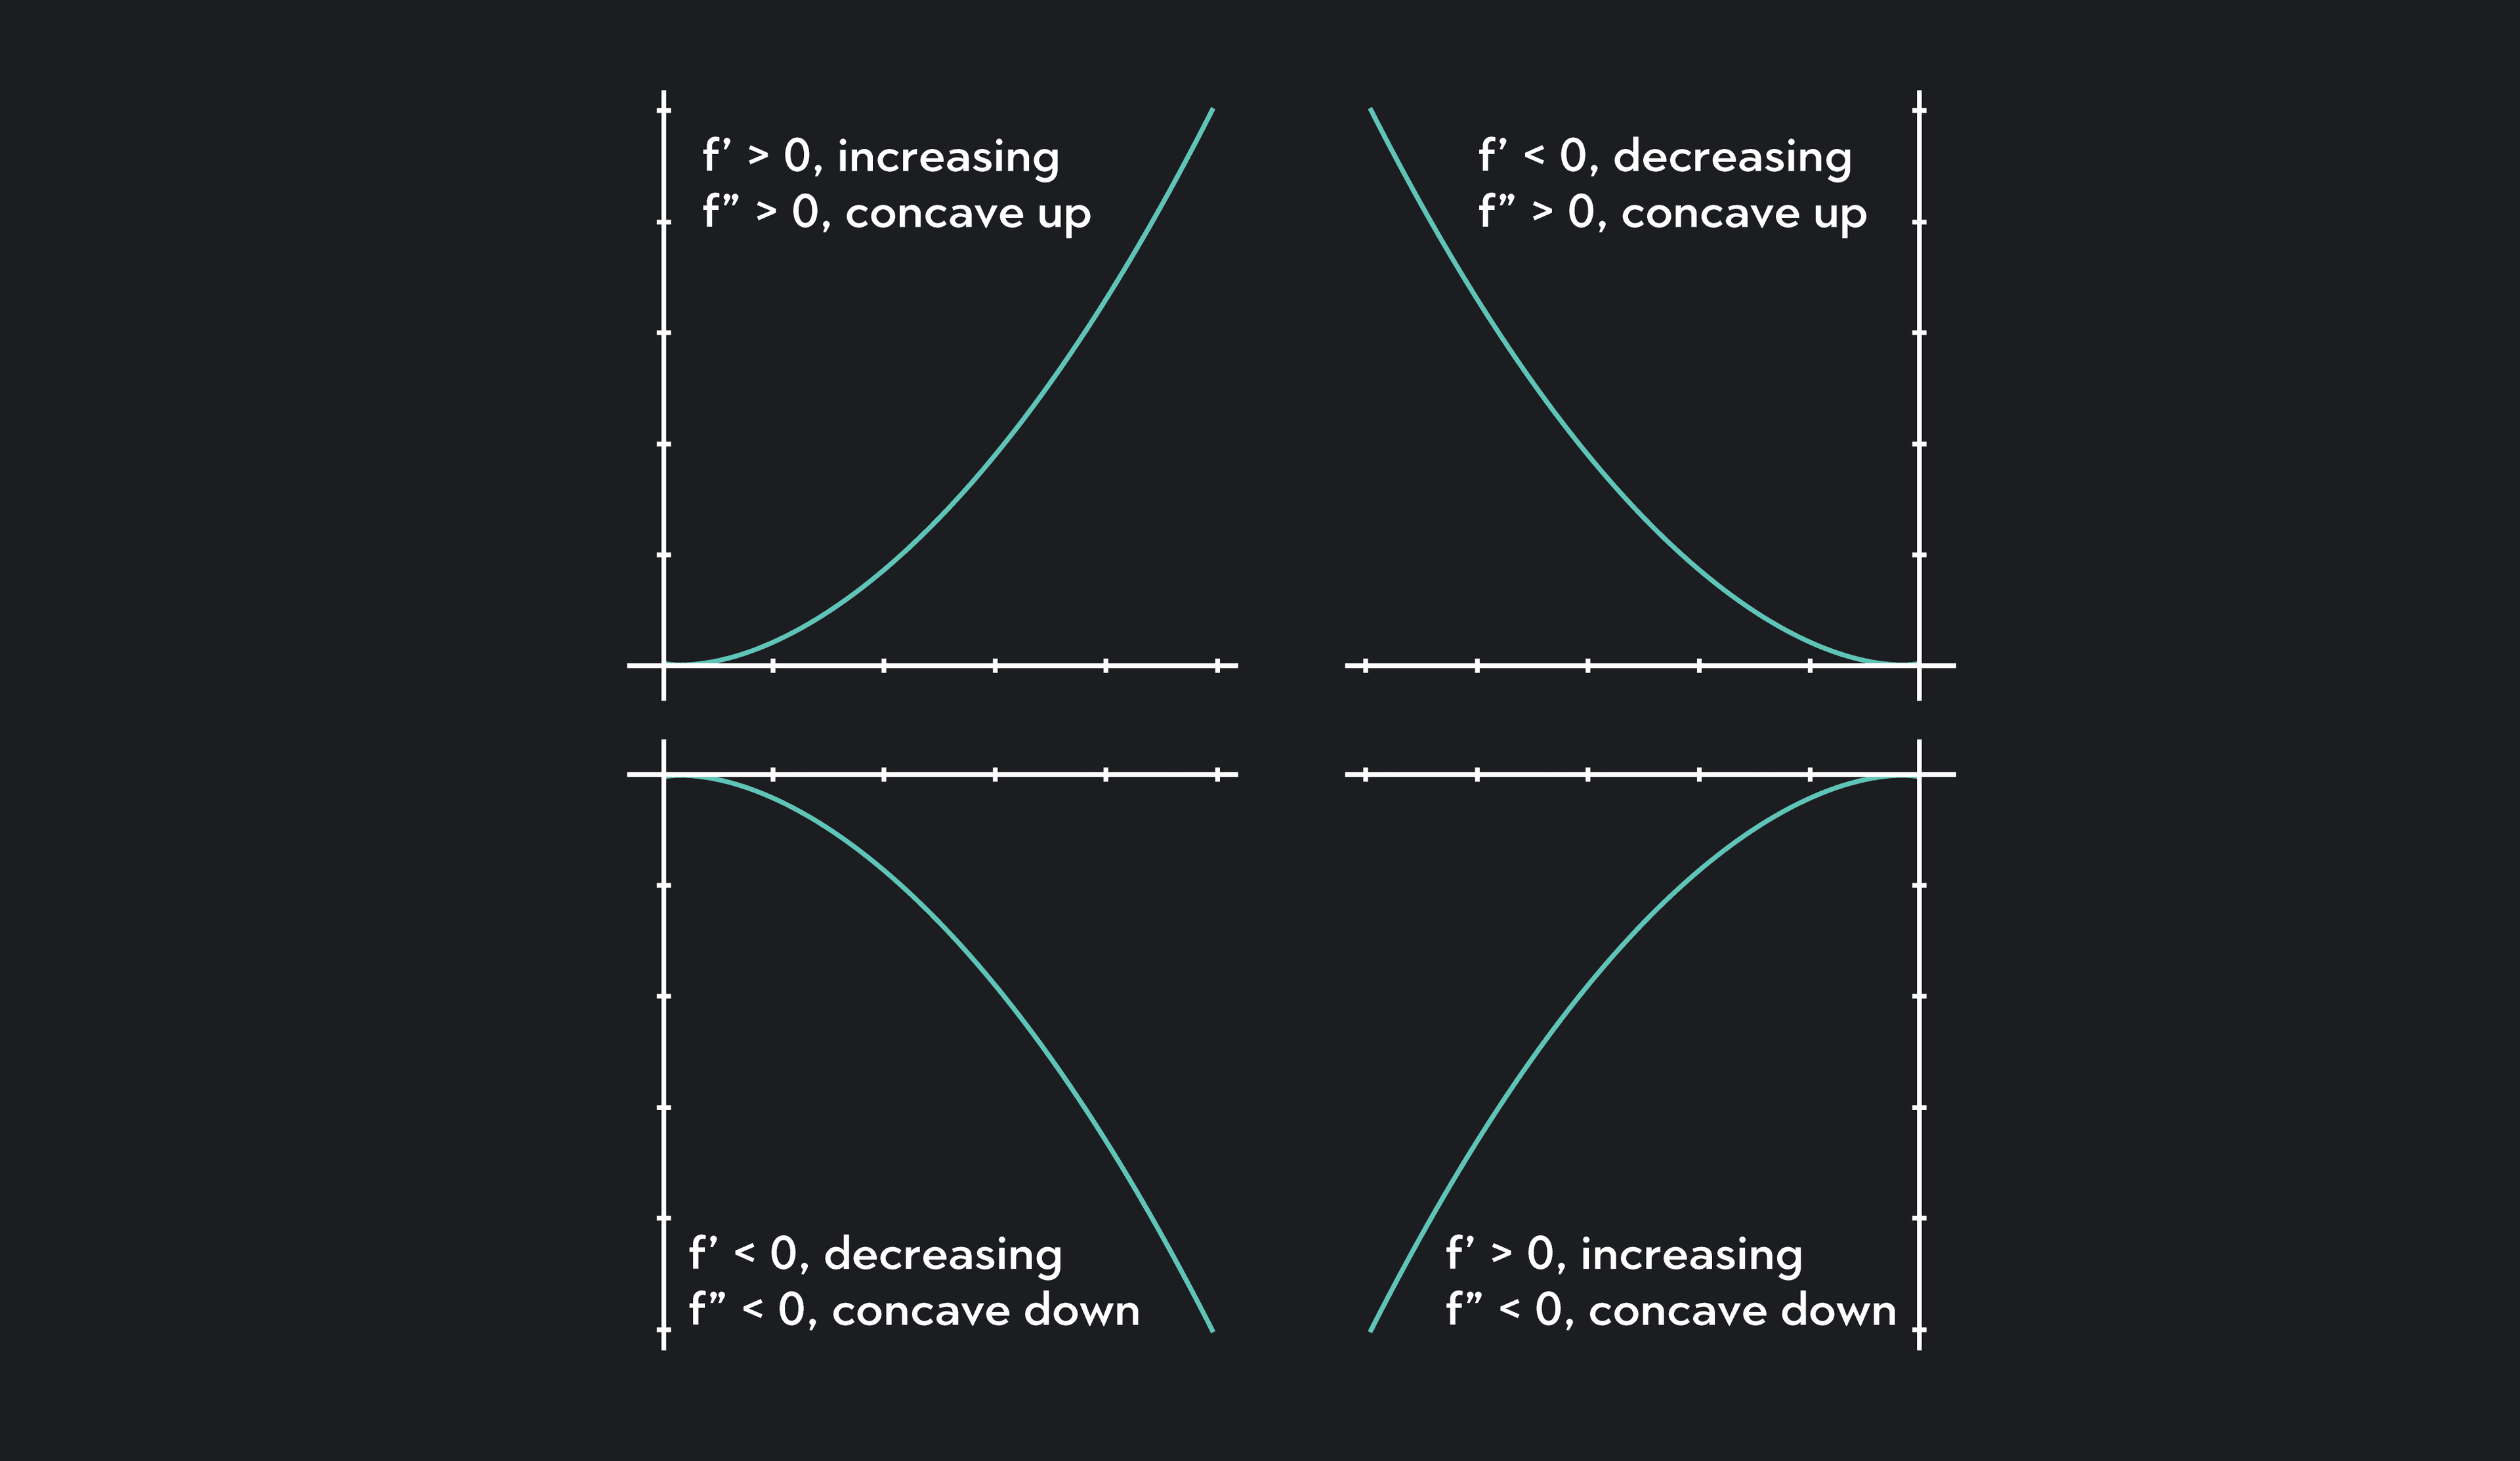
Study the graphs below to visualize examples of concave up vs concave down intervals.
It’s important to keep in mind that concavity is separate from the notion of increasing/decreasing/constant intervals. A concave up interval can contain both increasing and/or decreasing intervals. A concave downward interval can contain both increasing and/or decreasing intervals.
Remember that the first derivative f’ gives us the rate of change of the function f, which allows us to determine when f is increasing, decreasing, or constant. Similarly, the second derivative f’’ gives us the rate of change of the first derivative f’, which allows us to determine when f’ is increasing, decreasing, or constant.
So, if f is a differentiable function on the interval I with derivatives f’ and f’’, the concave up and concave down definition is:
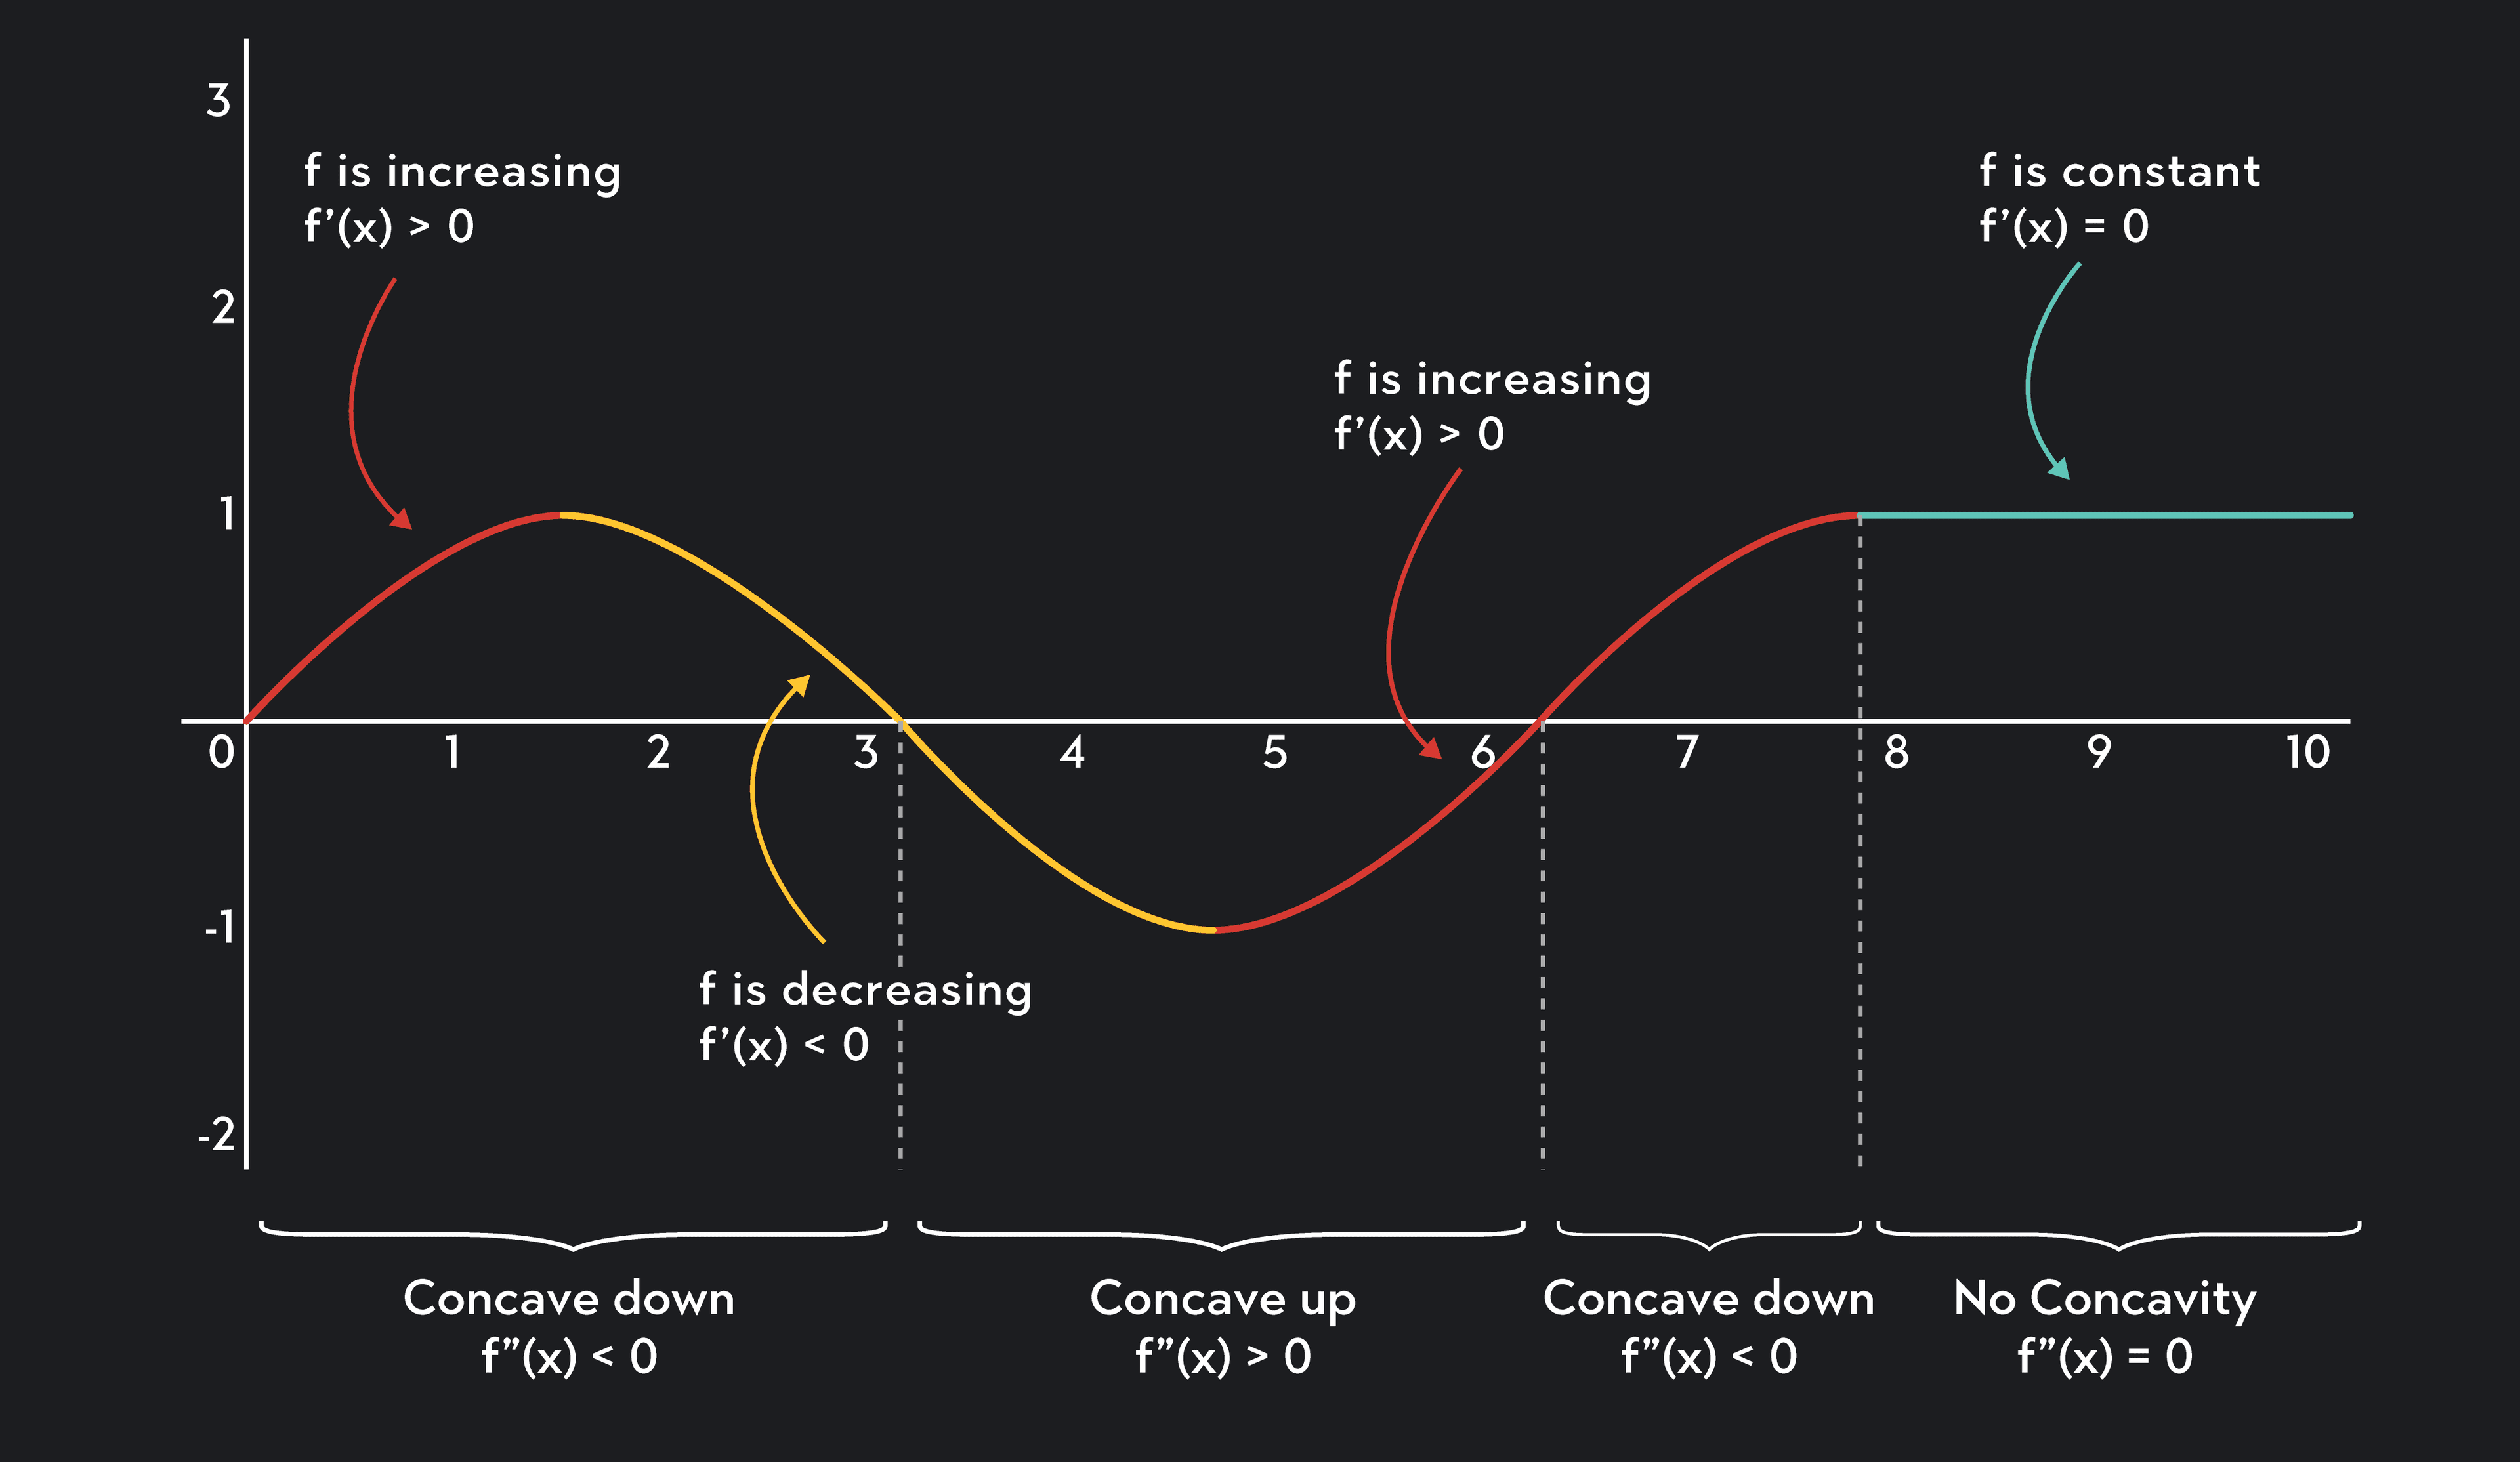
If f’’(x)>0 for each x on I, then f’ is increasing on I, and f is concave up on I.
If f’’(x) < 0 for each x on I, then f’ is decreasing on I, and f is concave down on I.
If f’’(x)=0 for each x on I, then f’ is constant on I, and f has no concavity.
We can separate the above statements into two ways to test for the concavity of a function on an interval I:
If f’ is increasing on I, then f is concave up on I.
If f’ is decreasing on I, then f is concave down on I.
If f’ is constant on I, then f has no concavity.
Or:
If f’’(x)>0 for each x on I, then f is concave up on I.
If f’’(x) < 0 for each x on I, then f is concave down on I.
If f’’(x)=0 for each x on I, then f has no concavity.
So, when the second derivative is positive, the graph is concave up. When the second derivative is negative, the graph is concave down. When the second derivative is zero, the graph has no concavity.
If a graph has no concavity on I, that means that the graph of f is linear over the interval I.
Dr. Hanna Fry dives more into a function’s concavity in this lesson clip, as well as a first derivative test, some terminology, and a second derivative test.
What Is a Point of Inflection?
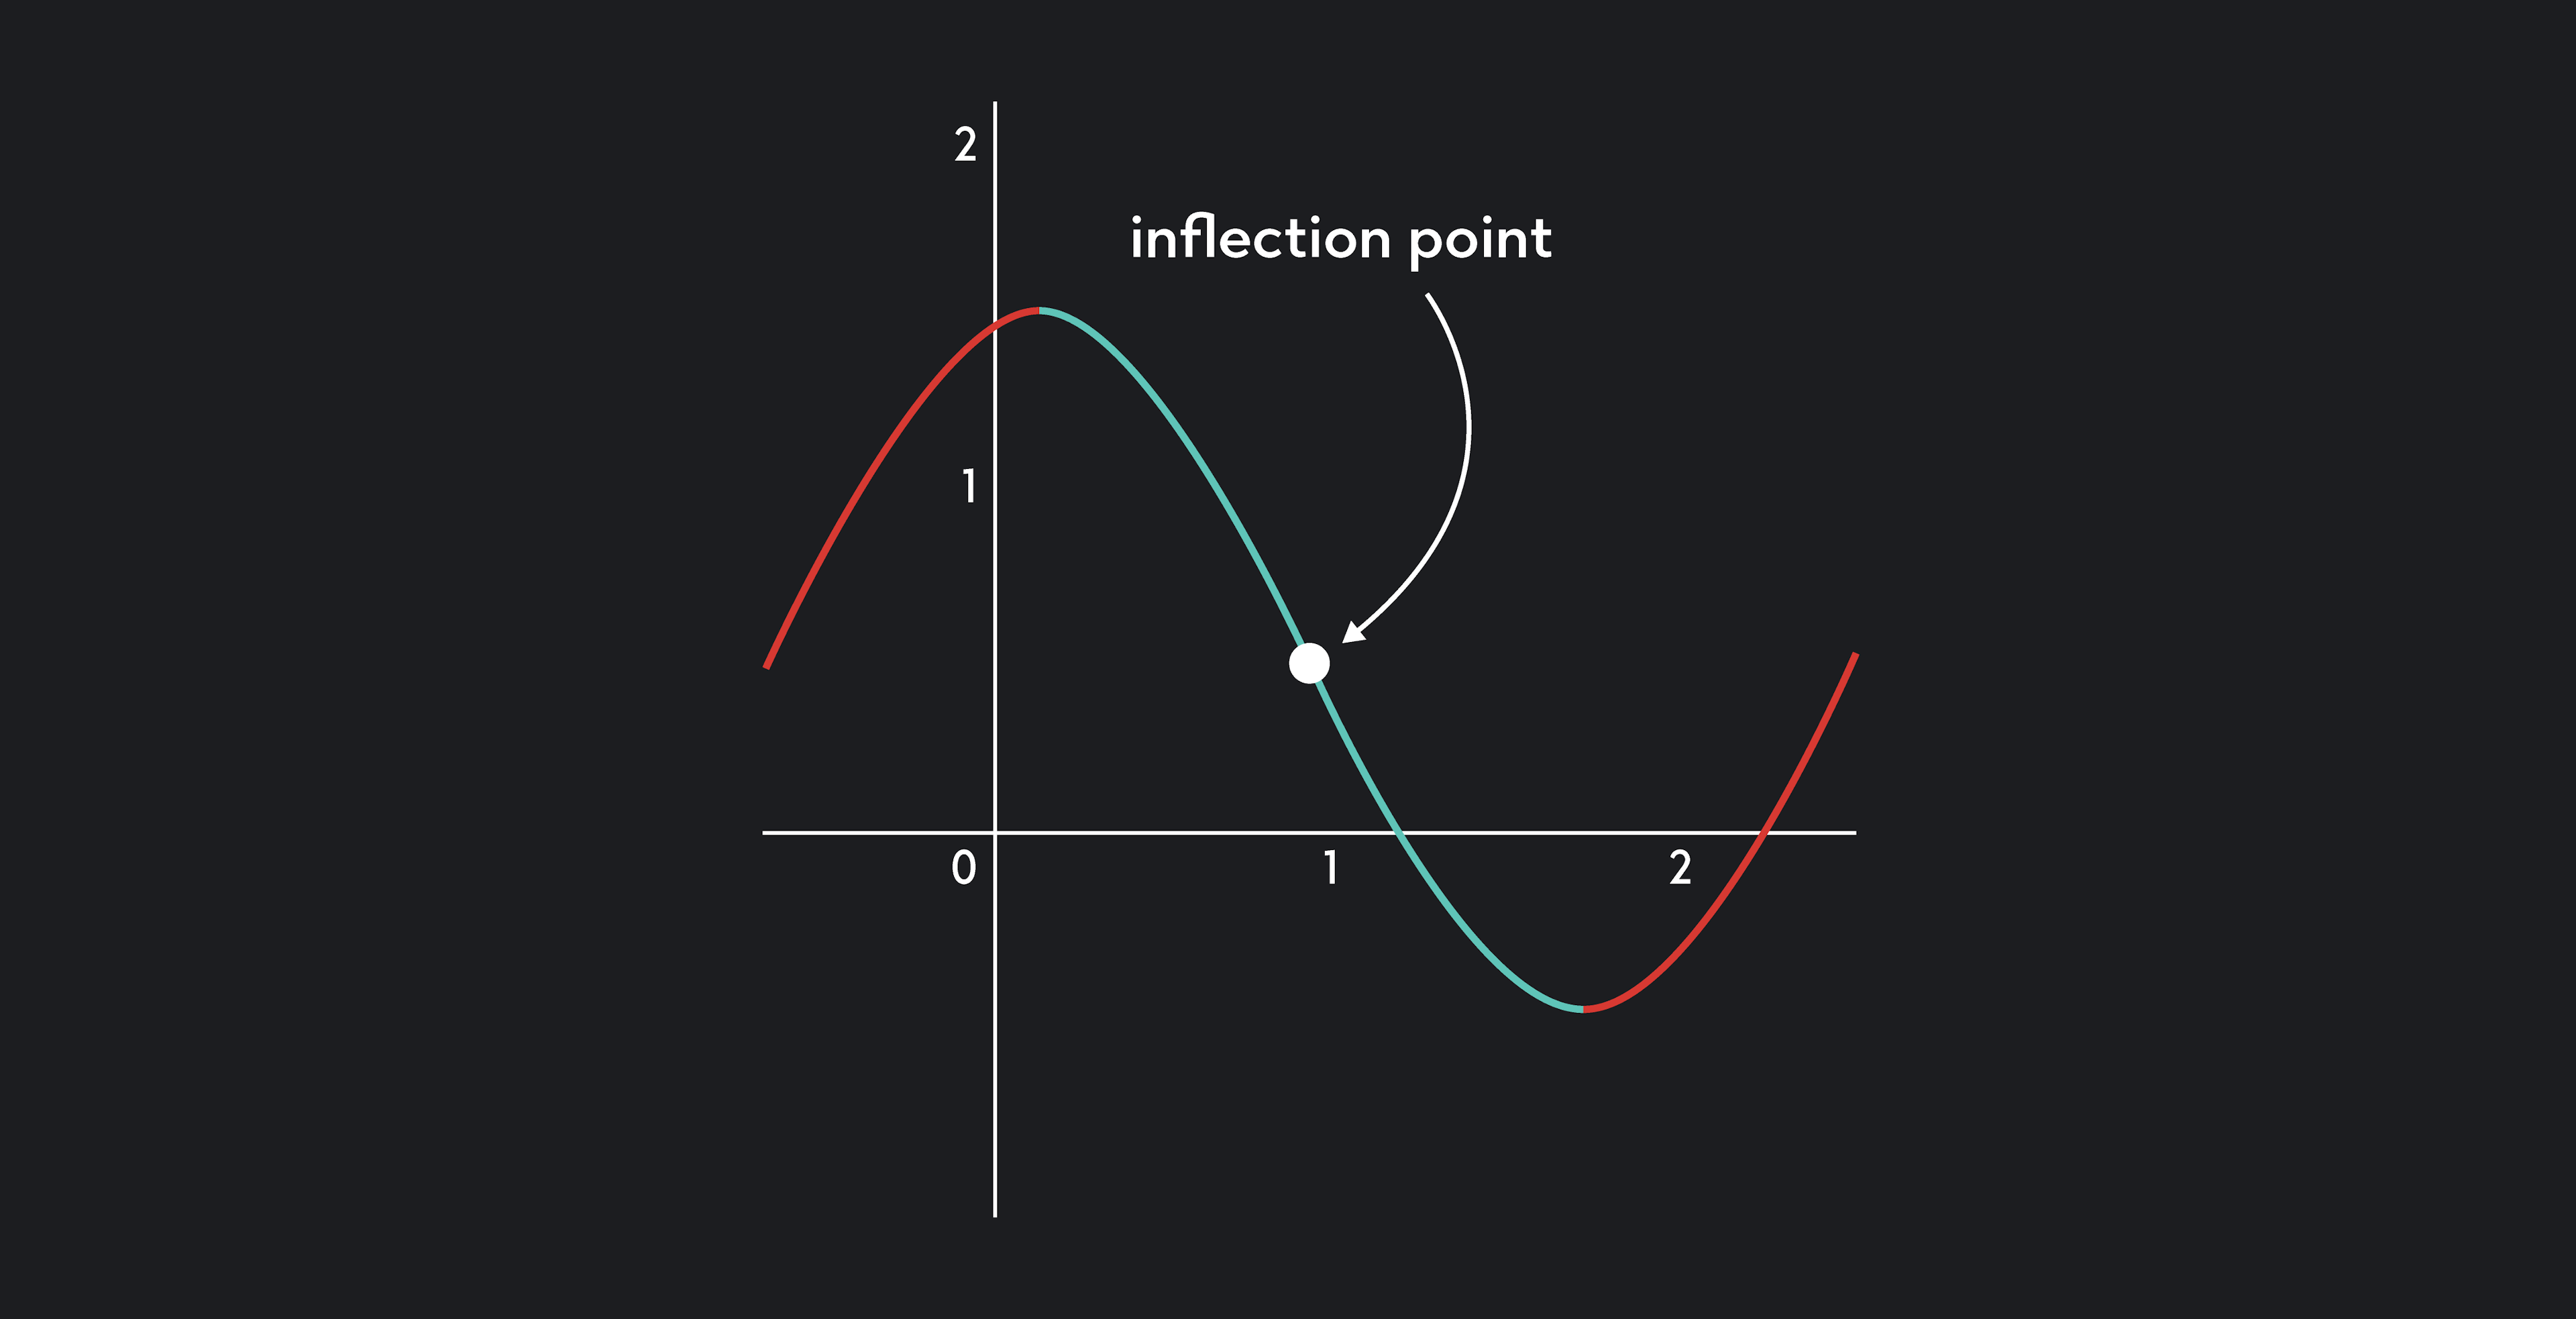
Inflection points are points where f changes concavity. These points occur where f’’(x) changes sign. If x is an inflection point of f, then f’’(x)=0 or f’’(x) is undefined.
To find all inflection points, you need to consider all points where f’’(x)=0 or where f’’(x) is undefined. These are possible inflection points, but not guaranteed inflection points.
To verify that a point x is an inflection point, you must check that the values of f’’(x) to the left and right of x have opposite signs.
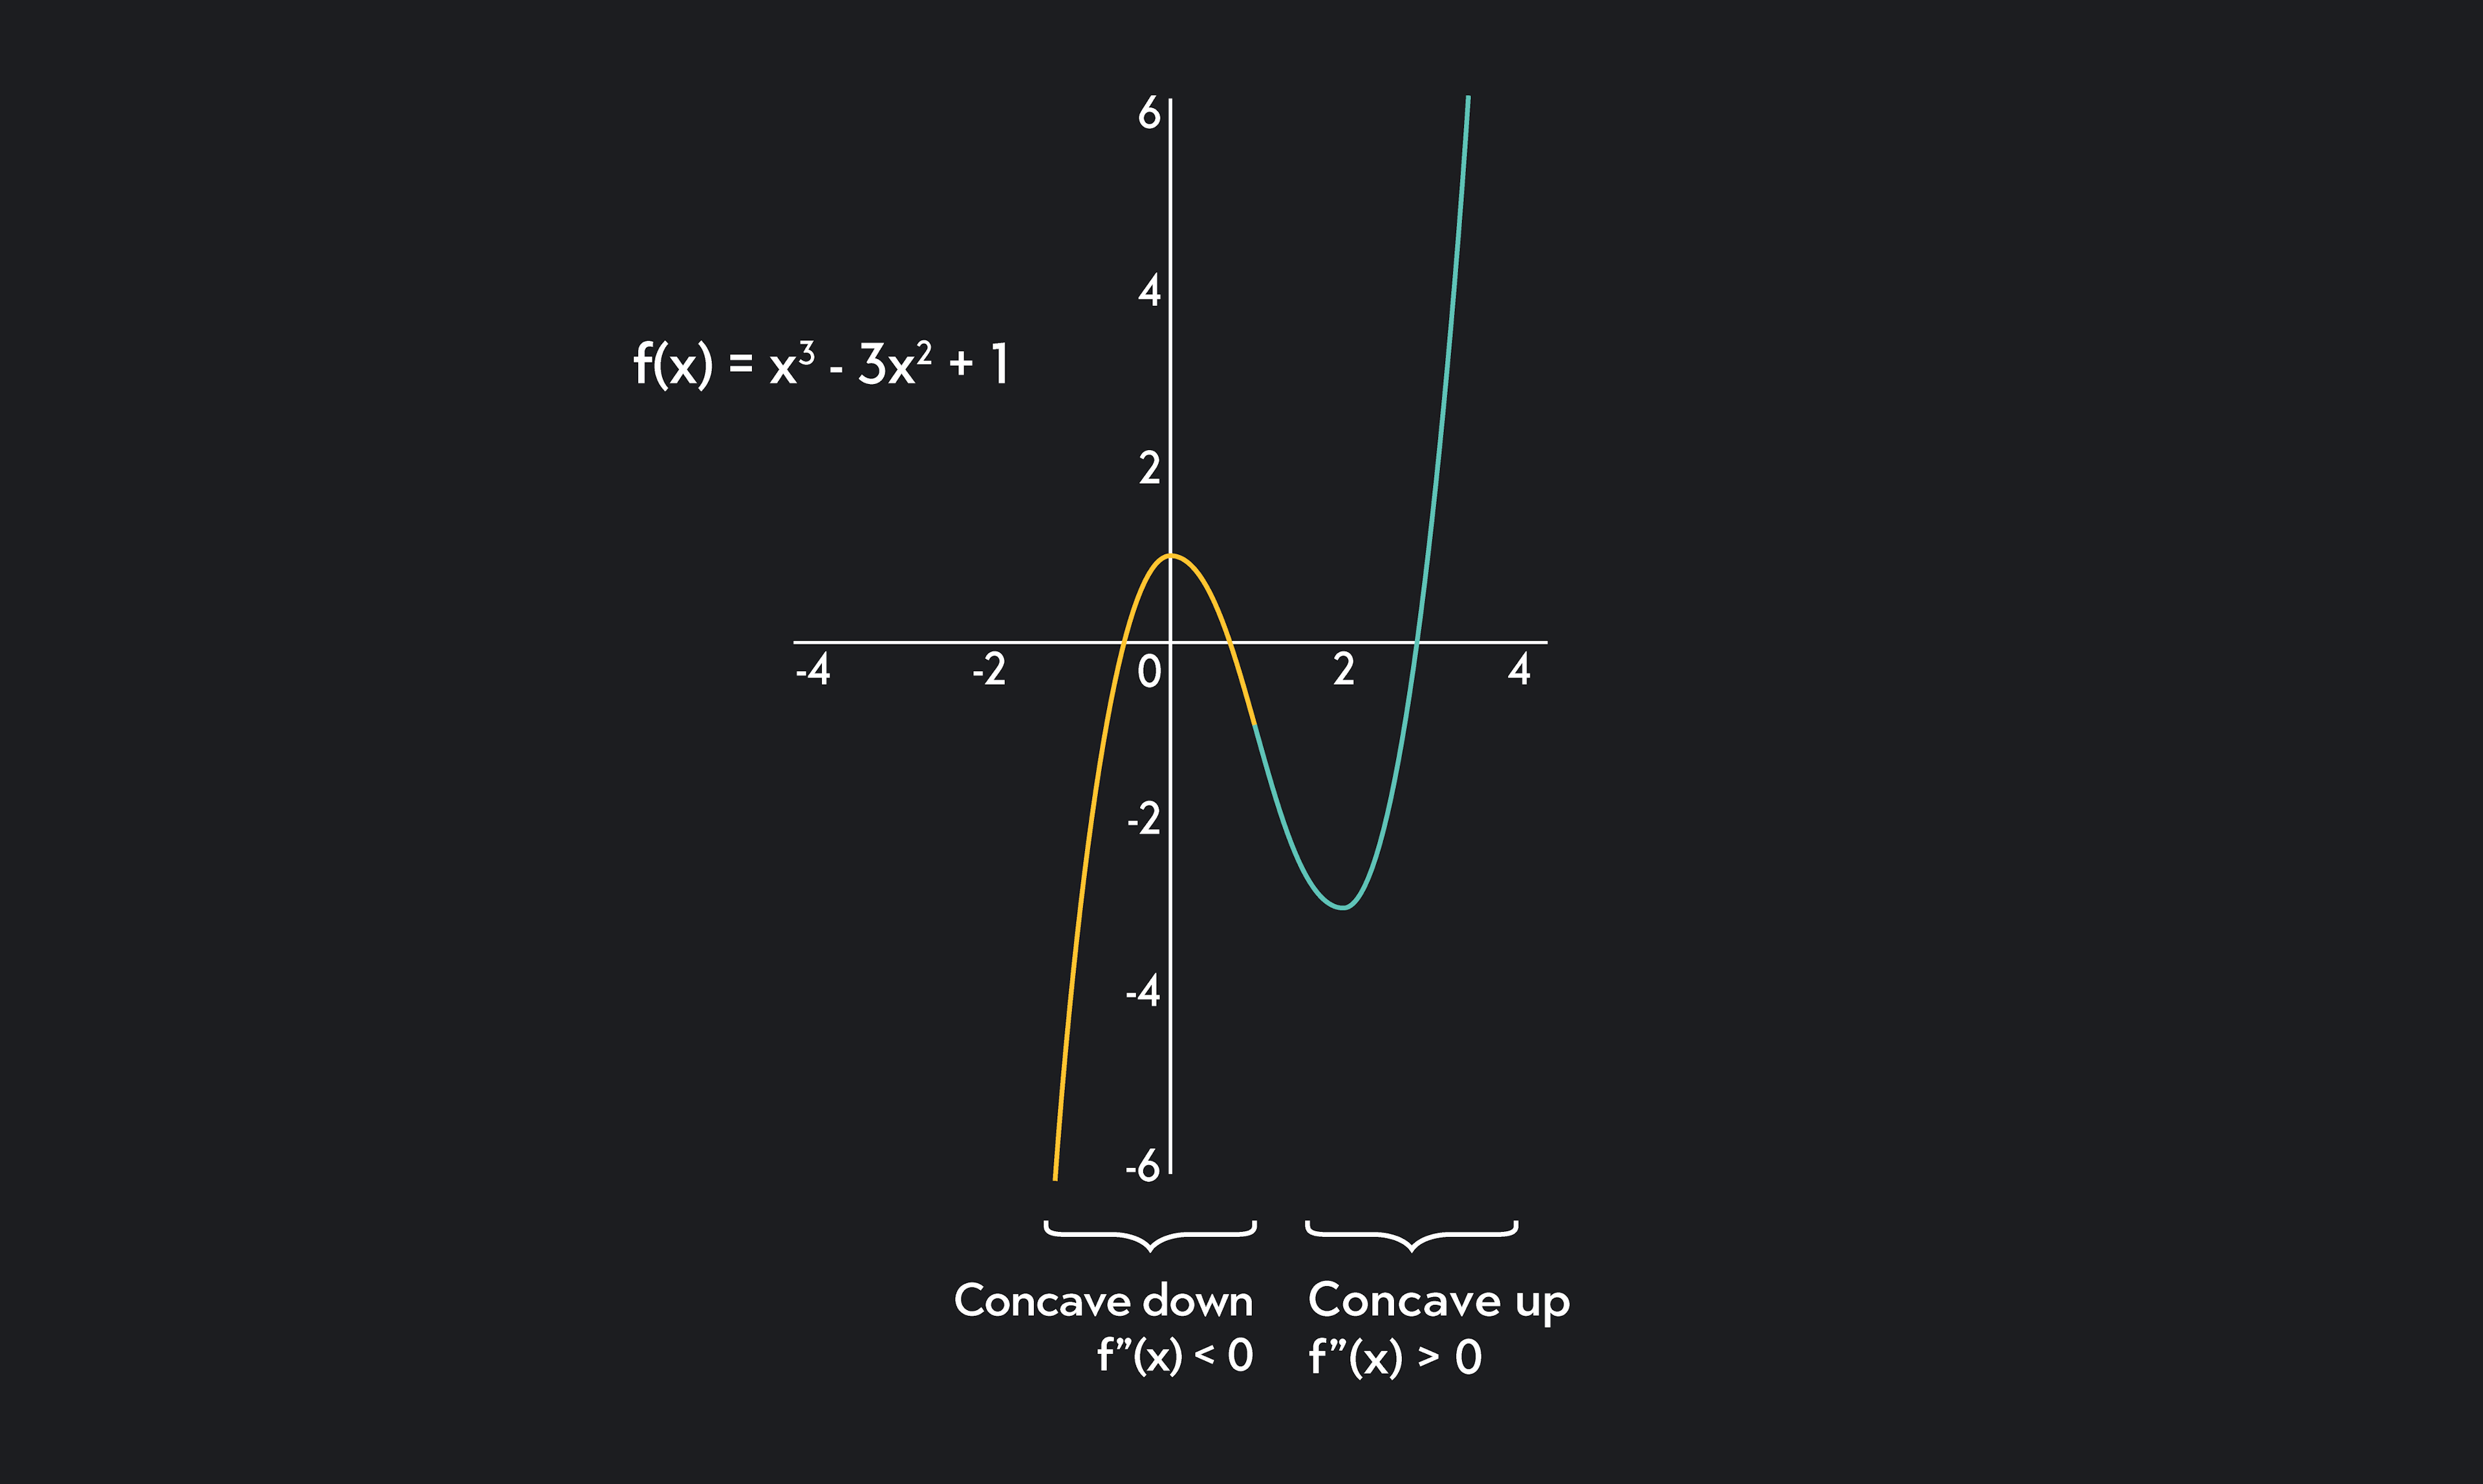
For example, suppose we are given the function f(x)=x3−3x2+1, and suppose we are asked to check if x=1 is an inflection point. First, we must calculate the first and second derivatives. Using the power rule, we find that f’(x)=3x2−6x and f’’(x)=6x−6.
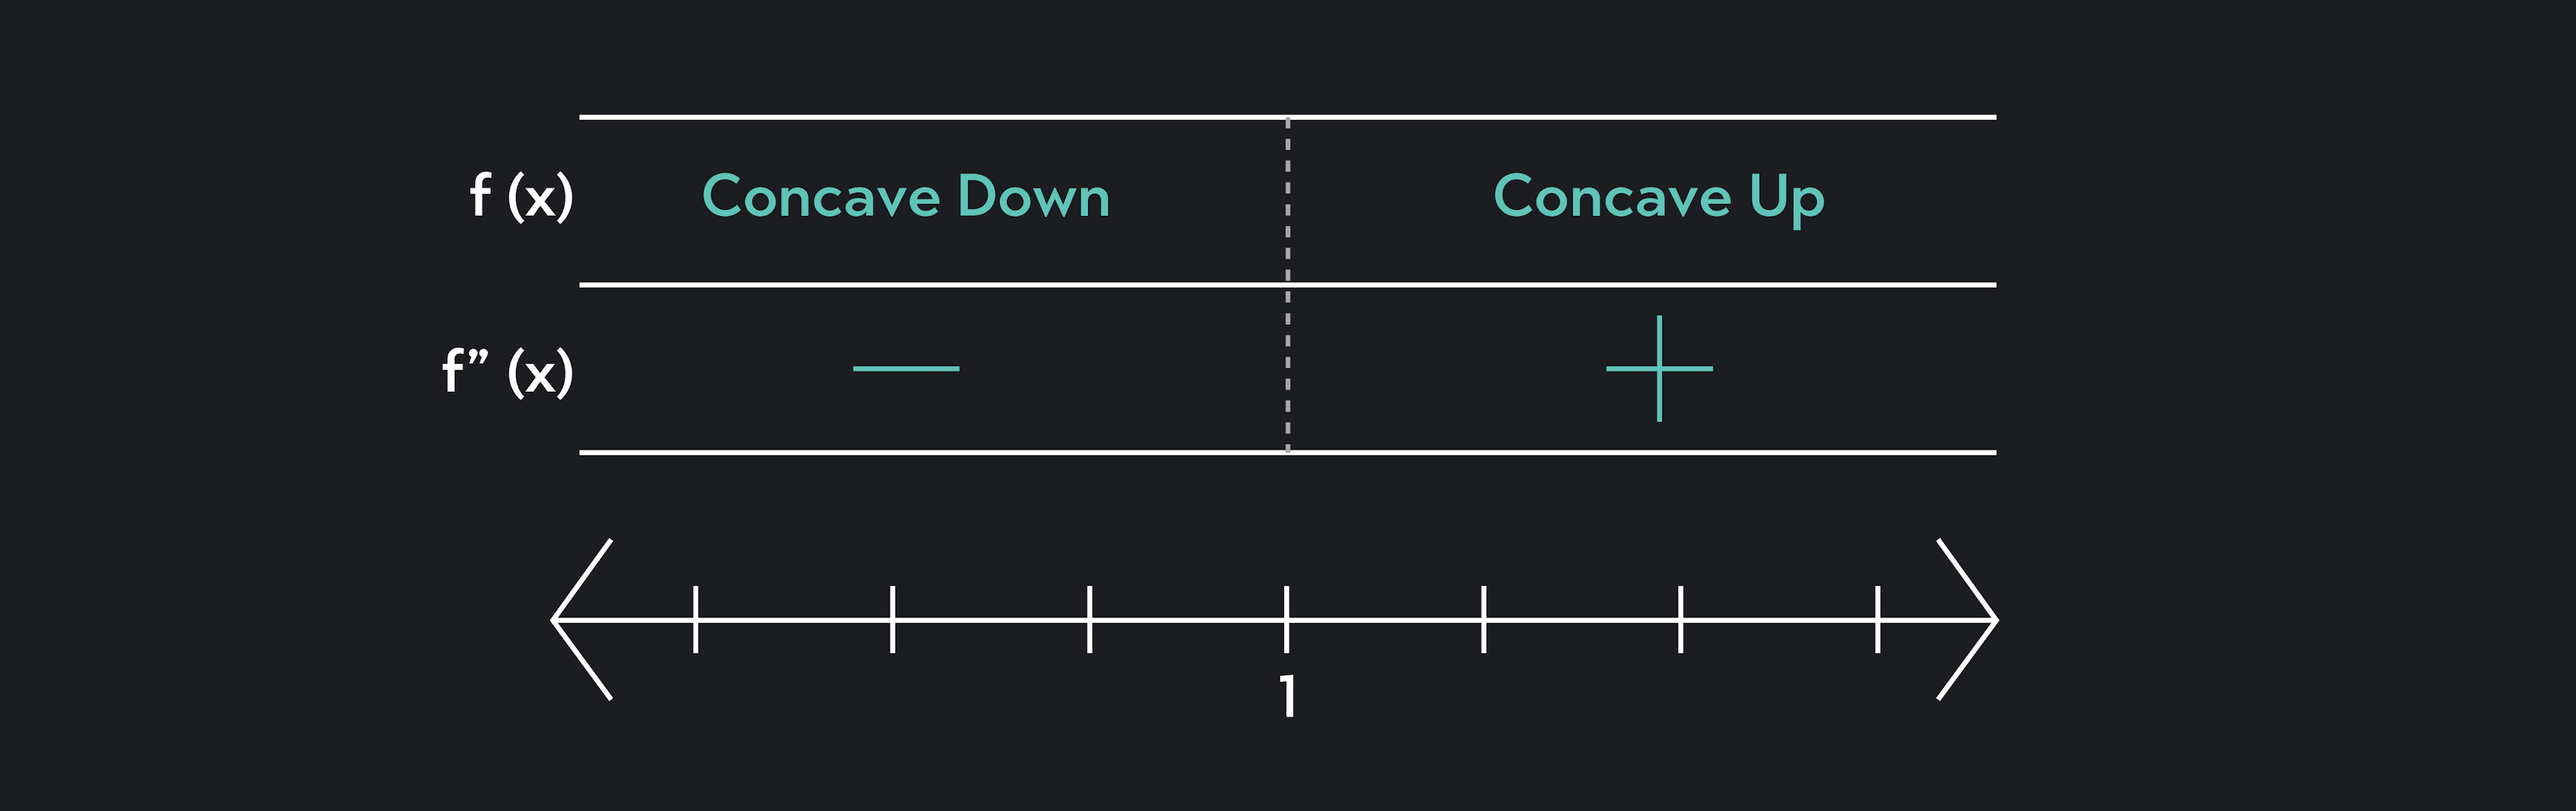
Plugging x=1 into f’’(x)=6x−6, we get f’’(1)=6−6=0. So, x=1 is a possible inflection point. Now, we need to check that the values of f’’(x) to the left and right of x=1 have opposite signs.
Let’s choose one point to the left of x=1, say x=0. Plugging x=0 into f’’(x)=6x−6, we find that f’’(0)=0−6=−6. So, the values to the left of x=1 are negative.
Let’s choose one point to the right of x=1, say x=2. Plugging x=2 into f’’(x)=6x−6, we find that f’’(2)=12−6=6. So, the values to the right of x=1 are positive.
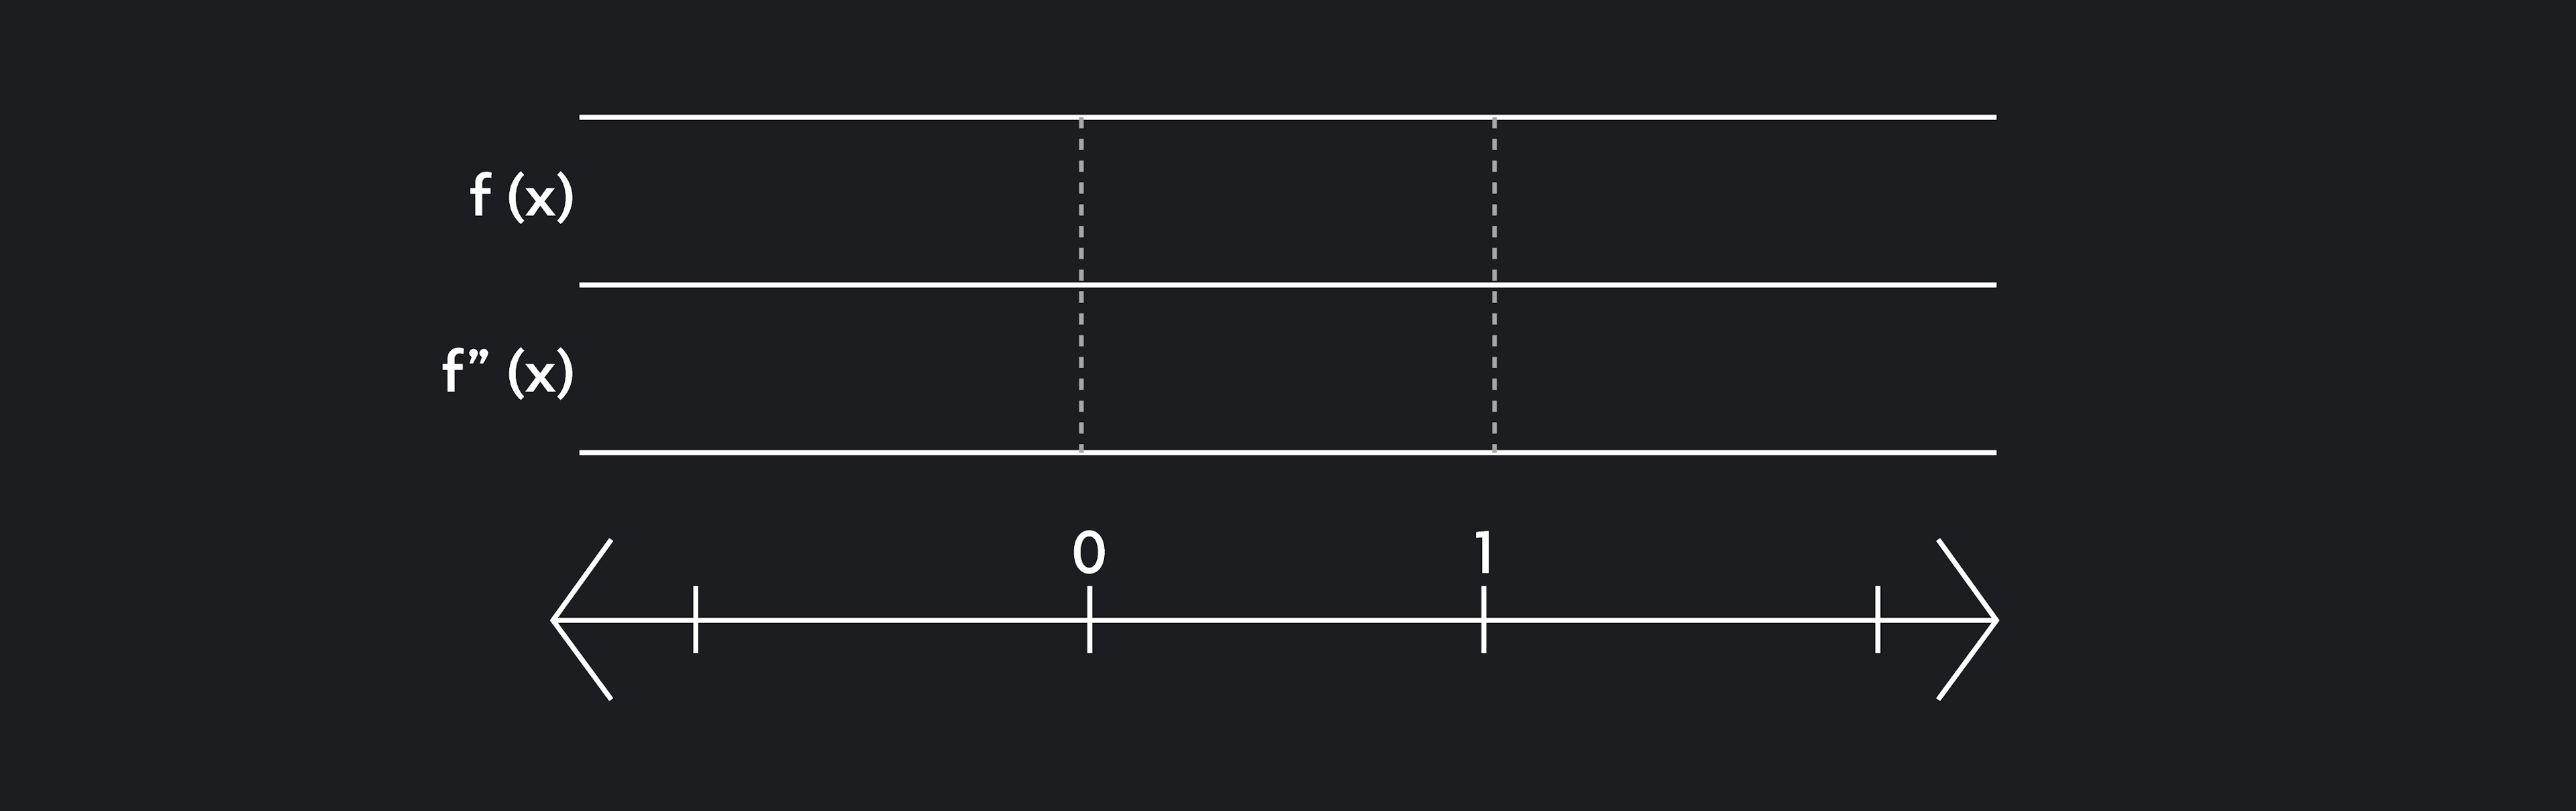
It’s helpful to visualize this process with a number line.
Since the values of f’’(x) to the left and right of x=1 have opposite signs, x=1 is an inflection point.
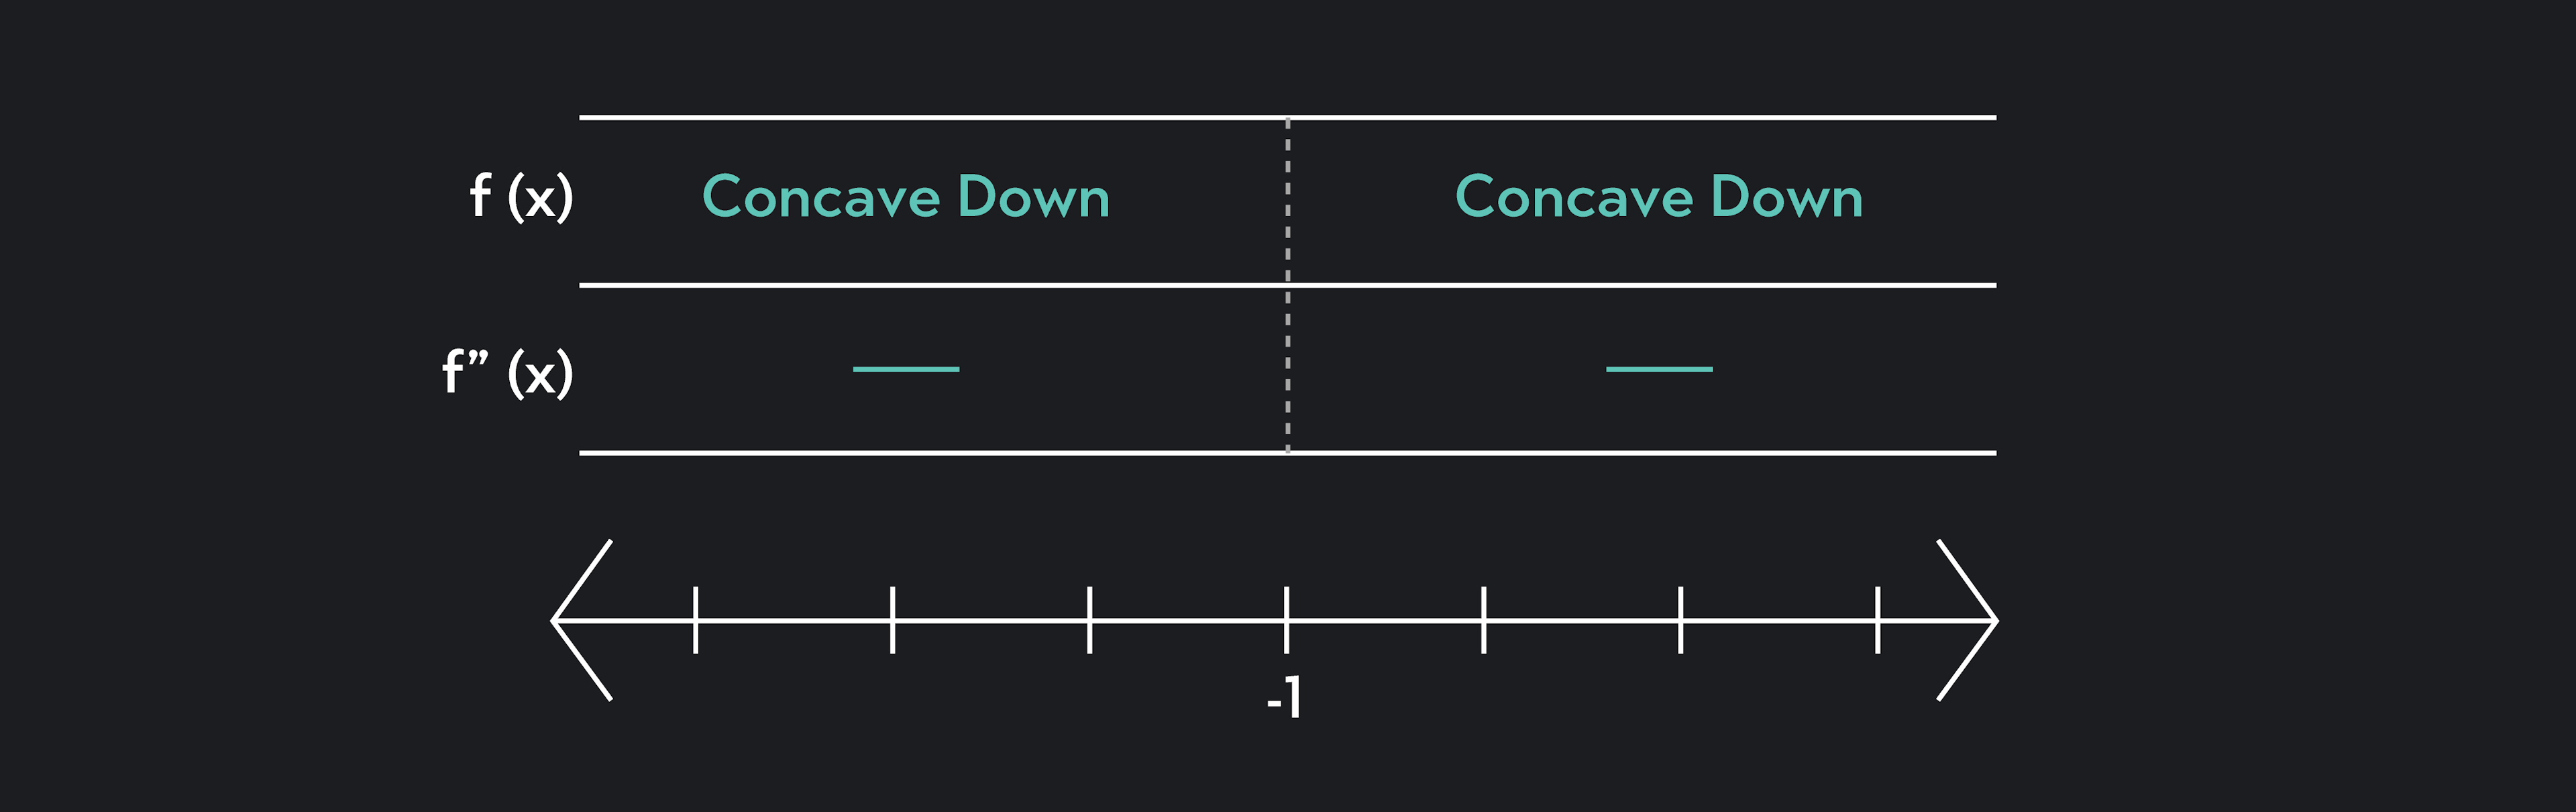
A point that is not an inflection point would have the same sign on both sides of the dotted line. For example, x=−1 is clearly not an inflection point, since values to the left and right of f’’(−1) are both negative and f’’(−1)=0.
We can verify that x=1 is an inflection point by looking at the graph of f.
So, how can we find all the inflection points of a function? Finding all inflection points of a function reveals the intervals where a function is concave up and concave down, so you’ll learn these steps in the next section.
How to Find Intervals of Concave Up and Concave Down
Now that we have the rules below, how can we find all intervals where a function f is concave up or concave down?
If f’’(x)>0 for each x on I, then f is concave up on I.
If f’’(x) < 0 for each x on I, then f is concave down on I.
If f’’(x)=0 for each x on I, then f has no concavity.
6 Steps to Determine Concavity
Given a function f, here are 6 simple steps to determine its concavity:
Step 1
Differentiate to find f’(x).
Step 2
Differentiate f’(x) to find f’’(x).
Step 3
Factor f’’(x) to find the x-values where f’’(x)=0. Also determine the x-values where f’’(x) is undefined, if any.
Step 4
Draw a number line, marking the x-values found in the step above.
Step 5
For each number marked on the line, choose one “test” x-value to the left and one “test” x-value to the right. Plug these test x-values into f’’(x) and record the resulting sign (negative or positive) in the table.
Step 6
Any marked x-value that has opposite signs to the left and right is an inflection point. Any marked x-value that has the same sign to the left and right is not an inflection point.
Find Concavity & Inflection Points Example
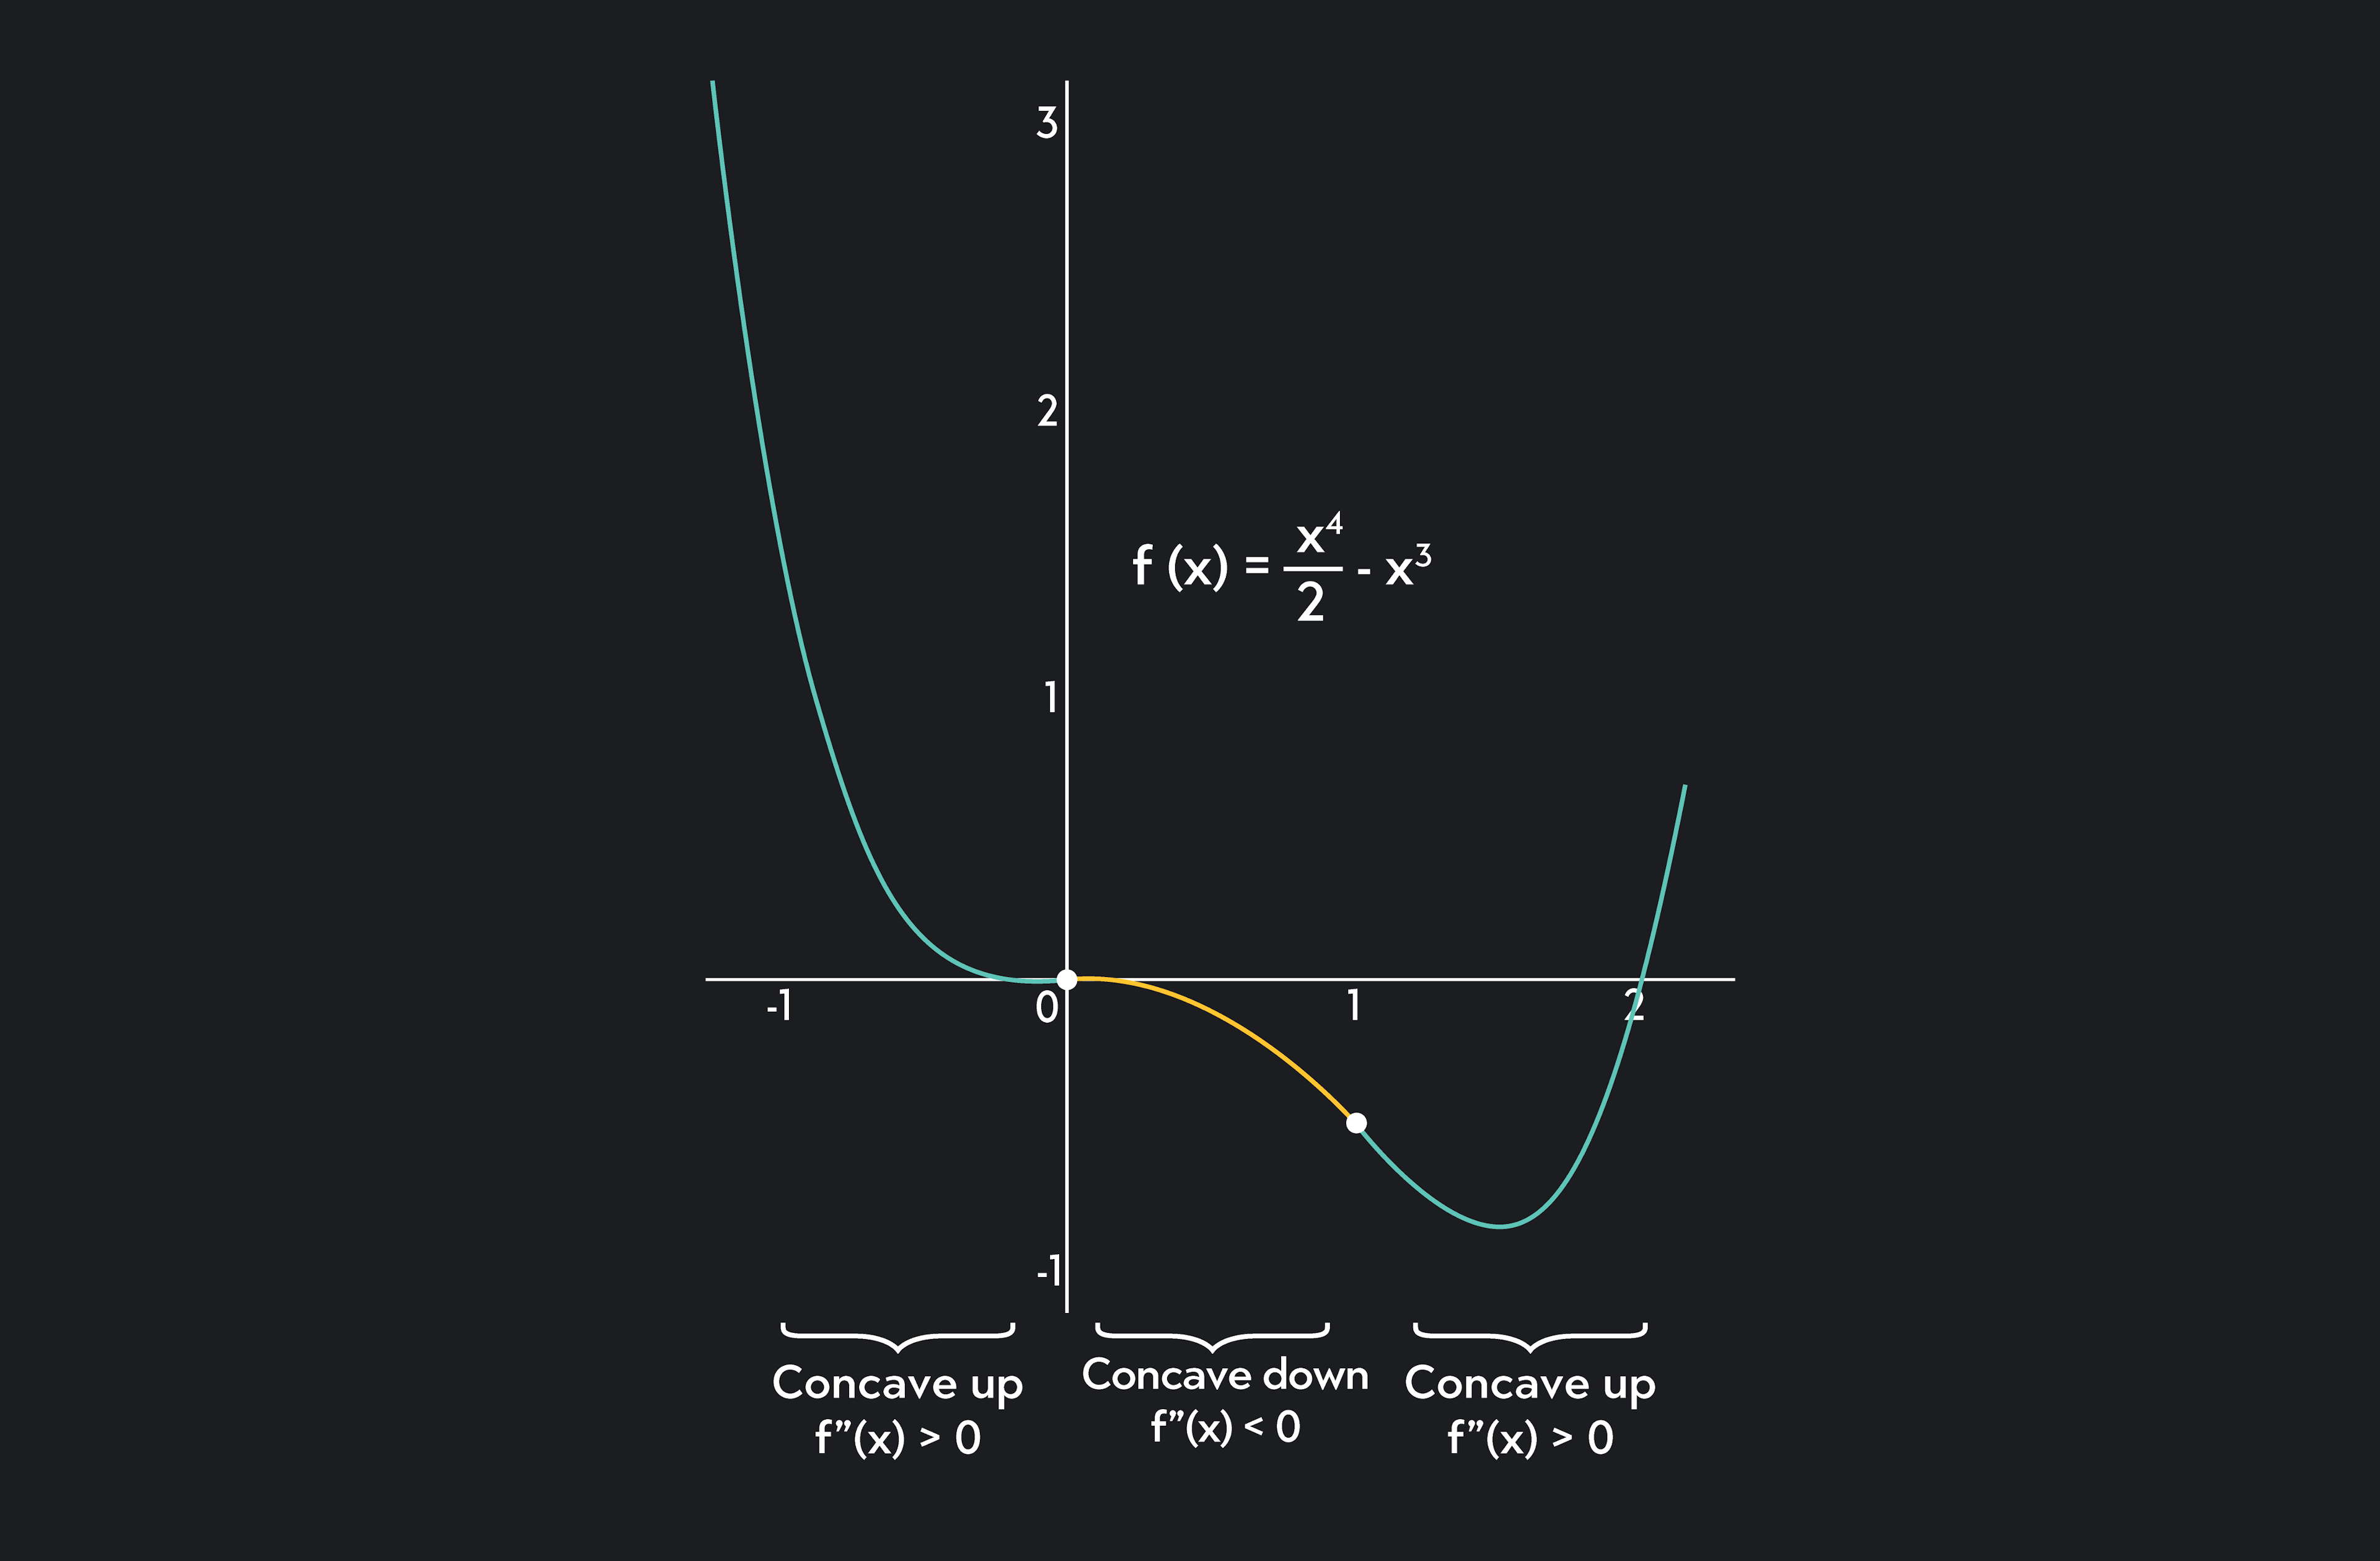
Let’s do one example together. Find all intervals where f(x)=2x4−x3 is concave up or down, and find all inflection points.
Step 1
Using the power rule, f’(x)= 2x3−3x2.
Step 2
Using the power rule, f’’(x)=6x2−6x.
Step 3
Factoring f’’(x), we find f’’(x)=6(x−1)x. So f’’(x)=0 when x=1 and x=0.
Step 4
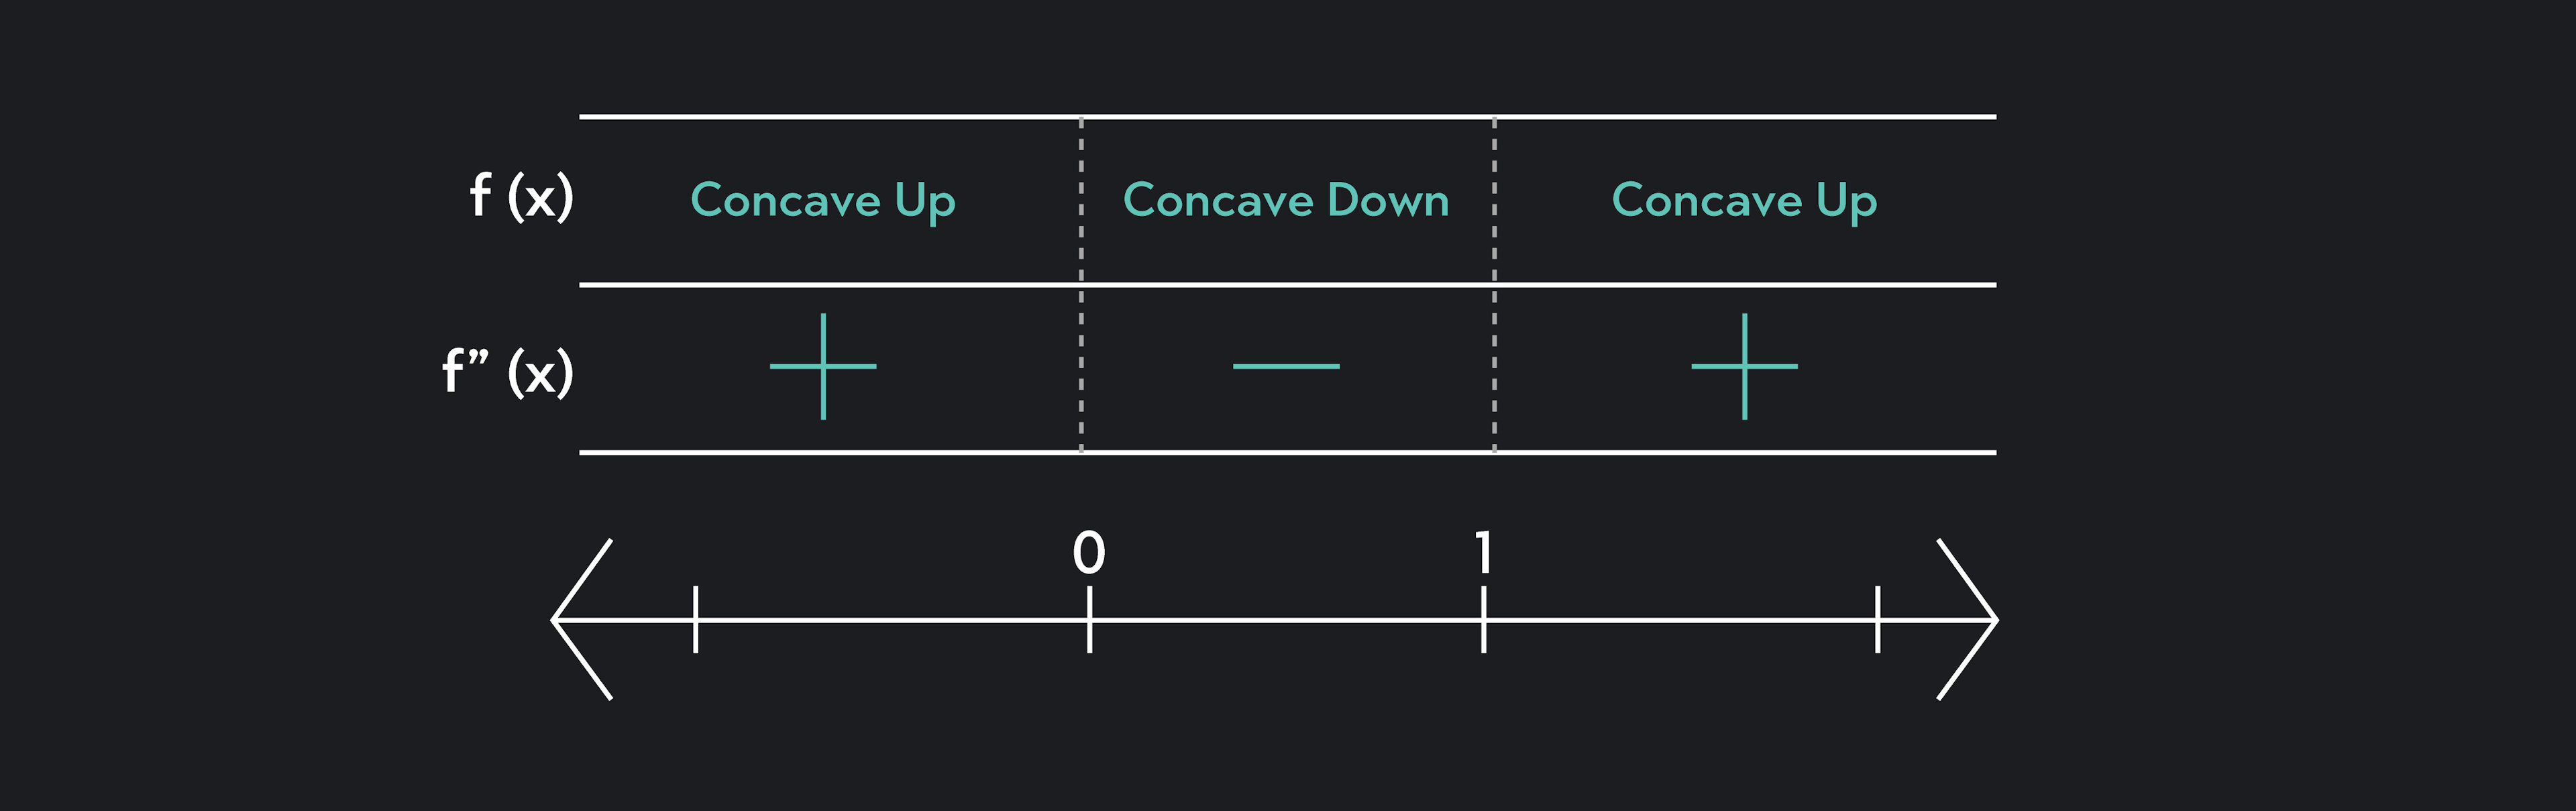
Now, we can create our table.
Step 5
Choosing a point to the left of x=0, say x=−1, we find that f’’(−1)=6+6=12. So, we can put a plus sign to the left of x=0. Since f’’(x)>0, this means that f is concave up on the interval (−∞,0).
Choosing a point to the right of x = 0, say x = \frac{1}{2}, we find that f’’(\frac{1}{2}) = \frac{3}{2} - 3 = -\frac{1}{2}. Since f’’(x) < 0, this means that f is concave down on the interval (0, 1).
Choosing a point to the right of x=1, say x=2, we find that f’’(2)=24−12=12. Since f’’(x)>0, this means that f is concave up on the interval (1,∞).
Step 6
Since both x=0 and x=1 have opposite signs to their left and right, both x=0 and x=1 are inflection points.
Analyzing our table, we can see that f is concave up on the interval (−∞,0) and (1,∞), and concave down on the interval (0,1).
We can verify our answer by looking at the graph of f(x)=2x4−x3:
Now, let’s learn how to find concavity from the first derivative test graph. Remember we deduced earlier that we can also determine concavity using these rules:
If f’ is increasing on I, then f is concave up on I.
If f’ is decreasing on I, then f is concave down on I.
If f’ is constant on I, then f has no concavity.
As long as you have the graph of f’, you can visually determine where f is concave up or down by identifying the intervals where f’ is increasing.
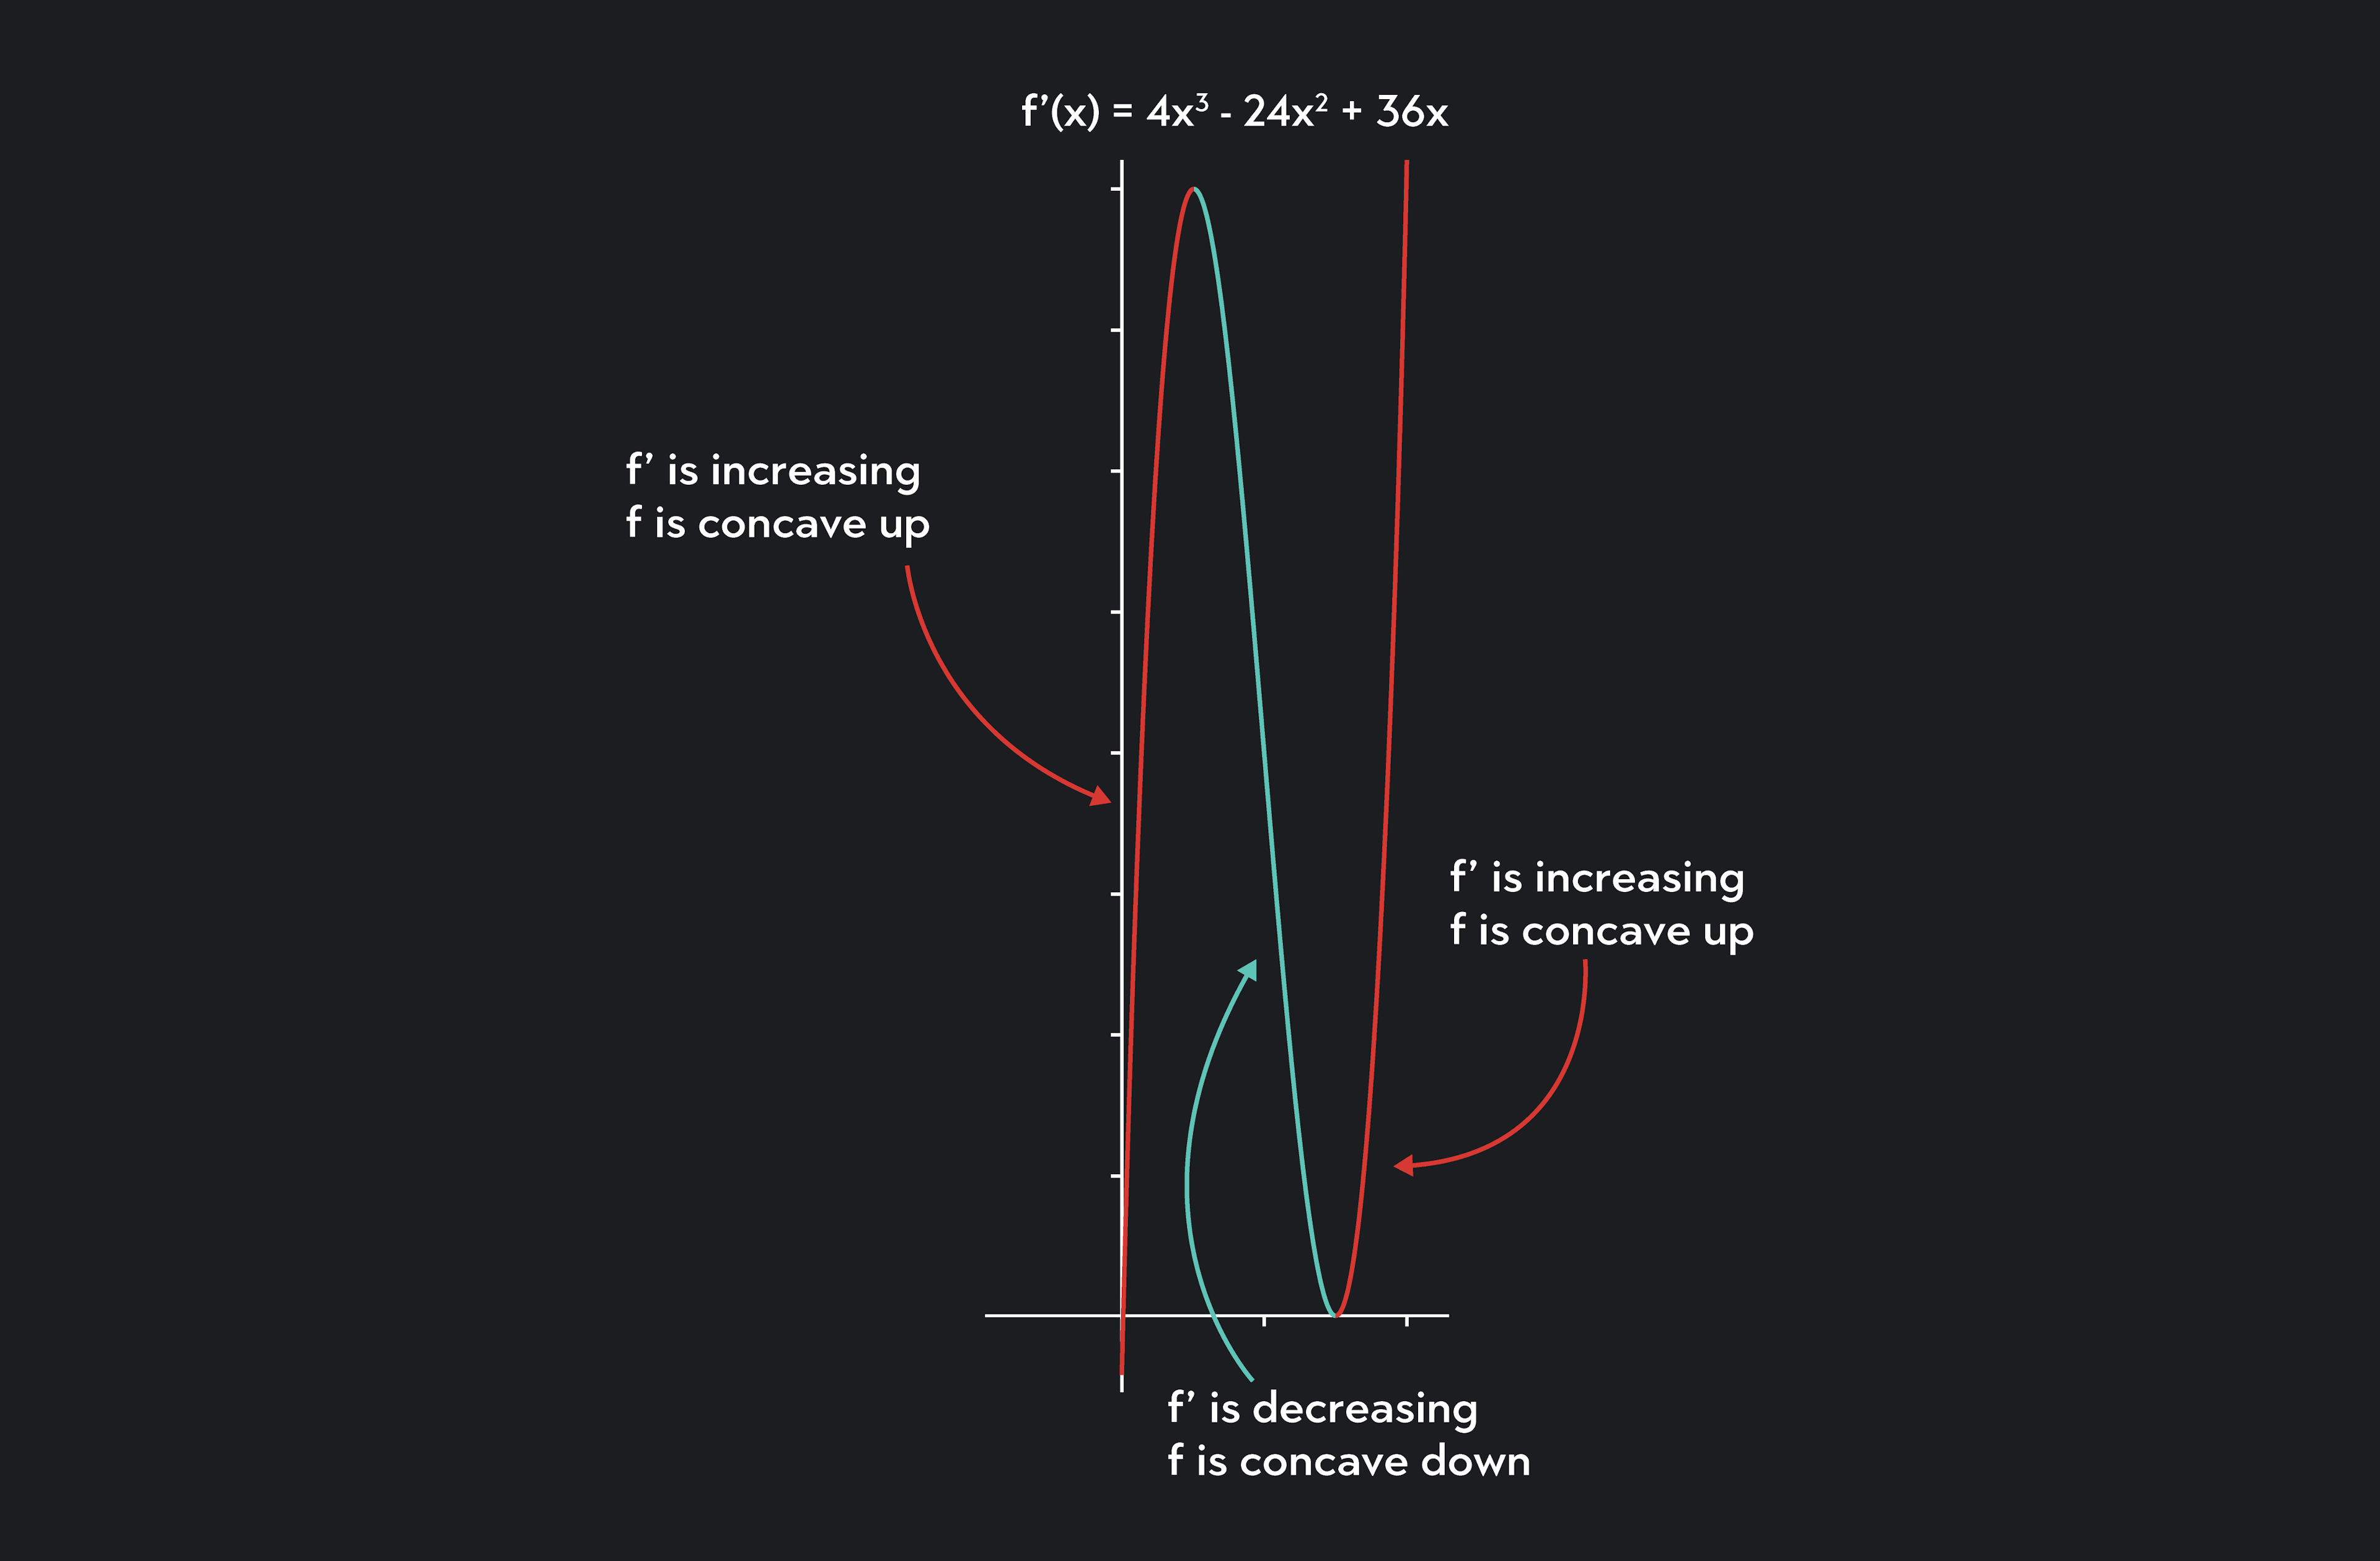
For example, consider the function f(x)=x4−8x3+18x2. The graph of its first derivative f’(x)=4x3−24x2+36x is given below.
Using the graph, f’ is increasing on the intervals (−∞,1) and (3,∞), and decreasing on the interval (1,3).
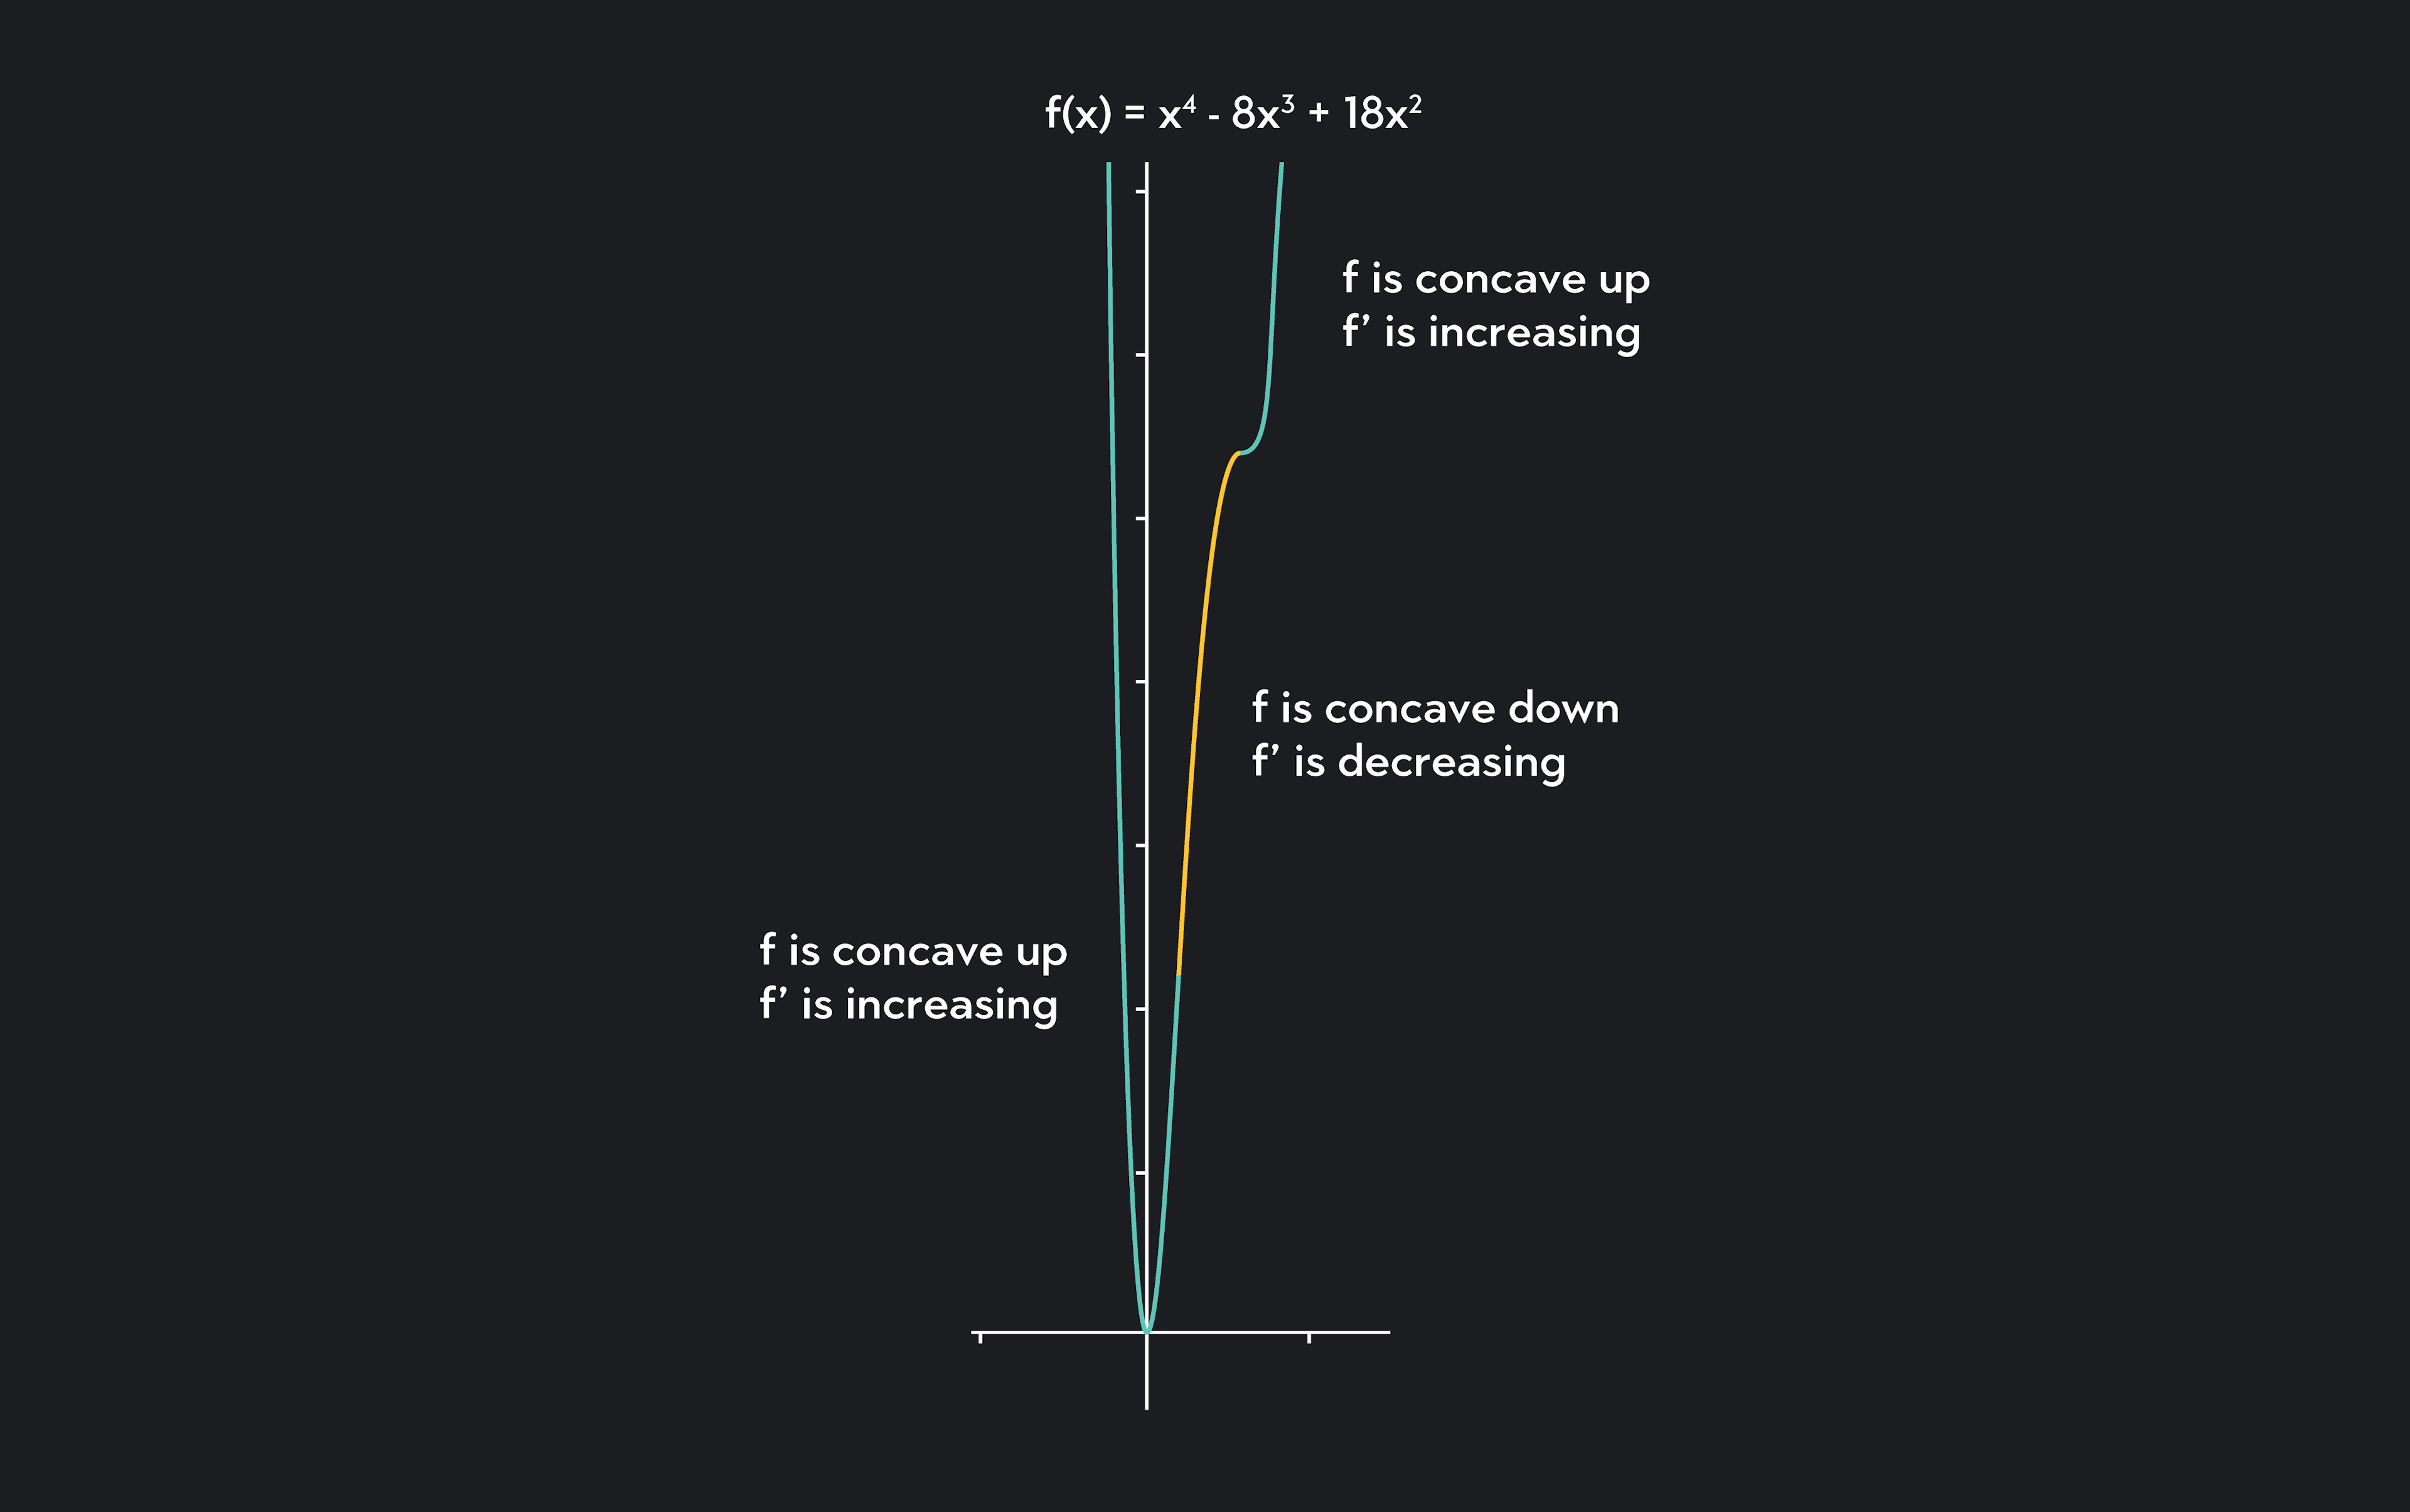
Since f is concave up when f’ is increasing and concave down when f’ is decreasing, then f is concave up on the intervals (−∞,1) and (3,∞), and concave down on the interval (1,3).
We can verify our answer by looking at the graph of f.
Outlier (from the co-founder of MasterClass) has brought together some of the world's best instructors, game designers, and filmmakers to create the future of online college.