Inflection Point: Definition and How to Find It in 5 Steps
05.17.2022 • 8 min read
Rachel McLean
Subject Matter Expert
This article explains the definition of an inflection point, as well as the relationship between inflection points and concave up/concave down intervals. We also discuss how to find inflection points on a graph and how to identify inflection points in 5 steps using a table.
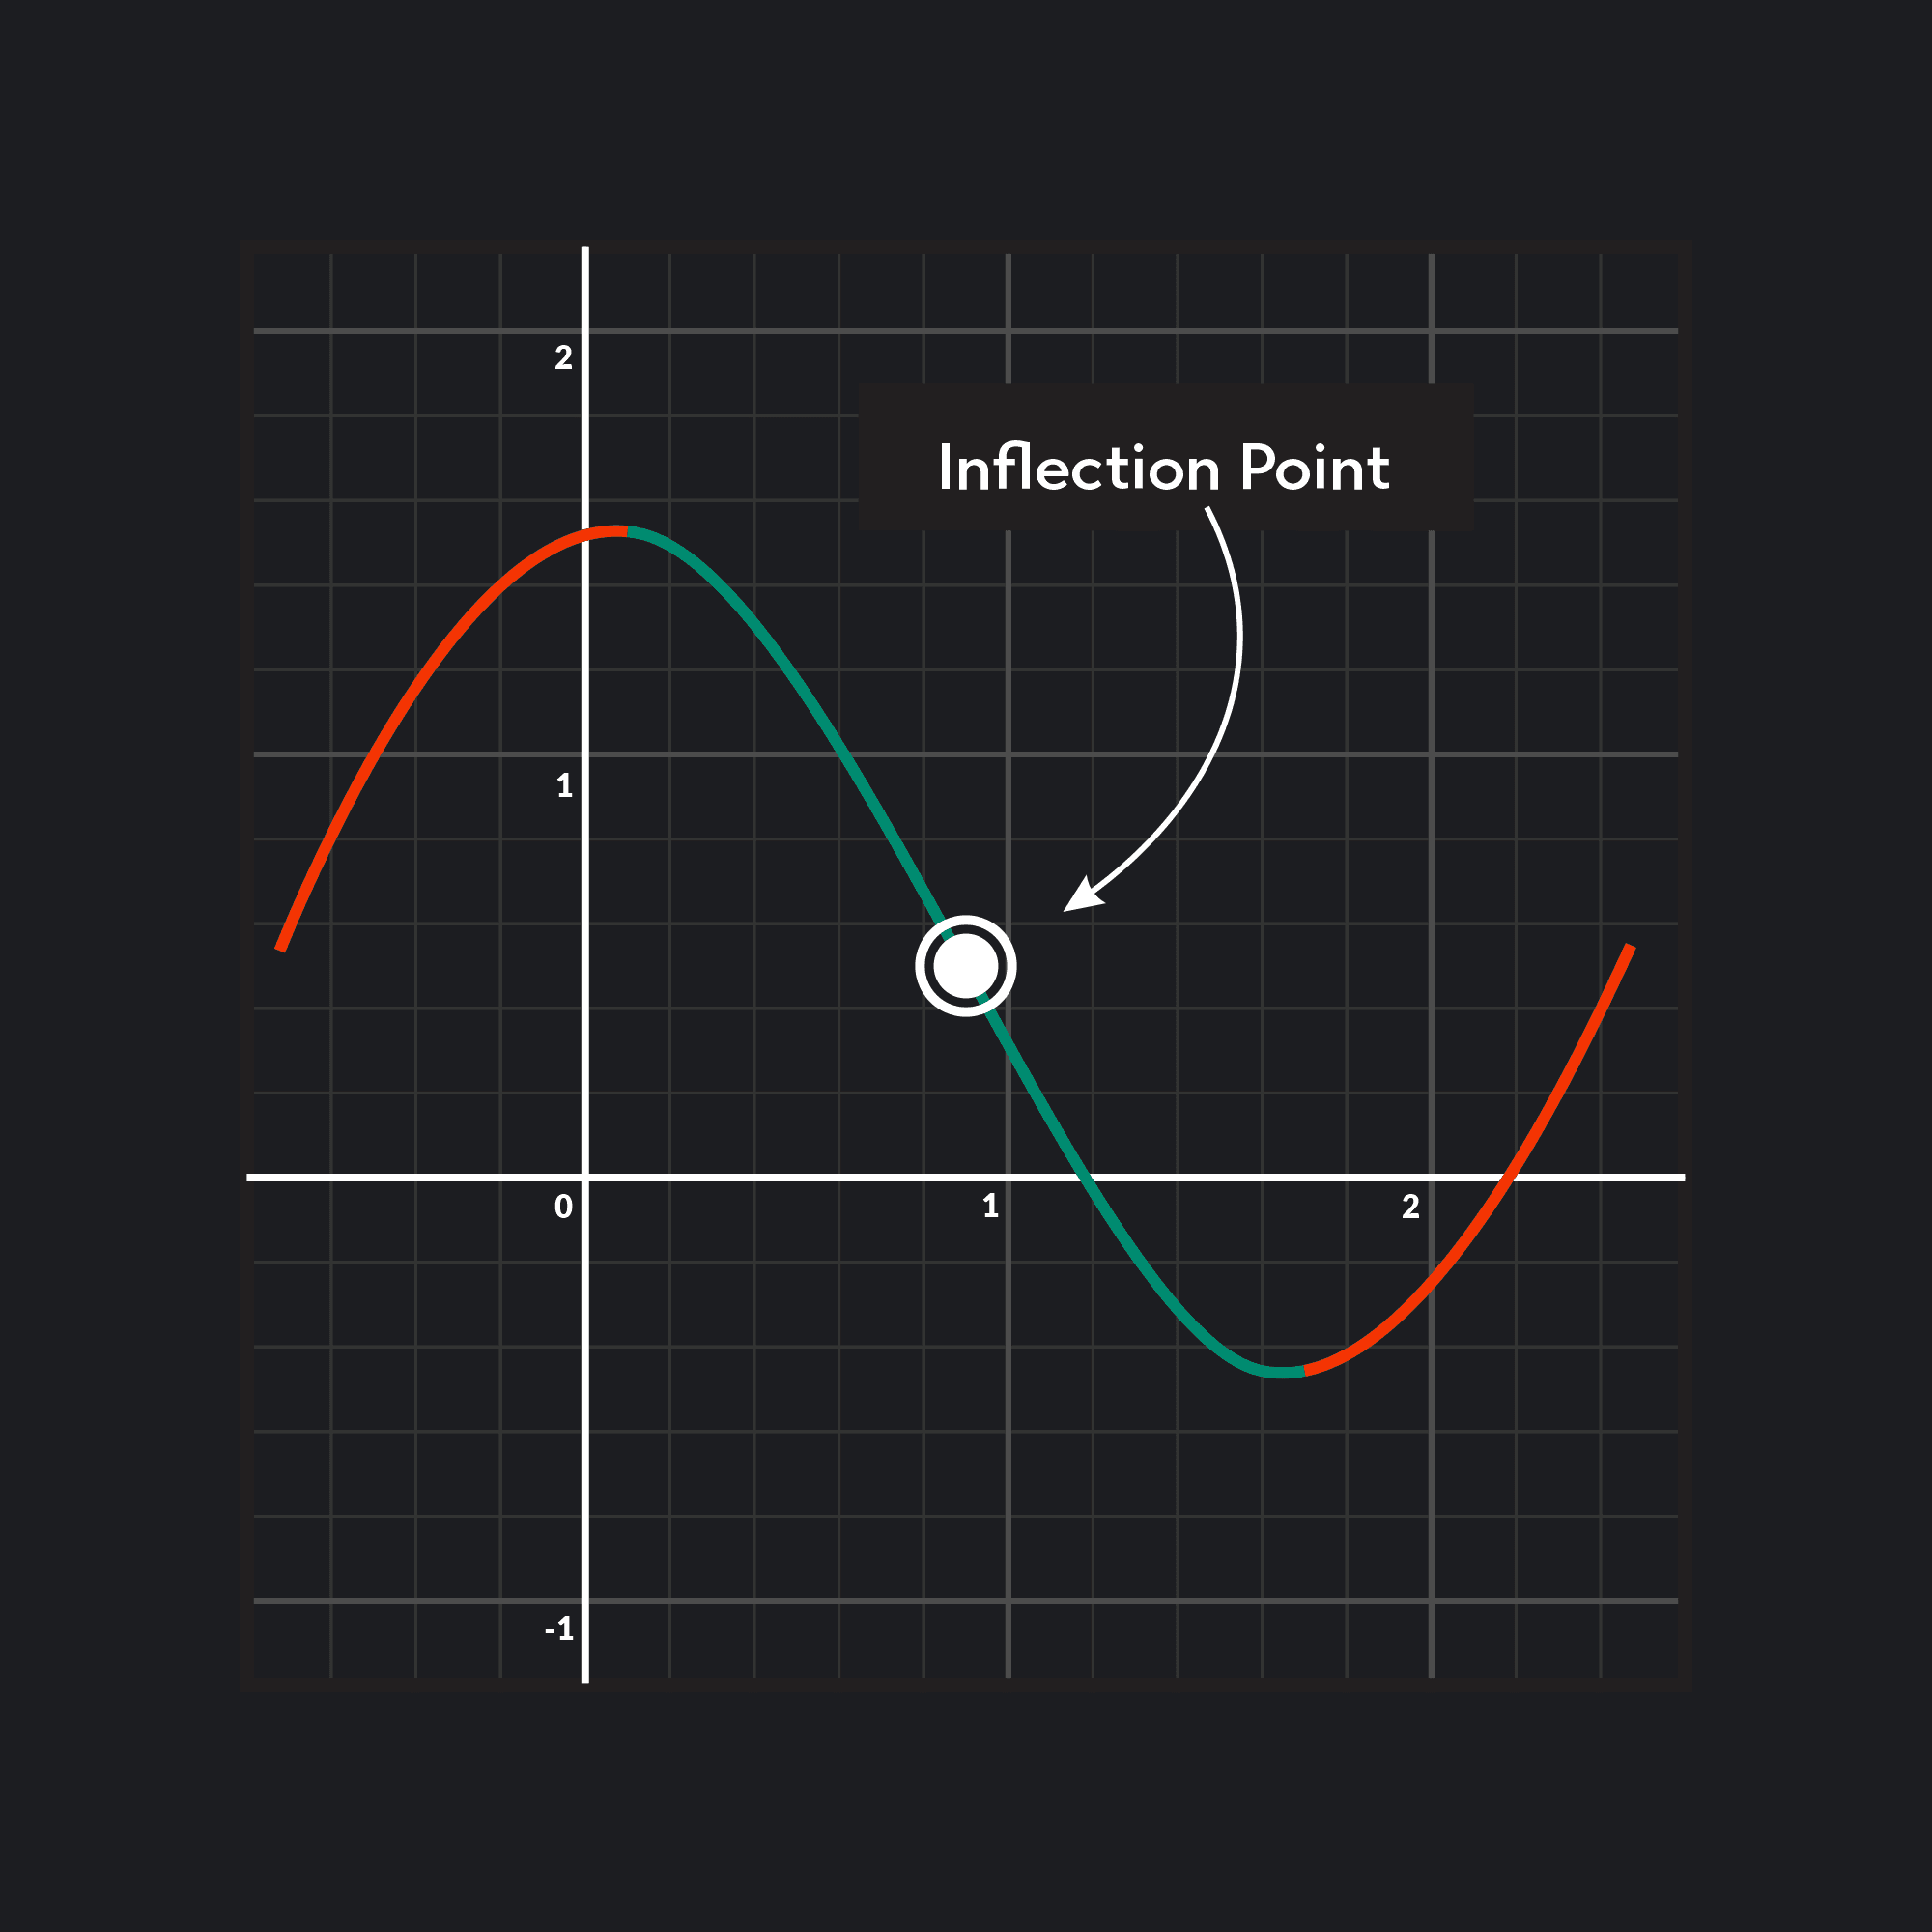
Inflection points are points on a graph where a function changes concavity. If you examine the graph below, you can see that the behavior of the function changes at the point marked by the arrow. The marked point is the transition point where the curve changes from a mountain shape to a valley shape.
Inflection points occur where the second derivative changes sign from negative to positive, or vice versa, from positive to negative. In order for the second derivative to change sign, the intermediate value theorem guarantees that the second derivative equals 0 or is undefined at some point x.
So, if f has an inflection point at x, then f’’(x)=0 or f’’(x) is undefined.
The red and blue lines indicate when f is increasing or decreasing. As the above curve demonstrates, an inflection point does not necessarily occur when f changes from increasing to decreasing.
Inflection points are different than critical points. Critical points are points on the curve of a function f at which the slope of the tangent line equals 0 or is undefined. All maxima or minima extrema are found either at these critical points or at endpoints.
The second derivative test can be used to determine a local minimum or maximum, but this process is different than identifying inflection points. Inflection points are points where the sign of the second derivative changes and are used to determine intervals of concavity.
Concave Upward and Concave Downward
Intervals of a curve that are concave up look like valleys. Intervals of a curve that are concave down look like mountains. We have three rules to determine the concavity of a graph. No concavity simply means that f is a straight line over the interval I.
Assuming that f is a differentiable function on the interval I with derivatives f’ and f’’:
If f’’(x)>0 for each x on I, then f’ is increasing on I, and f is concave up on I.
If f’’(x) < 0 for each x on I, then f’ is decreasing on I, and f is concave down on I.
If f’’(x)=0 for each x on I, then f’ is constant on I, and f has no concavity.
The above rules actually give us two ways to test for concavity. One option is to check when the second derivative is greater than 0, less than 0, and/or equal to 0. The second option is to check when the first derivative is increasing, decreasing, and/or constant. The second option is useful if you are given a graph of the first derivative function and asked to determine concavity.
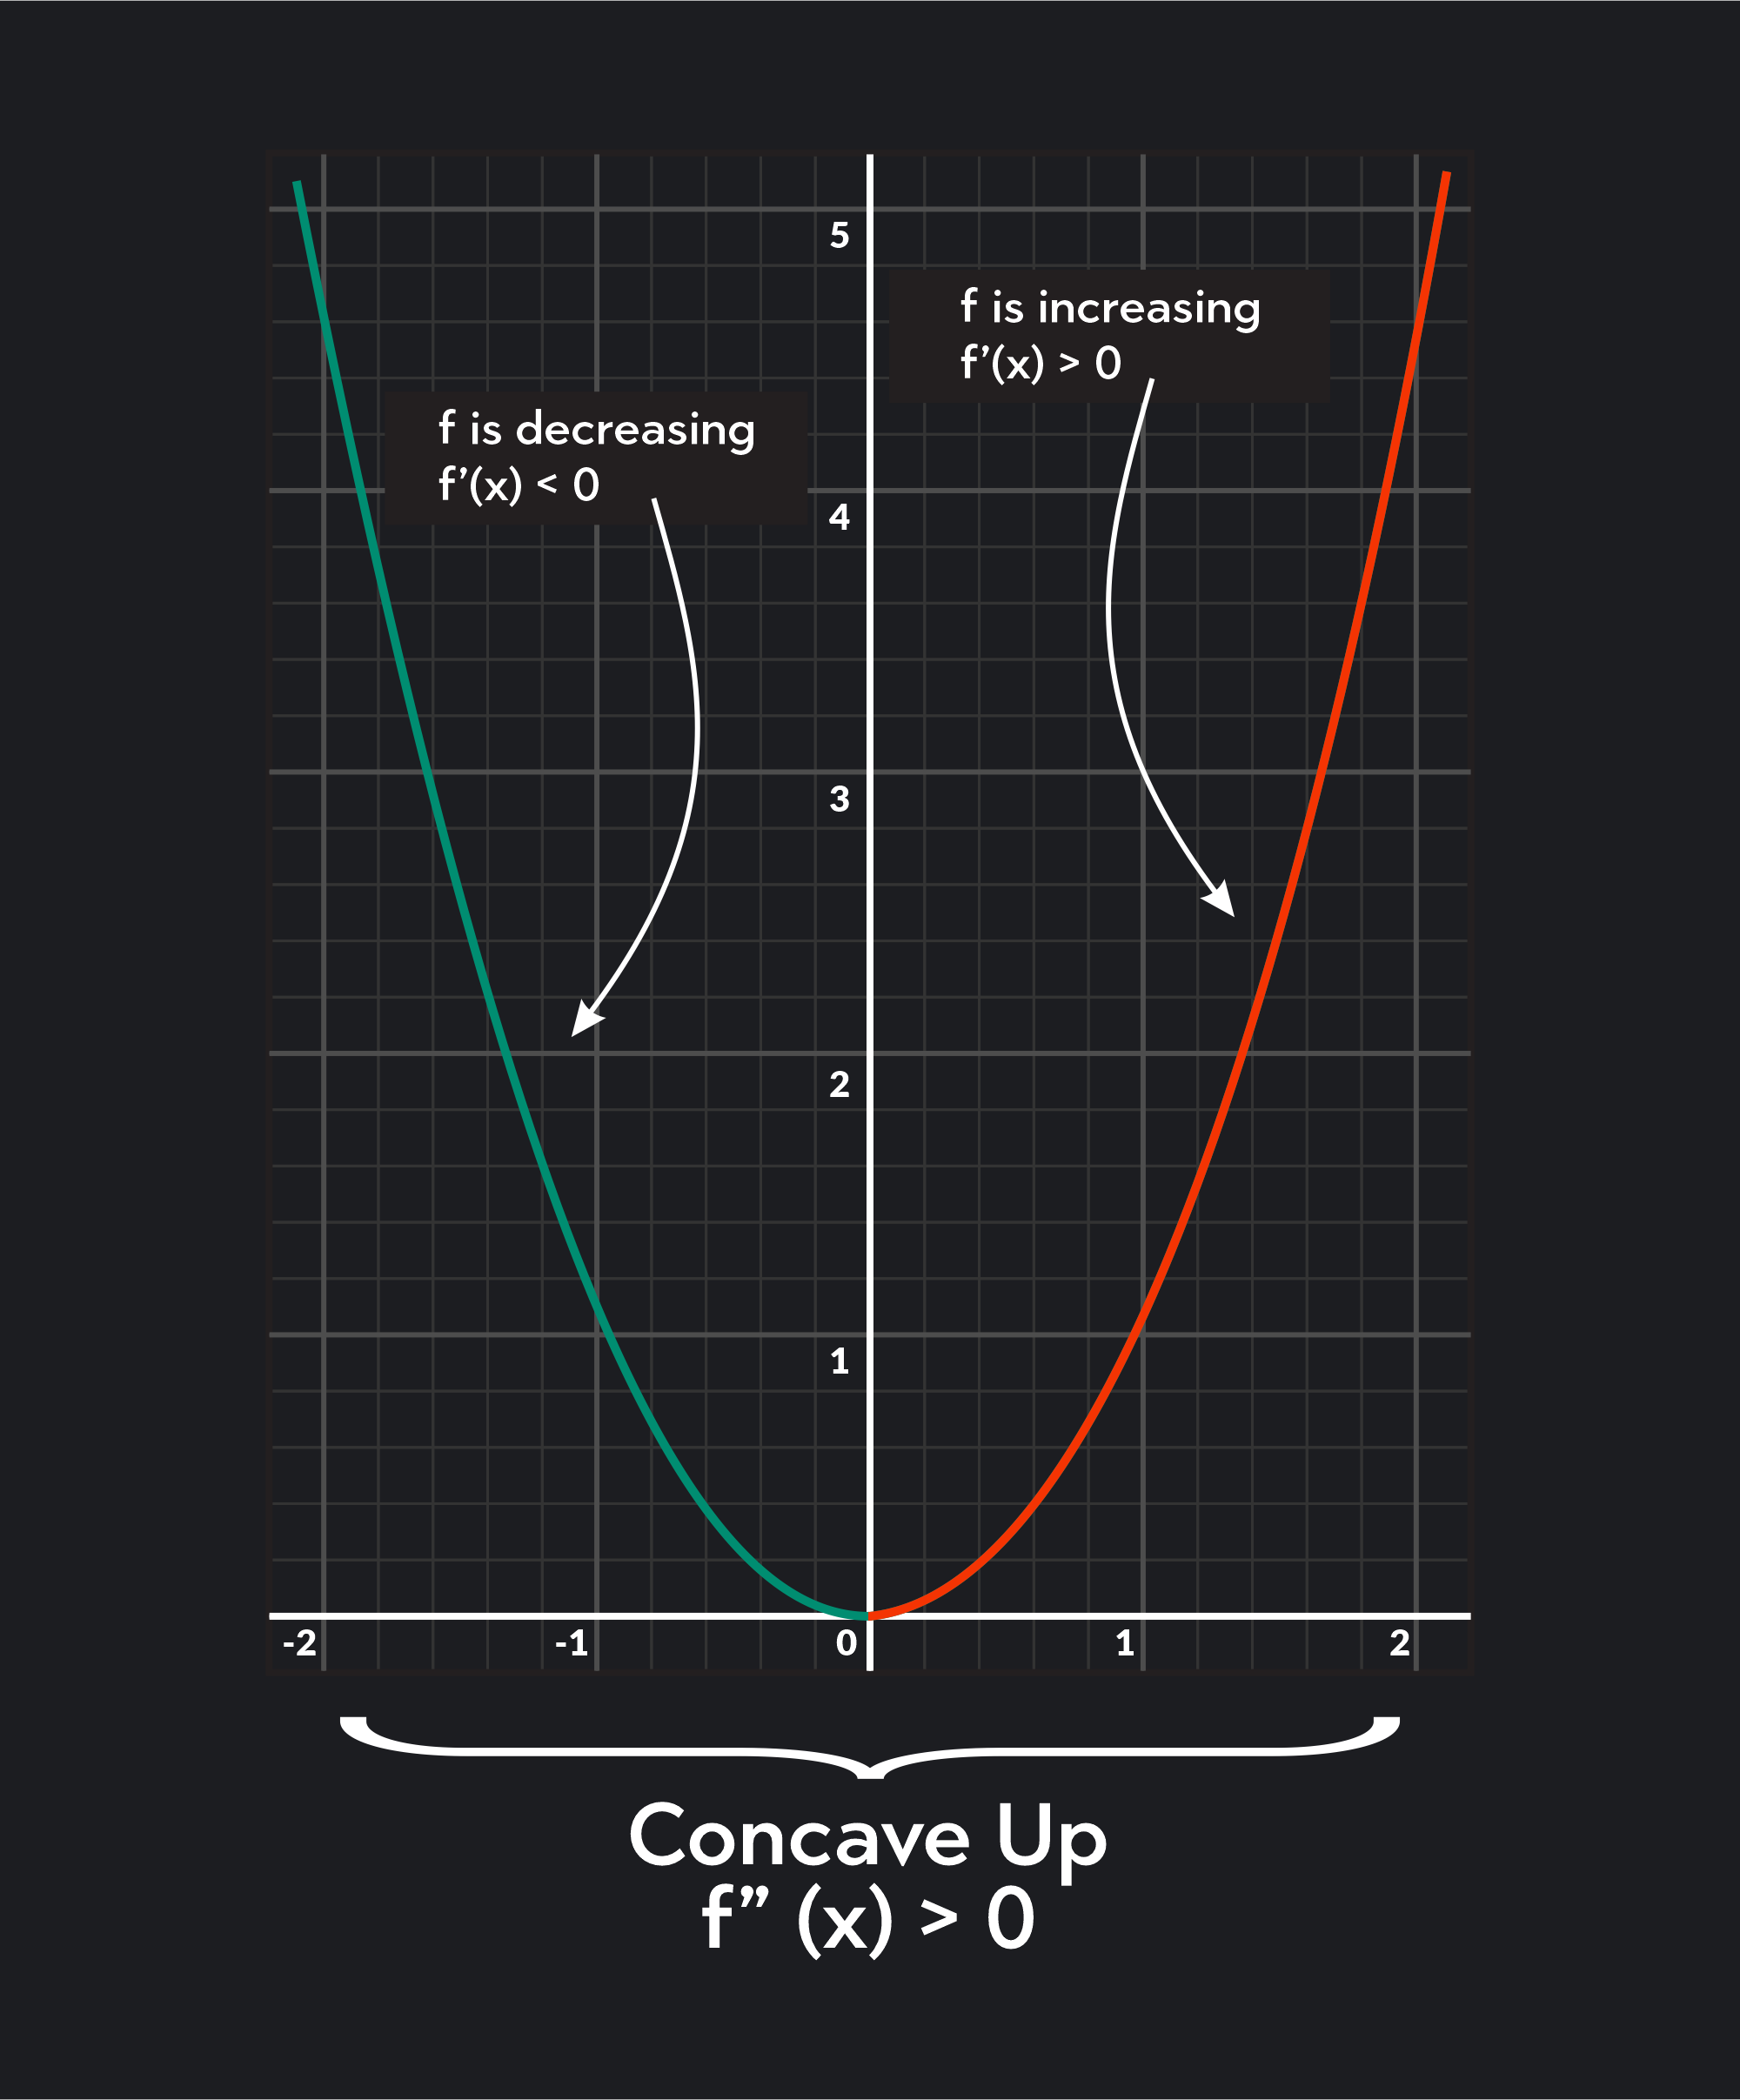
The graph below is an example of a concave up curve, which means that the second derivative f is greater than zero.
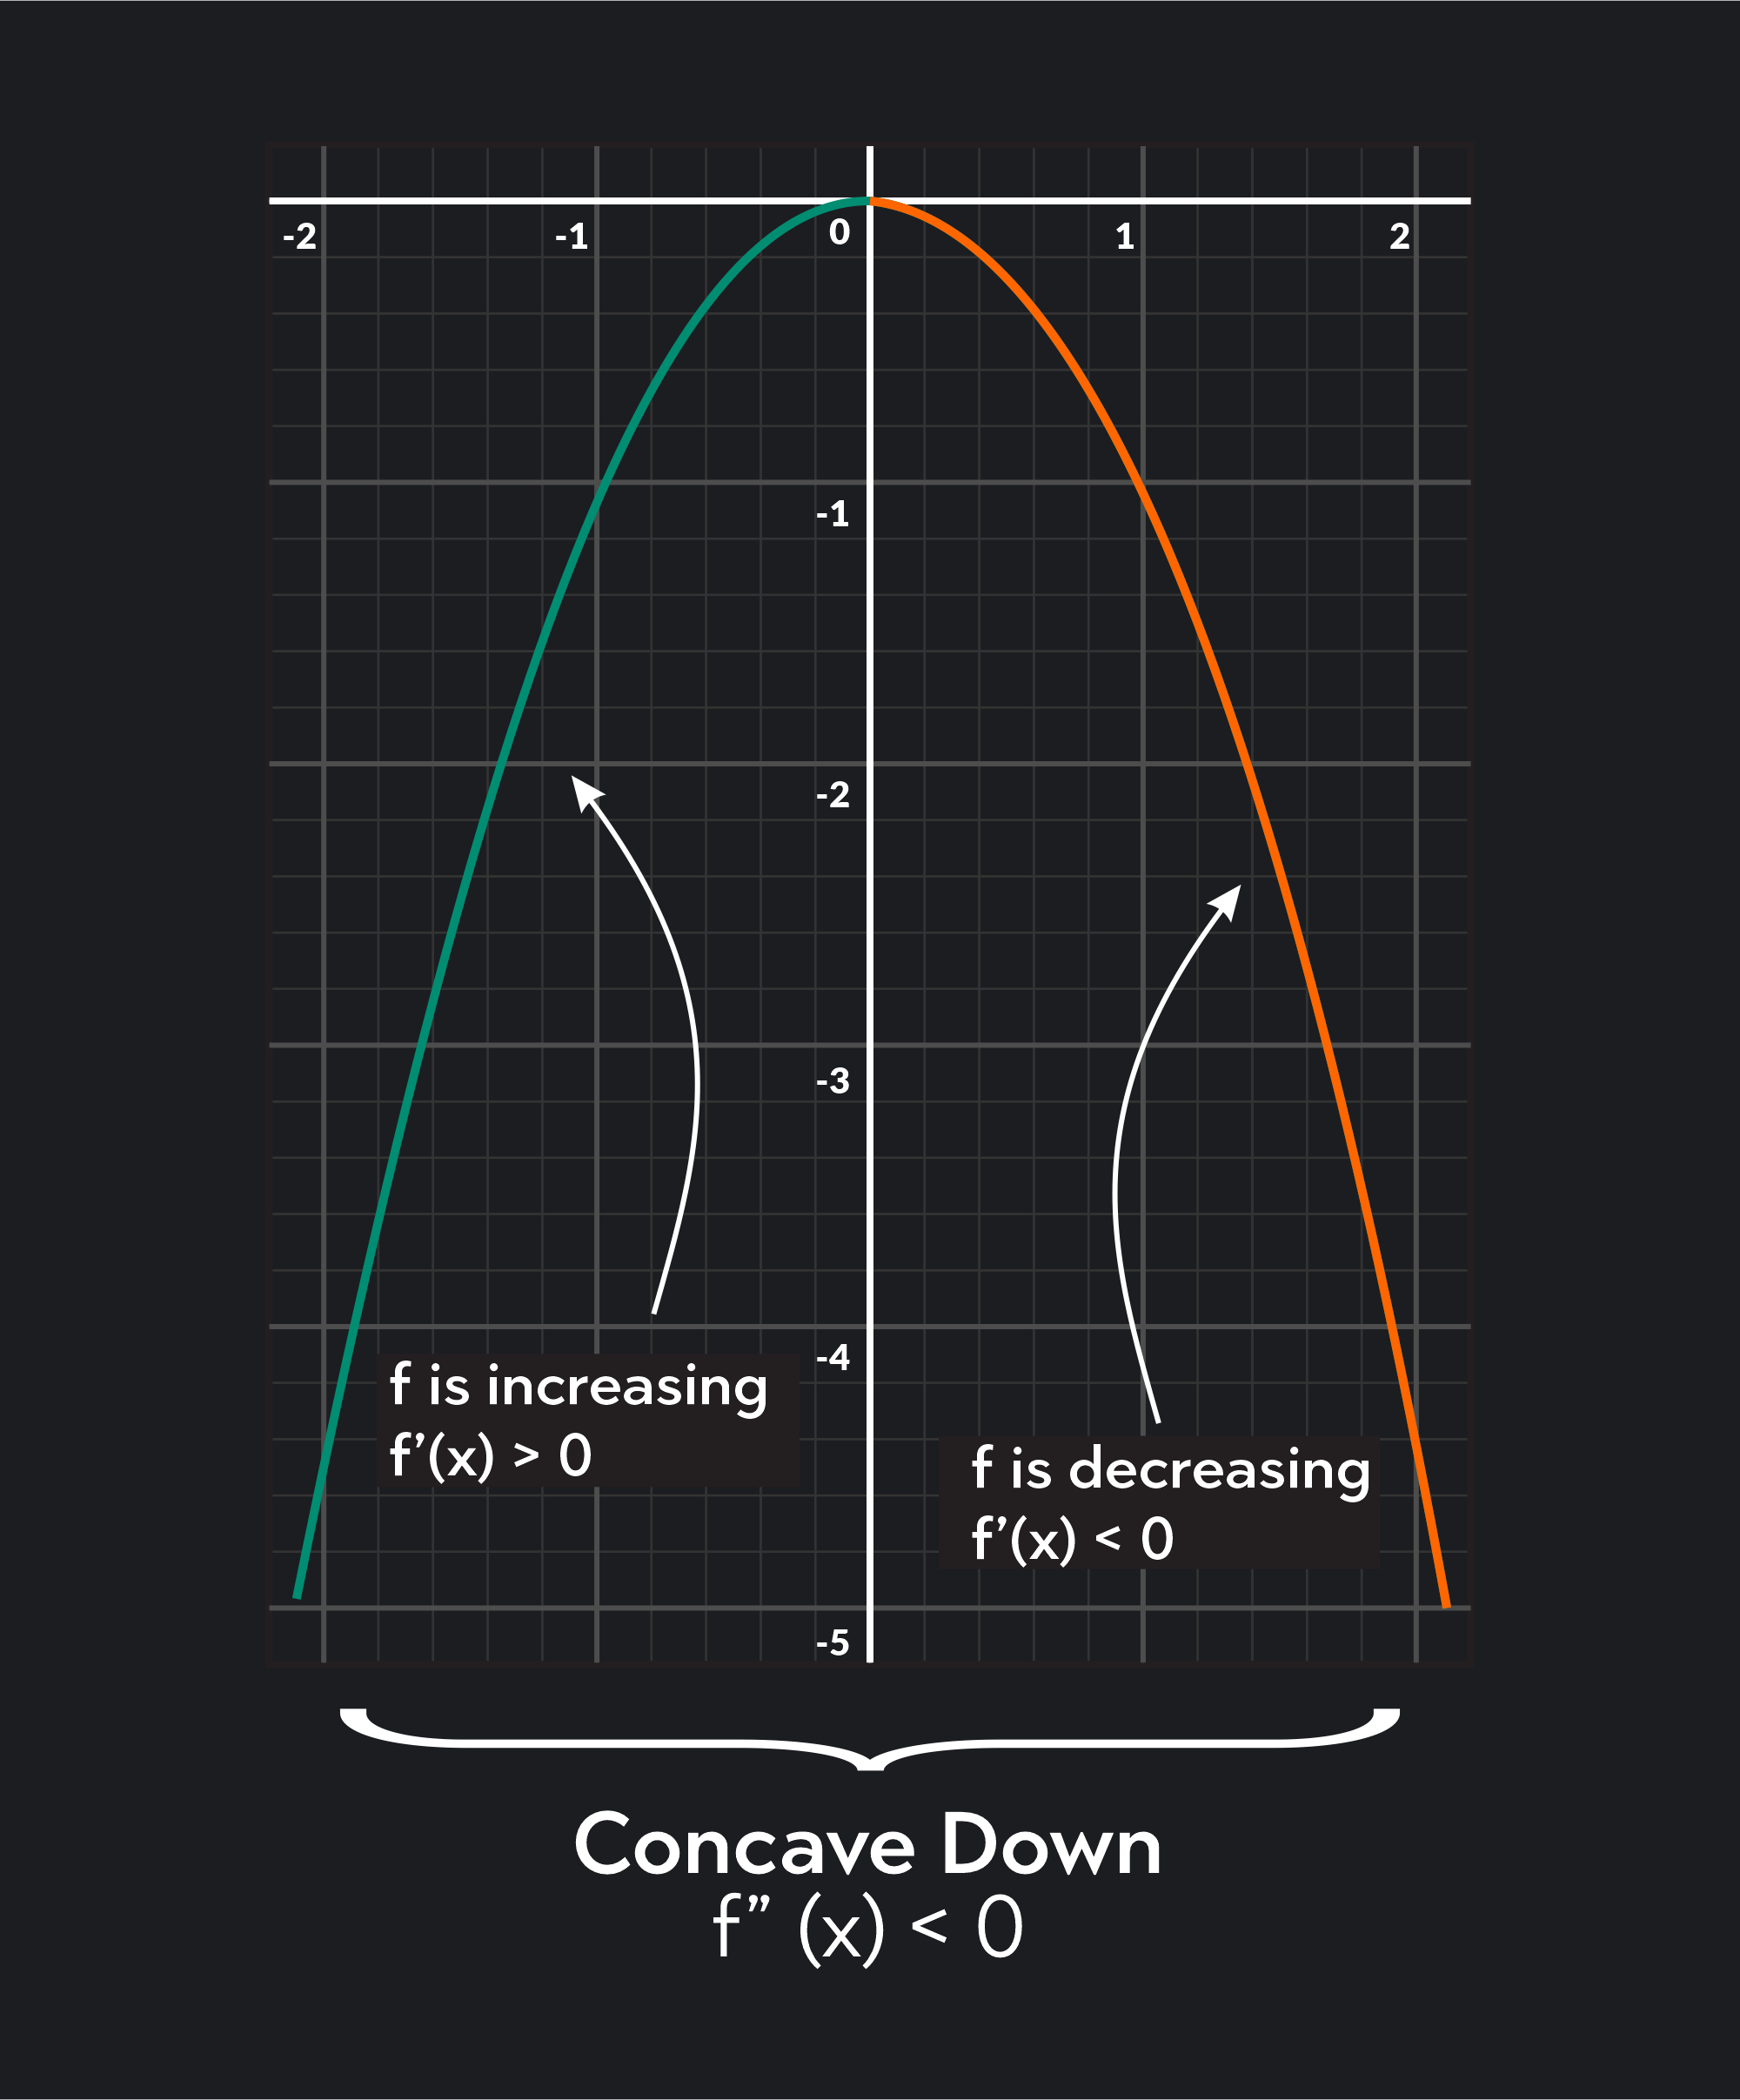
This next graph below is an example of a concave down curvature, which means that the second derivative is less than zero.
To understand concavity, you should be familiar with the notion of increasing and decreasing intervals of a function. In the above graph, the blue line indicates when the function is decreasing. The red line indicates when the function is increasing. It’s very important to remember that increasing and decreasing intervals are different from concave up and concave down intervals.
Assuming that our function is differentiable on the interval I, we can say:
If f’(x)>0 for each x on I, then f is increasing on I.
If f’(x) < 0 for each x on I, then f is decreasing on I.
If f’(x)=0 for each x on I, then f is constant on I.
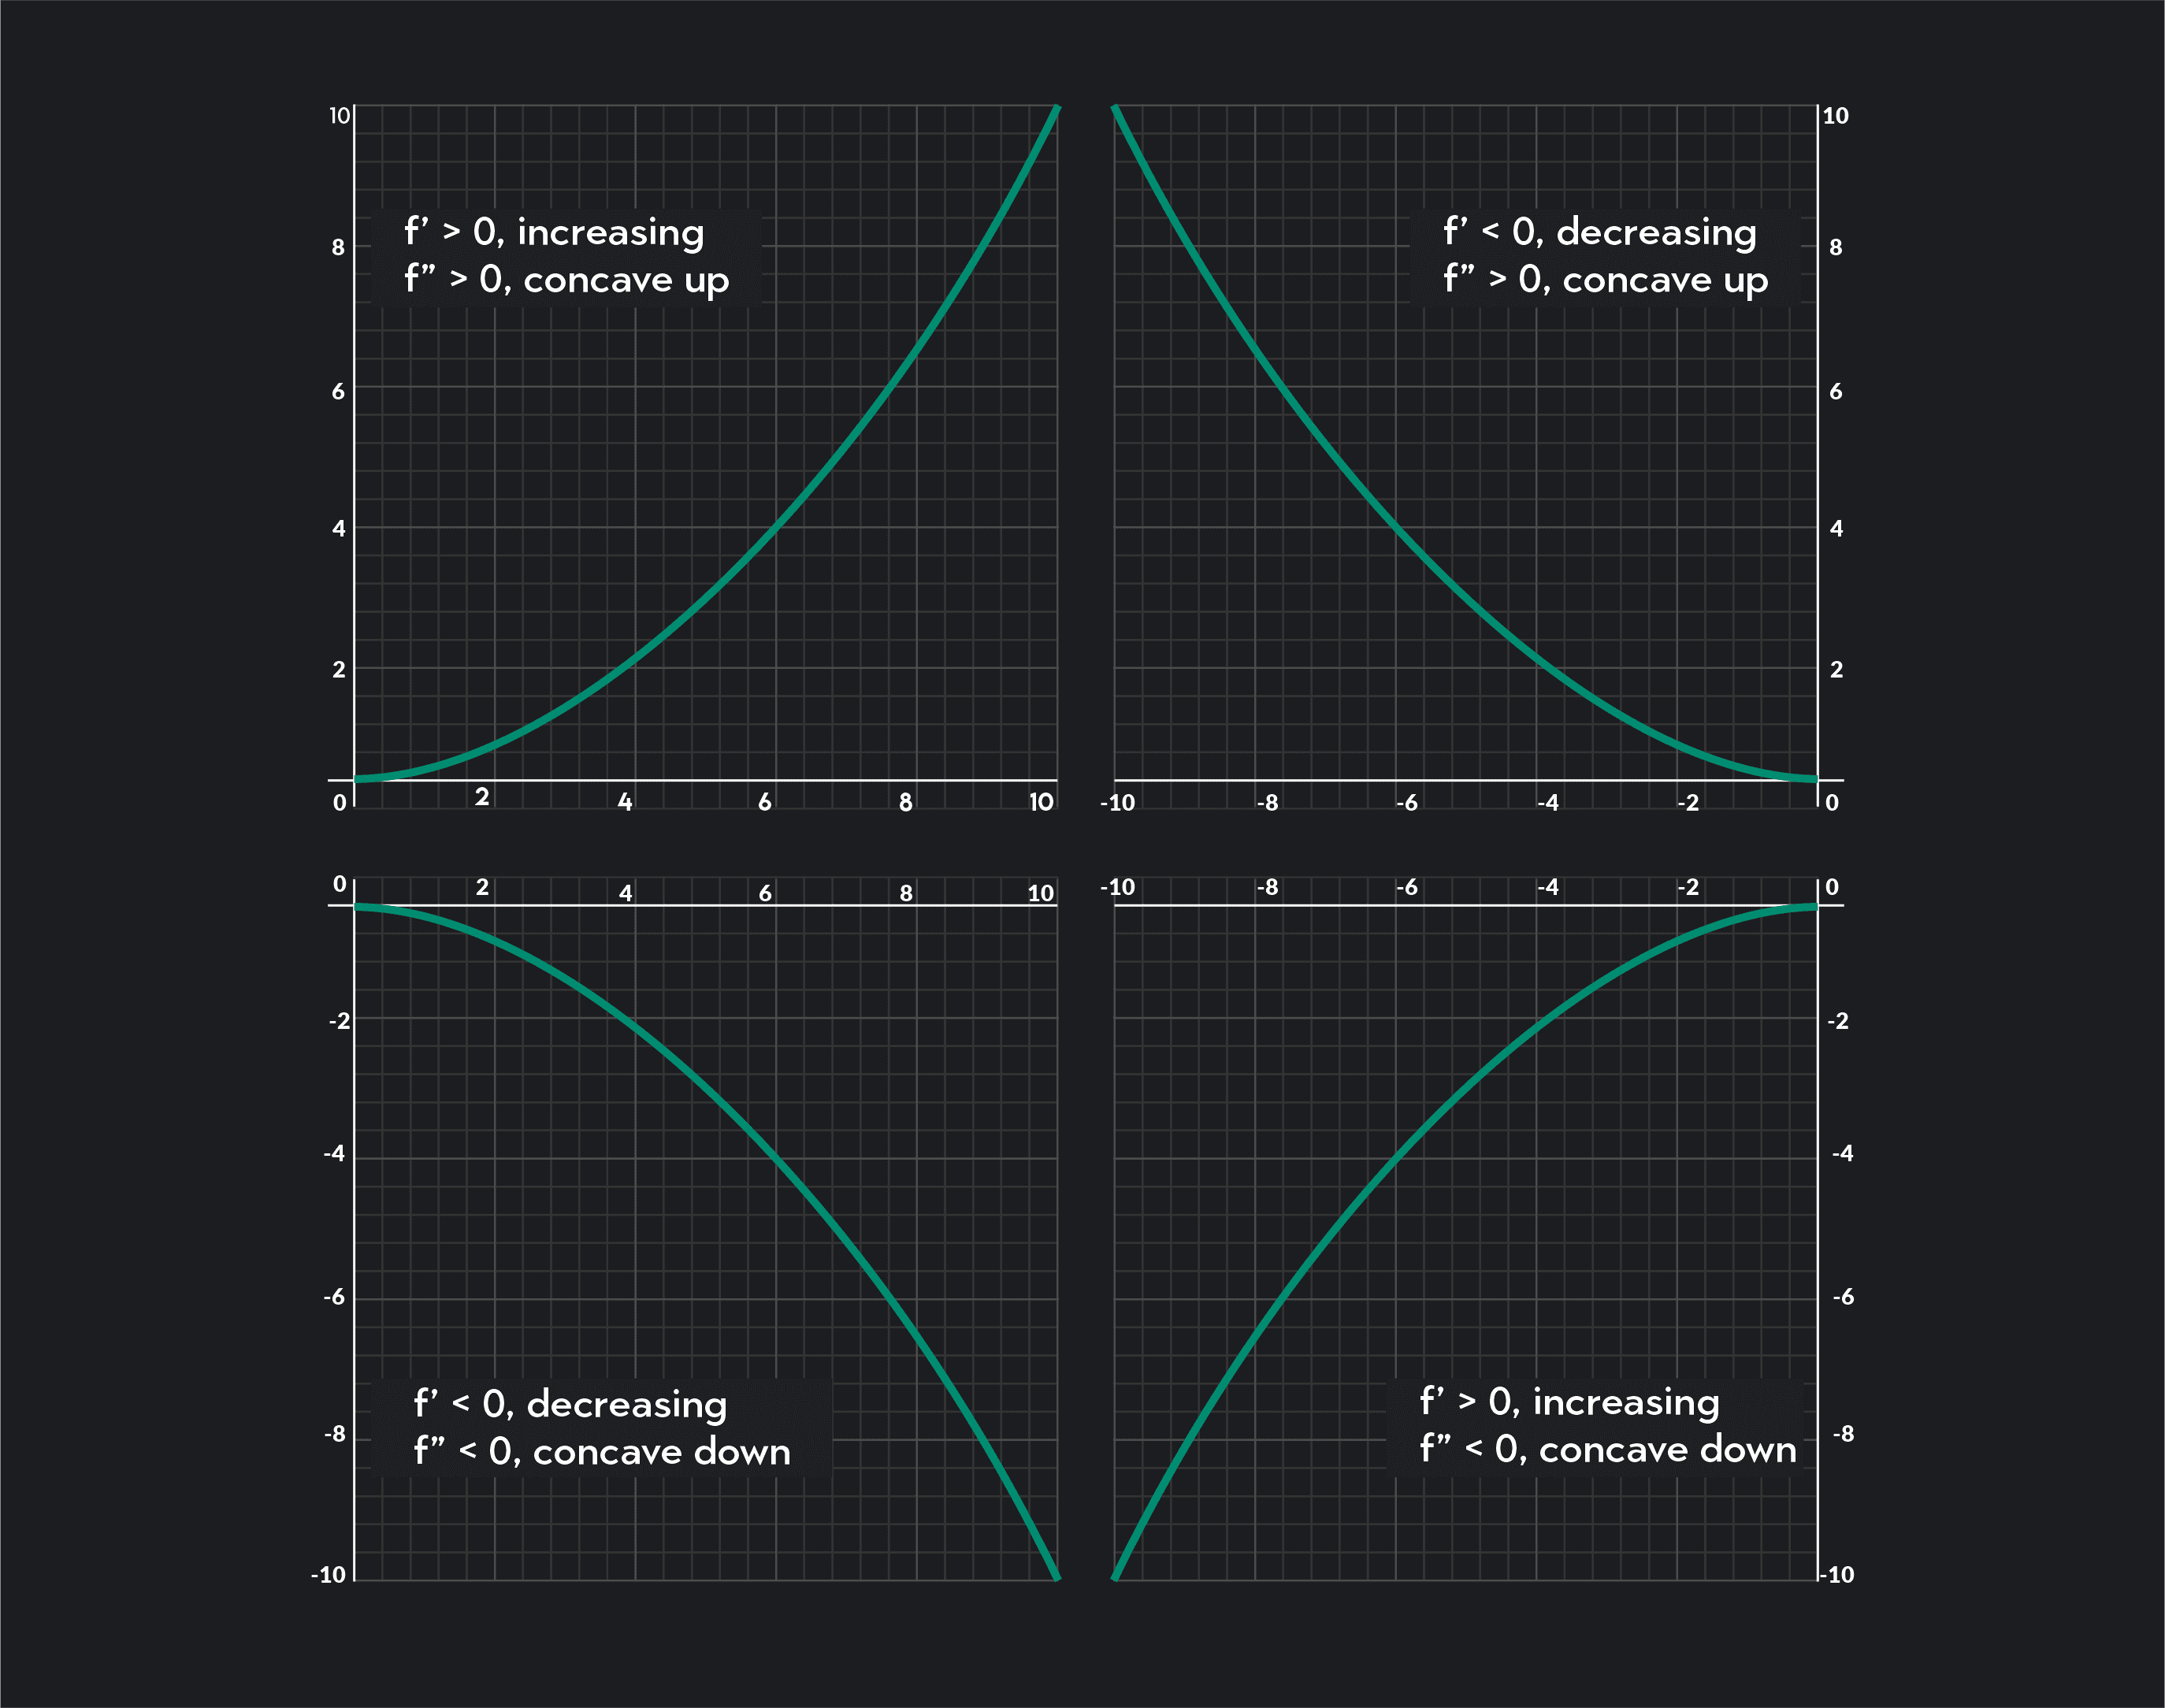
So, first derivatives tell us whether a function is increasing or decreasing, while second derivatives tell us whether a function is concave up or concave down. Both give us important information about the behavior of a function and can be combined in four different ways to generate four different types of curve behavior. They can be visualized on the graph of a function like this:
Dr. Hannah Fry explains more about derivative tests and concavity:
How To Find an Inflection Point on a Graph
Given a graph of the first derivative f’ of a function f, you can determine the points of inflection of f by identifying the intervals where f’ changes from increasing to decreasing.
Remember our rules from earlier, which we can shorten to say:
If f’ is increasing on I, then f is concave up on I.
If f’ is decreasing on I, then f is concave down on I.
If f’ is constant on I, then f has no concavity.
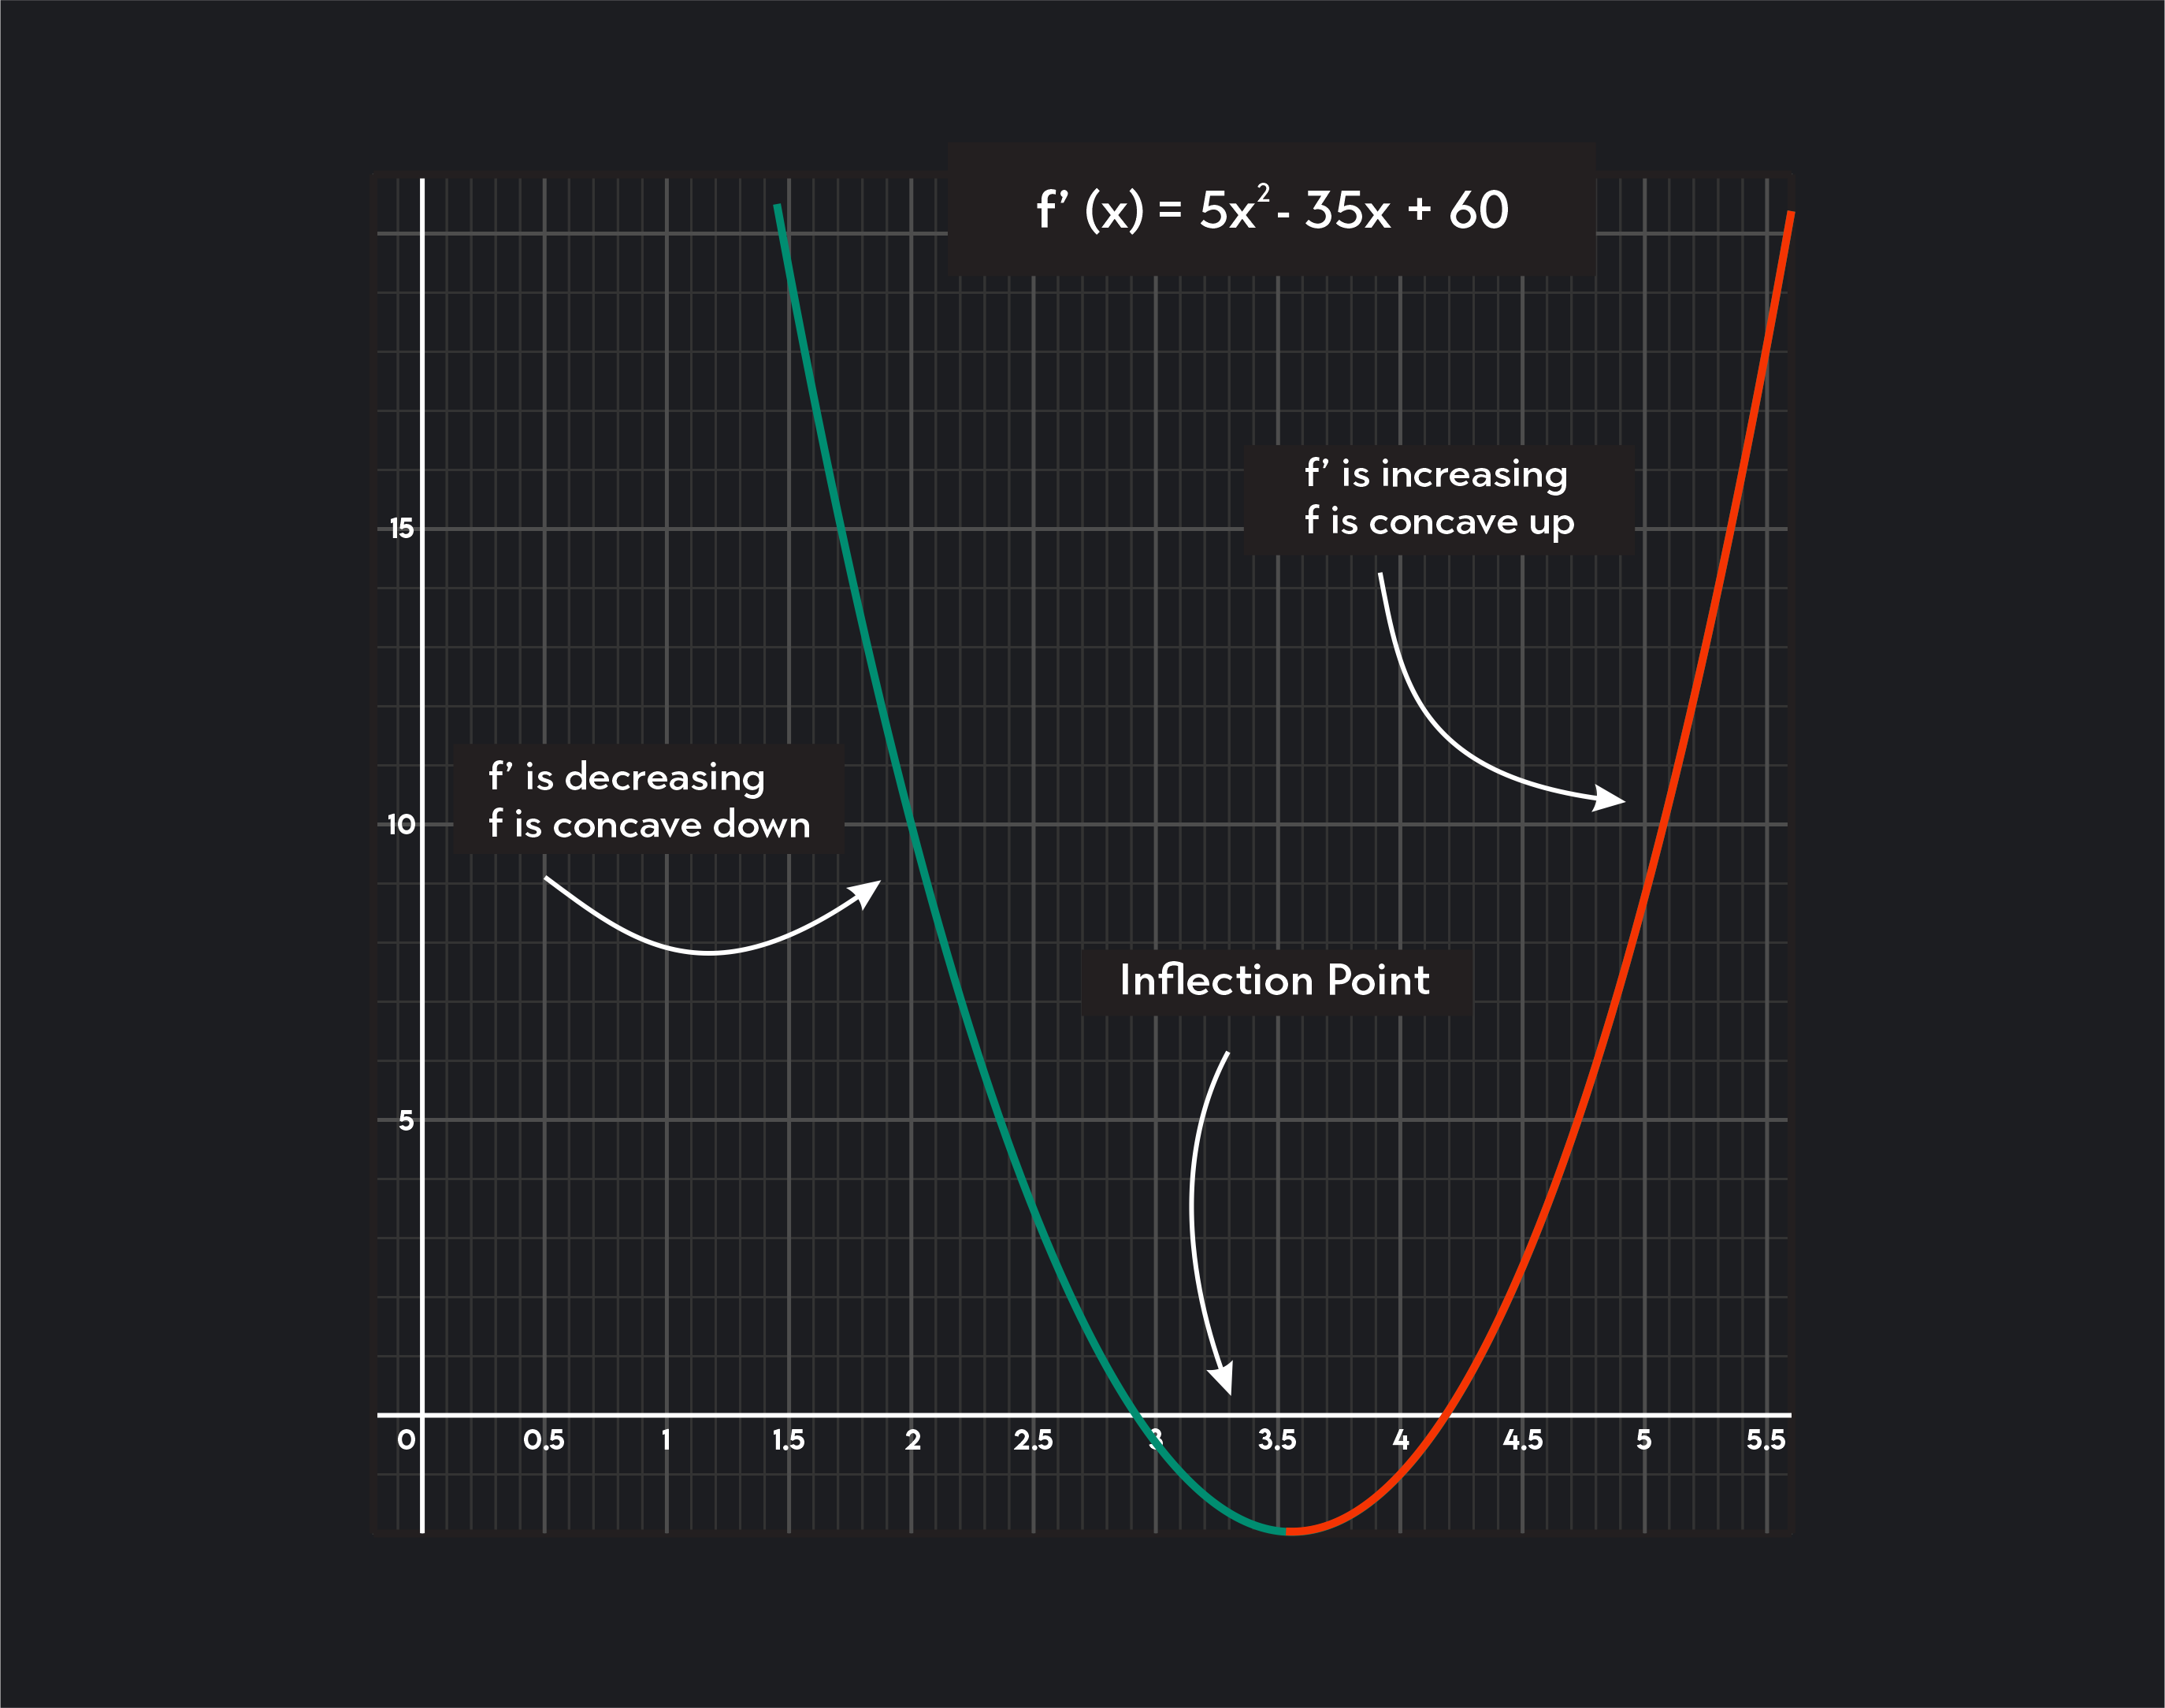
Consider the function f’(x)=5x2−35x+60. Notice that f’(x) is the first derivative of the function f(x)=35x3−235x2+60x. As long as we can visually determine the intervals where f’ changes from increasing to decreasing or from decreasing to increasing, we can determine the inflection points of f.
The graph tells us that f’ is decreasing on (∞,3.5) and increasing on (3.5,∞). Thus, f’ changes from decreasing to increasing at x=3.5. So, f has an inflection point at x=3.5.
We know this is true because f is concave down when f’ is decreasing and concave up when f’ is increasing. So, we can say that f is concave down on (−∞,3.5) and concave up on (3.5,∞). Thus, f must change concavity at x=3.5, and so there is an inflection point at x=3.5.
How To Find an Inflection Point in 5 Steps
We learned earlier that if f has an inflection point at x, then f’’(x)=0 or f’’(x) is undefined. Then, to find the inflection points of a function, you must identify every point where f’’(x)=0 or where f’’(x) is undefined.
The points above are not guaranteed to be inflection points, but they make up the list of possible inflection points.
You can use the 5 steps below to find the inflection points of a function:
Step 1
Differentiate f(x) to find f’(x). Then, differentiate f’(x) to find f’’(x).
Step 2
Find the x-values that make f’’(x)=0. This can often be done by factoring. Also determine the x-values where f’’(x) is undefined if any exist.
Step 3
Draw a number line, marking each x-value that was found in the step above.
Step 4
For each number marked on the line, choose one test x-value to the left and one test x-value to the right. After plugging these values into f’’(x), record whether the result is negative or positive in the corresponding spot in the table using a “+” or “-” sign.
Step 5
If a marked x-value x has opposite signs to the left and right, then there is an inflection point at x. If a marked x-value x has the same sign to the left and right, there is not an inflection point at x.
Finding Inflection Points Example
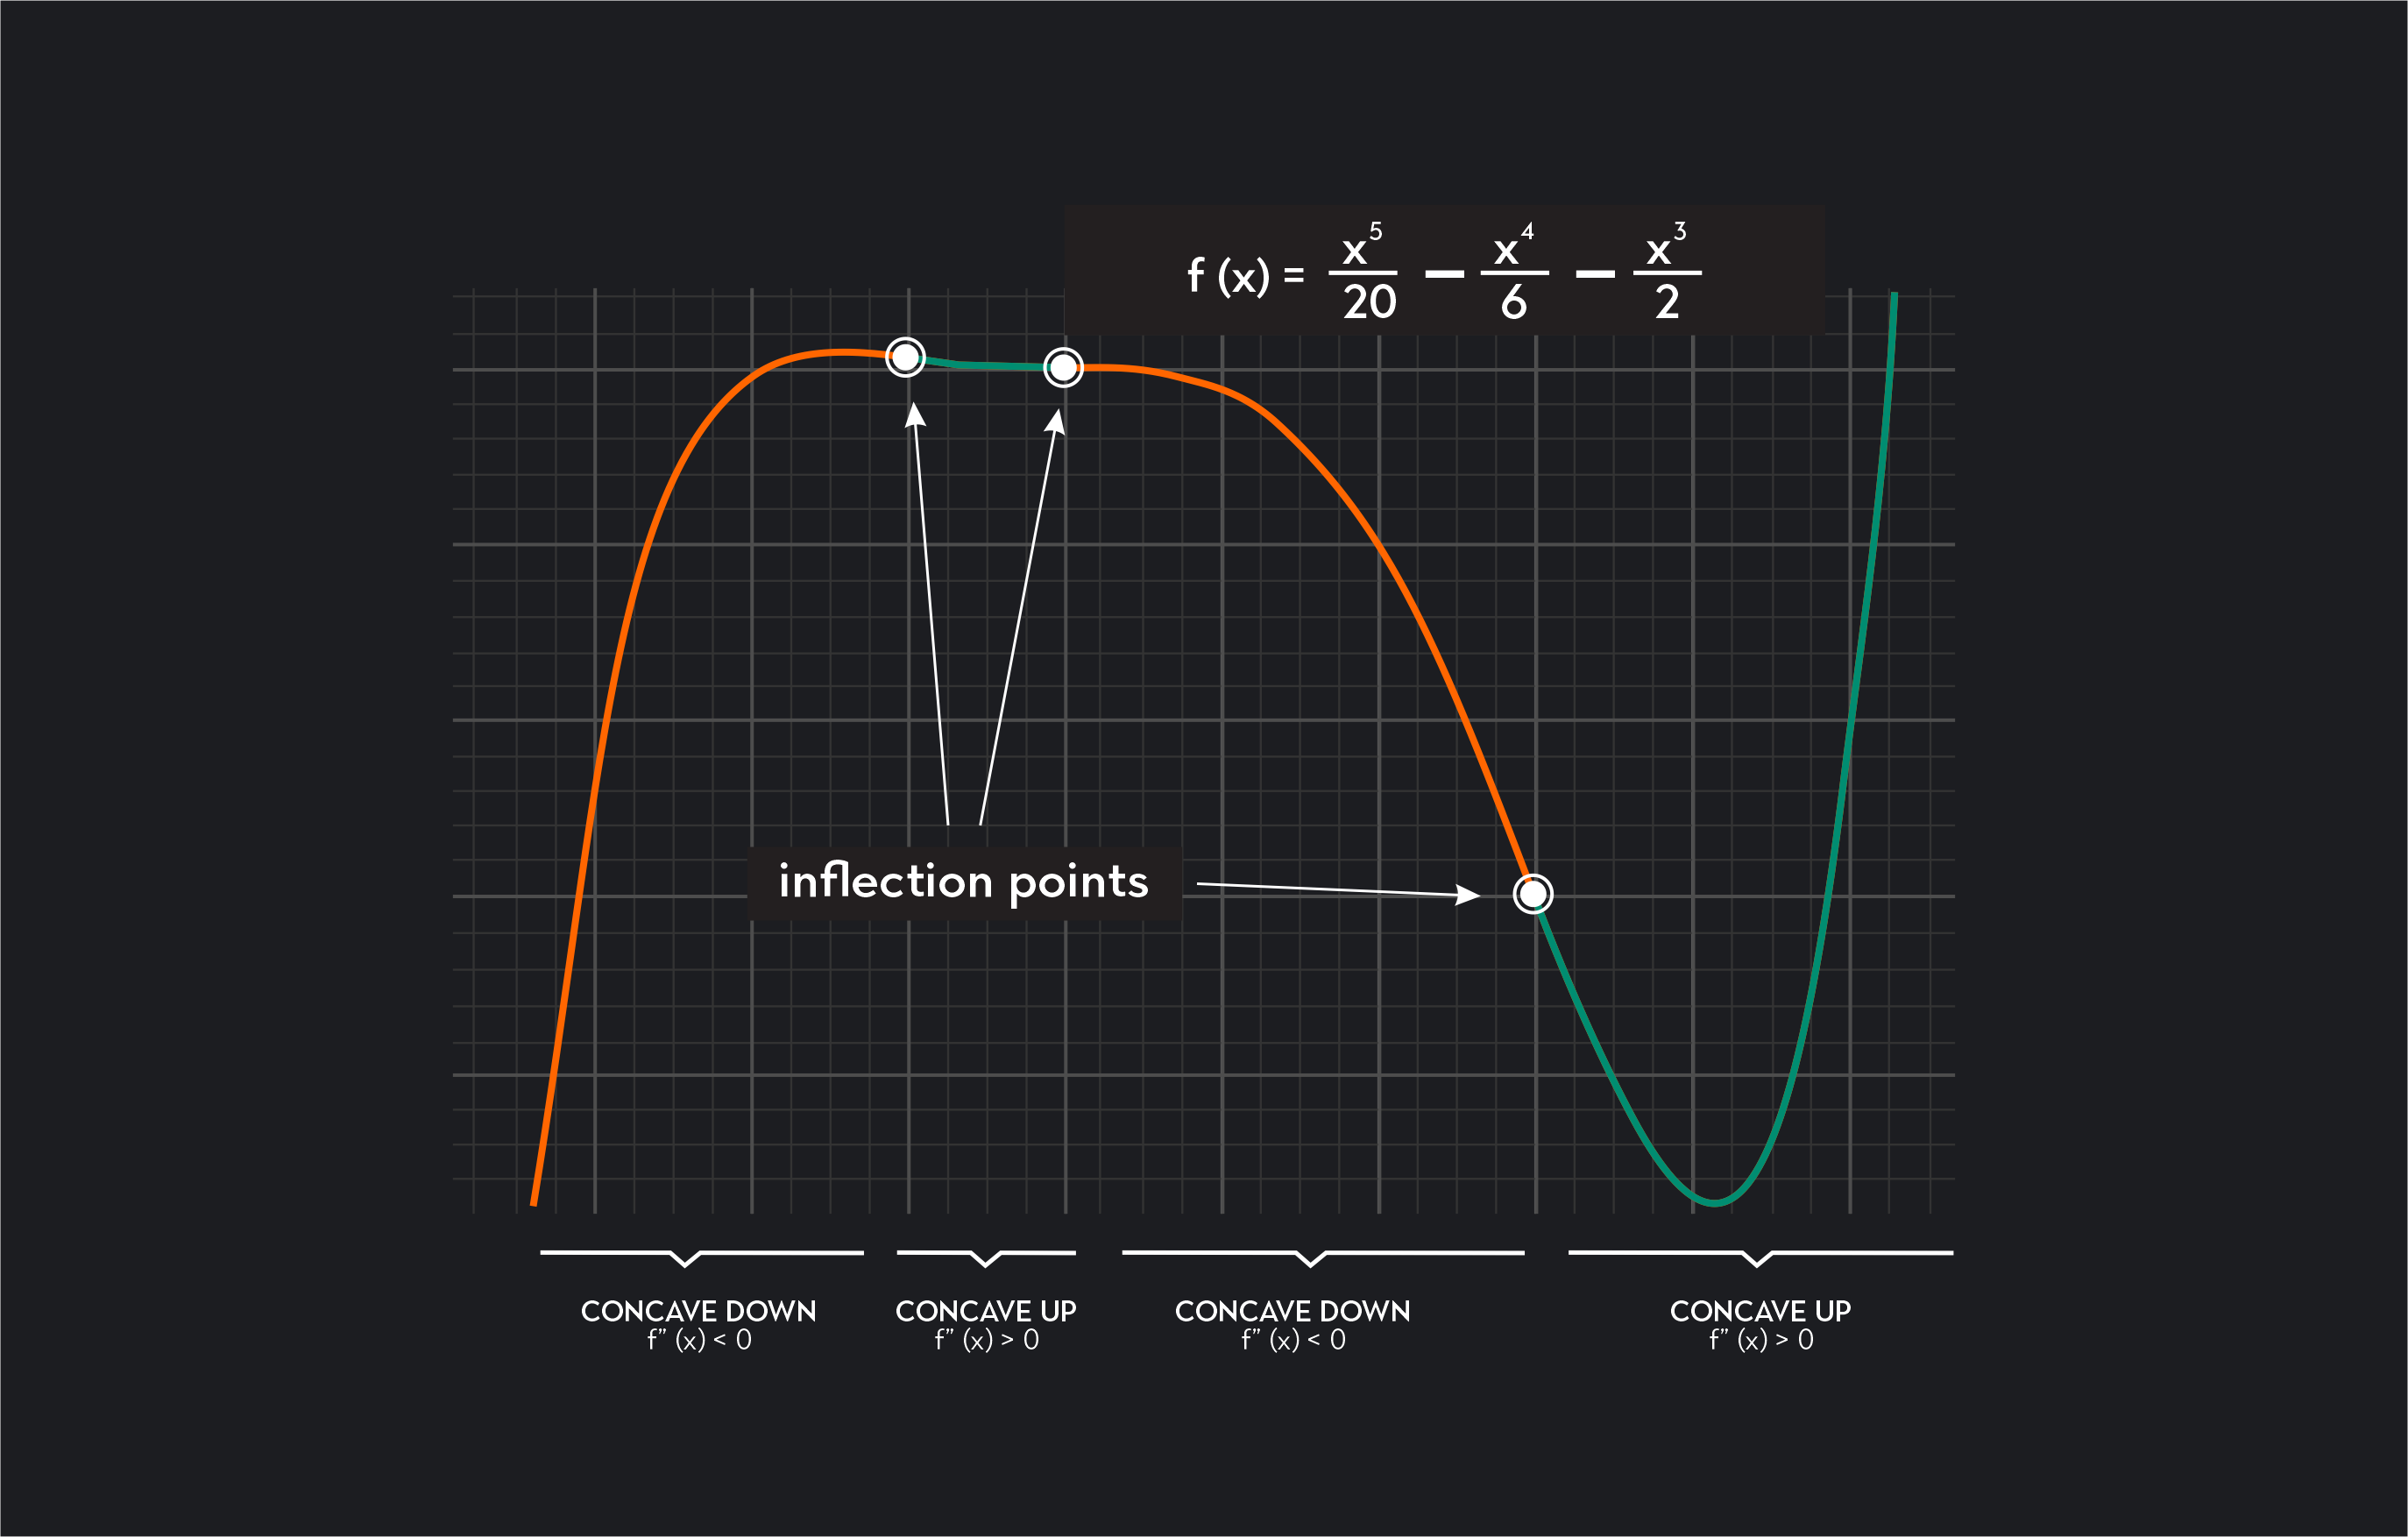
Let’s do an example together. Consider the polynomial function f(x)=20x5−6x4−2x3. Suppose we want to find its inflection points.
Step 1
If we differentiate f(x) using the power rule, we find that f’(x)=4x4−32x3−23x2. If we differentiate f’(x), we find that f’’(x)=x3−2x2−3x.
Step 2
We can factor the algebraic expression x3−2x2−3x to find that f’’(x)=(x−3)(x+1)x. Setting f’’(x) equal to zero, we find that f’’(x) has roots at x=3, x=−1, and x=0. These are our possible x-values at which f has an inflection point.
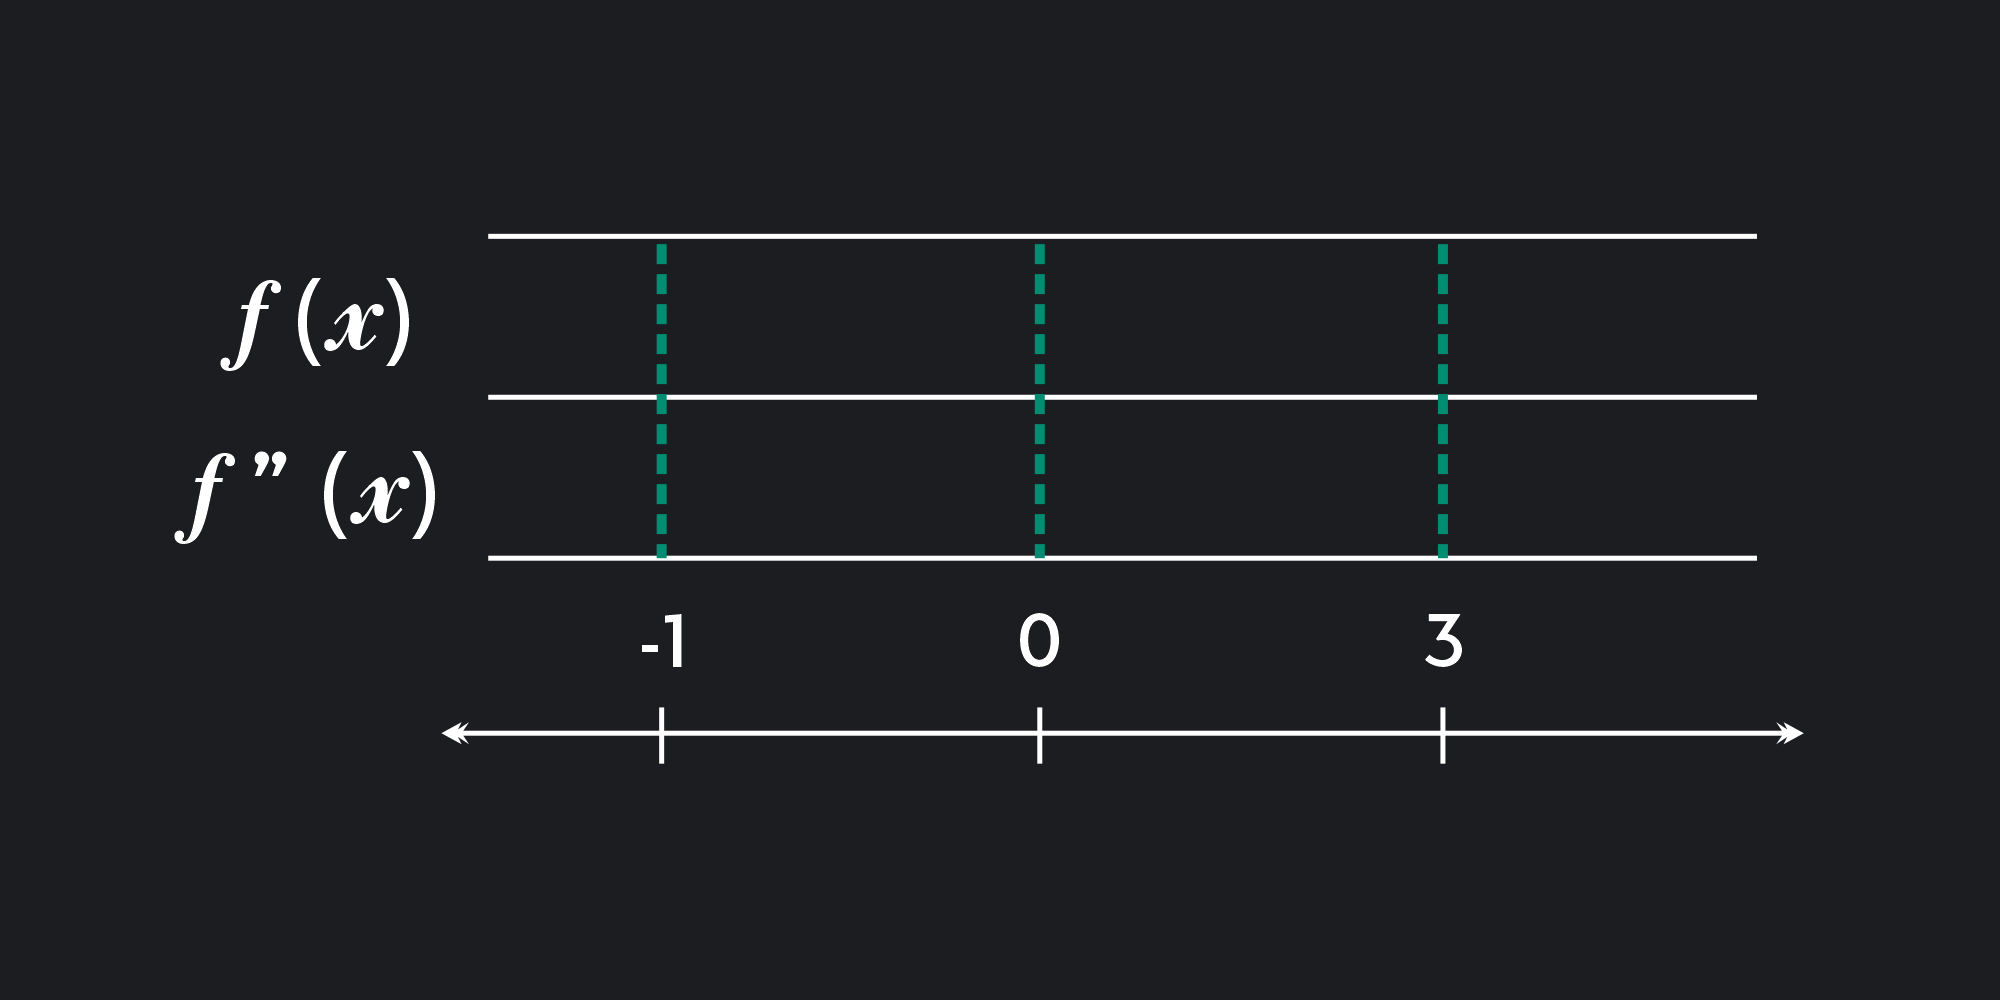
Step 3
Now we can create our empty table, which will look something like this.
Step 4
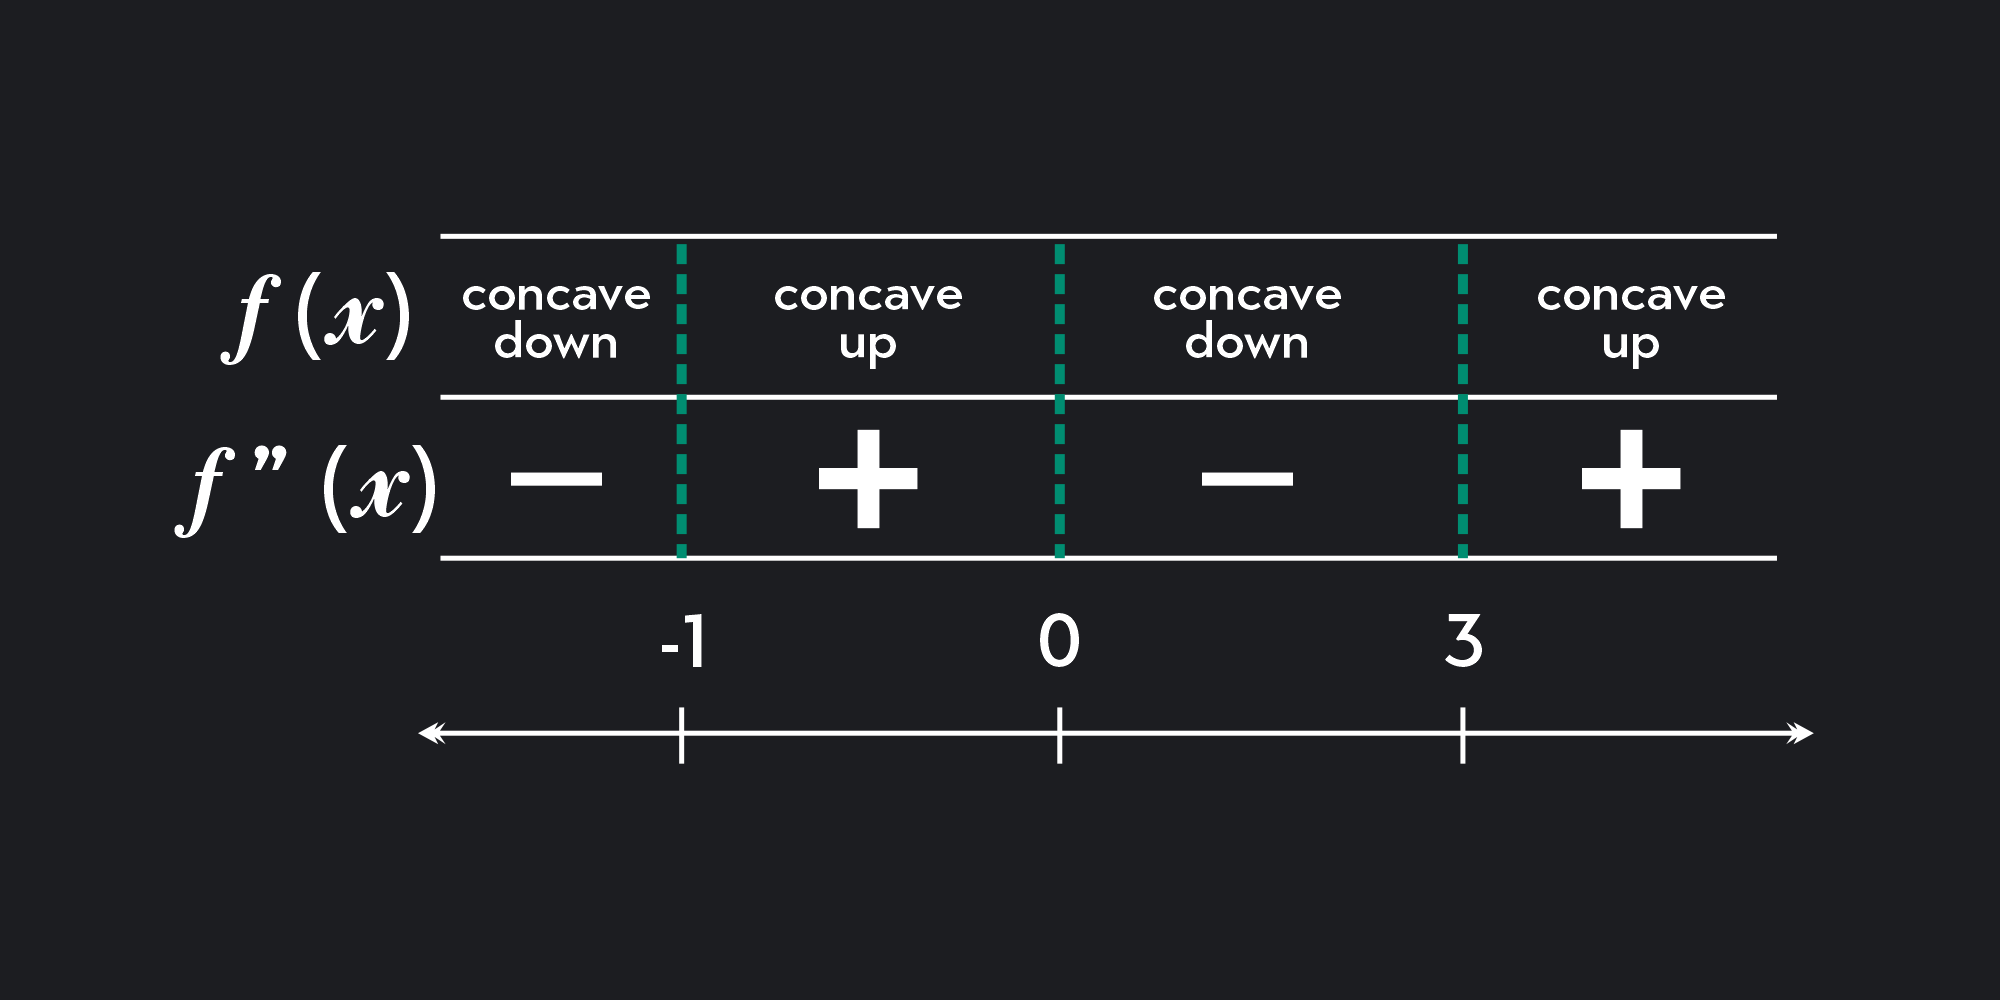
For our test value to the left of x = -1, let’s choose x = -2. Plugging this value into the second derivative, we find that f’’(-2) = -10. This means we can put a negative sign to the left of x = -1. Since f’’(x) < 0, we can say f is concave down on the interval (- \infty, -1).
For our test value to the right of x=−1, let’s choose x=2−1. Plugging this value into the second derivative, we find that f’’(2−1)=0.875. This means we can put a positive sign to the right of x=−1. Since f’’(x)>0, we can say that f is concave up on the interval (−1,0).
For our test value to the right of x = 0, let’s choose x = 1. Plugging this value into the second derivative, we find that f’’(1) = -4. This means we can put a negative sign to the right of x = 0. Since f’’(x) < 0, we can say that f is concave down on the interval (0, 3).
For our test value to the right of x=3, let’s choose x=4. Plugging this value into the second derivative, we find that f’’(4)=20. This means we can put a positive sign to the right of x=3. Since f’’(x)>0, we can say that f is concave up on the interval (3,∞).
Now our filled-in table looks something like this:
Step 5
Each of x=−1, x=0, and x=3 have opposite signs to their left and right. Thus, there is an inflection point at each of x=−1, x=0, and x=3.
In this example, we had inflection points at each of the roots we found. If a marked x-value on our number line instead had two positive signs or two negative signs on both sides, there would not be an inflection point there.
We can check that our answer is correct by looking at the graph of f. The orange lines indicate where f is concave down. The green lines indicate where f is concave up. The white arrows point to the inflection points where f changes concavity at x=−1, x=0, and x=3.
Outlier (from the co-founder of MasterClass) has brought together some of the world's best instructors, game designers, and filmmakers to create the future of online college.