From the co-founder of MasterClass, earn transferable college credits from the University of Pittsburgh (a top 50 global school). The world's best online college courses for 50% less than a traditional college.
When starting out in statistics, you need to understand a few distinctions. They are the differences between a parameter and a statistic, qualitative and quantitative data, and discrete and continuous variables.
In this article, we’ll cover the difference between a parameter and a statistic.
What Is a Parameter?
In statistics, a parameter is any measurement that describes a population. A population is the entire group of people or objects you are studying.
Here are some examples of parameters:
The average life expectancy of Americans
The standard deviation of heights of players in the NBA
The proportion of tickets that go unsold during a tennis tournament
In each of these examples, the measurements—the average, the standard deviation, and the proportion—are all parameters that help describe some aspect of a population. The populations in these examples are the entire American population, the entire group of players in the NBA, and tickets that went on sale for a tennis tournament.
When estimating parameters, we can use confidence intervals.
Confidence intervals are like fishing with a net.
By calculating a range of values from a sample, we can estimate how likely it is to contain the true population parameter at any level of confidence:
Many similarities exist between confidence intervals and hypothesis tests. In fact, hypothesis tests and confidence intervals are closely related. Often, confidence intervals are actually constructed by starting with hypothesis tests.
With hypothesis testing, we can determine a parameter's value and draw conclusions about it:
What Is a Statistic?
A statistic is any measurement that describes a characteristic of a sample. A sample is a subset drawn from a population.
Here are some examples of statistics:
The average height of a sample of 100 ten-year-old red spruce trees planted as a part of a reforestation effort
The variance in commuting times of a sample of 750 commuters working in Manhattan
The median age of a sample of 2,000 nurses working in the United States
In these examples, the measurements—average, variance, and median—are all statistics that describe some aspect of a sample.
The samples in these examples were:
100 ten-year-old red spruce trees
750 commuters
2,000 nurses working in the U.S.
These samples are all drawn from larger populations:
All the 10-year-old spruces planted in the reforestation effort
The population of all commuters working in Manhattan
Parameters are fixed numerical values for populations, while statistics estimate parameters using sample data. Both are key in data analysis, with parameters as true values and statistics derived for population inferences.
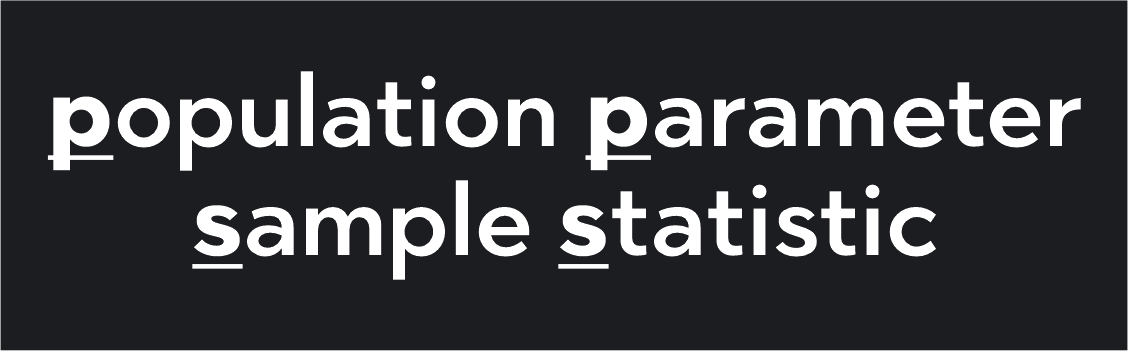
The key difference between parameters and statistics is that parameters describe populations, while statistics describe samples. You can easily remember this distinction using the alliterations for population, parameter, and sample statistic.
Why We Need Statistics
If you are dealing with a small population, gathering data and calculating population parameters is easy. However, if you are trying to study a large population or an elusive population, it can be difficult, or even impossible, to gather data for the whole population.
Since gathering data for an entire population is often impossible, statisticians collect sample data and estimate population parameters using sample statistics. This process of drawing inferences about a population from a sample is called statistical inference—or inferential statistics—and it is a major part of statistical analysis.
For an example of statistical inference, imagine you are studying the average commute times for people commuting to New York City for work. Millions of people work in New York City, so you couldn’t possibly ask every commuter what their commute times were. Instead, you would ask a subset of commuters (a sample) what their commute times were, calculate a sample average, and estimate the population average using your statistic.
Keep in mind that for statistical inference to work, you need to have a randomized and representative sample—a sample that closely resembles the population. If you only look at a portion of the population with short commute times, then the sample average you calculate will not resemble the population parameter. In any introduction to a statistics course, you’ll learn about different sampling methods that can ensure a sample is representative.
How Statistics Get Reported
More often than not, when statistics get reported in the media, they are reported as if they were parameters.
Here’s a good example: “62% of Americans are pessimistic about the future state of the economy.”
This is a statement from a news outlet, which is based on polling data. Polls are an example of statistical inference. No way exists to ask all Americans how they feel about the economy. Instead, pollsters ask a random sample of Americans how they feel. So, 62% is a sample proportion—a statistic. It is not a population proportion—a parameter.
An accurate headline should have read: “62% of a random sample of Americans were pessimistic about the future state of the economy,” but that headline is not as punchy or engaging. When you come across a reported figure—and you’re unsure whether the figure is a parameter or statistic—ask yourself whether someone could have reasonably collected data for the entire population or whether it is more likely that the data is from a sample.
Statistic vs Parameter Symbols
To differentiate between measurements that are parameters versus statistics, use the following notation.
MEASUREMENT
PARAMETER NOTATION
STATISTIC NOTATION
Mean
μ
xˉ
Variance
σ2
s2
Standard Deviation
σ
s
Population size or sample size
N
n
Proportion
P
p
Correlation coefficient
ρ
r
Regression coefficient
β
b
The notation for parameters often uses uppercase or Greek letters, while the notation for statistics is often lowercase or Roman letters.
More Parameter and Statistic Examples
Here are more examples of parameters and statistics. See if you can identify the measurement and the population/sample in each example.
Parameters:
The range of ages in a ballet company
The mode of daily visits to a website
The proportion of current NFL players who have experienced a serious concussion
Statistics:
The mean (or average) income for a sample of American journalists
The median square footage of one hundred 3-bedroom homes listed for sale in Austin, Texas
The standard deviation of weights for 500 tuna caught in the Mediterranean
Test Your Understanding
Now that you know what statistics and parameters are, test your knowledge with these five questions. When answering these questions, consider whether it is reasonable to assume that a statistician had access to data for the entire population being studied.
Questions
A high school teacher reports that her class's average score on a final exam was 72. Is this figure a parameter or a statistic?
A news outlet reports, "2 out of every 5 American households own a dog.” Is this figure a parameter or a statistic?
A researcher is trying to study how wearable technology and physical fitness monitors impact the number of steps people take each week. Will the researcher be working with population data and parameters or a sample data set and statistics?
What is the notation for a sample mean?
What is the notation for a population mean?
What is the notation for a sample standard deviation?
What is the notation for a population standard deviation?
Answers
Parameter. The population, in this case, is the teacher's class and the teacher has data for the entire population. The average is a measure of the population, not of a sample.
Statistic. There is no available asking every American household whether or not they own a dog. This figure is a statistic based on sample data. It is being used to estimate a population parameter.
Sample data and statistics. There is no way for the researcher to gather data on every person who uses a fitness tracker. Instead, the researcher will use inferential statistics, randomly sampling a group of fitness tracker users and basing her research on a sample data set.
xˉ. The notation used for a sample mean is x-bar.
𝞵. The notation used for a population mean is the Greek letter mu.
s. The notation used for a sample standard deviation is the lowercase letter s.
σ. The notation used for a population standard deviation is the Greek letter sigma.
Outlier (from the co-founder of MasterClass) has brought together some of the world's best instructors, game designers, and filmmakers to create the future of online college.