
Statistics
What Do Subsets Mean in Statistics?
This article explains what subsets are in statistics and why they are important. You’ll learn about different types of subsets with formulas and examples for each.
Sarah Thomas
Subject Matter Expert
Statistics
02.03.2022 • 17 min read
Subject Matter Expert
This article is about what probability is, its definition, and the formula. You’ll also learn how to calculate it.
In This Article
Probability is the study of likelihood. How likely is it to rain tomorrow? What are the chances that you’ll be dealt a pocket pair in a poker game? What is the likelihood of earning a living as a concert pianist? These are all questions that probability can help answer.
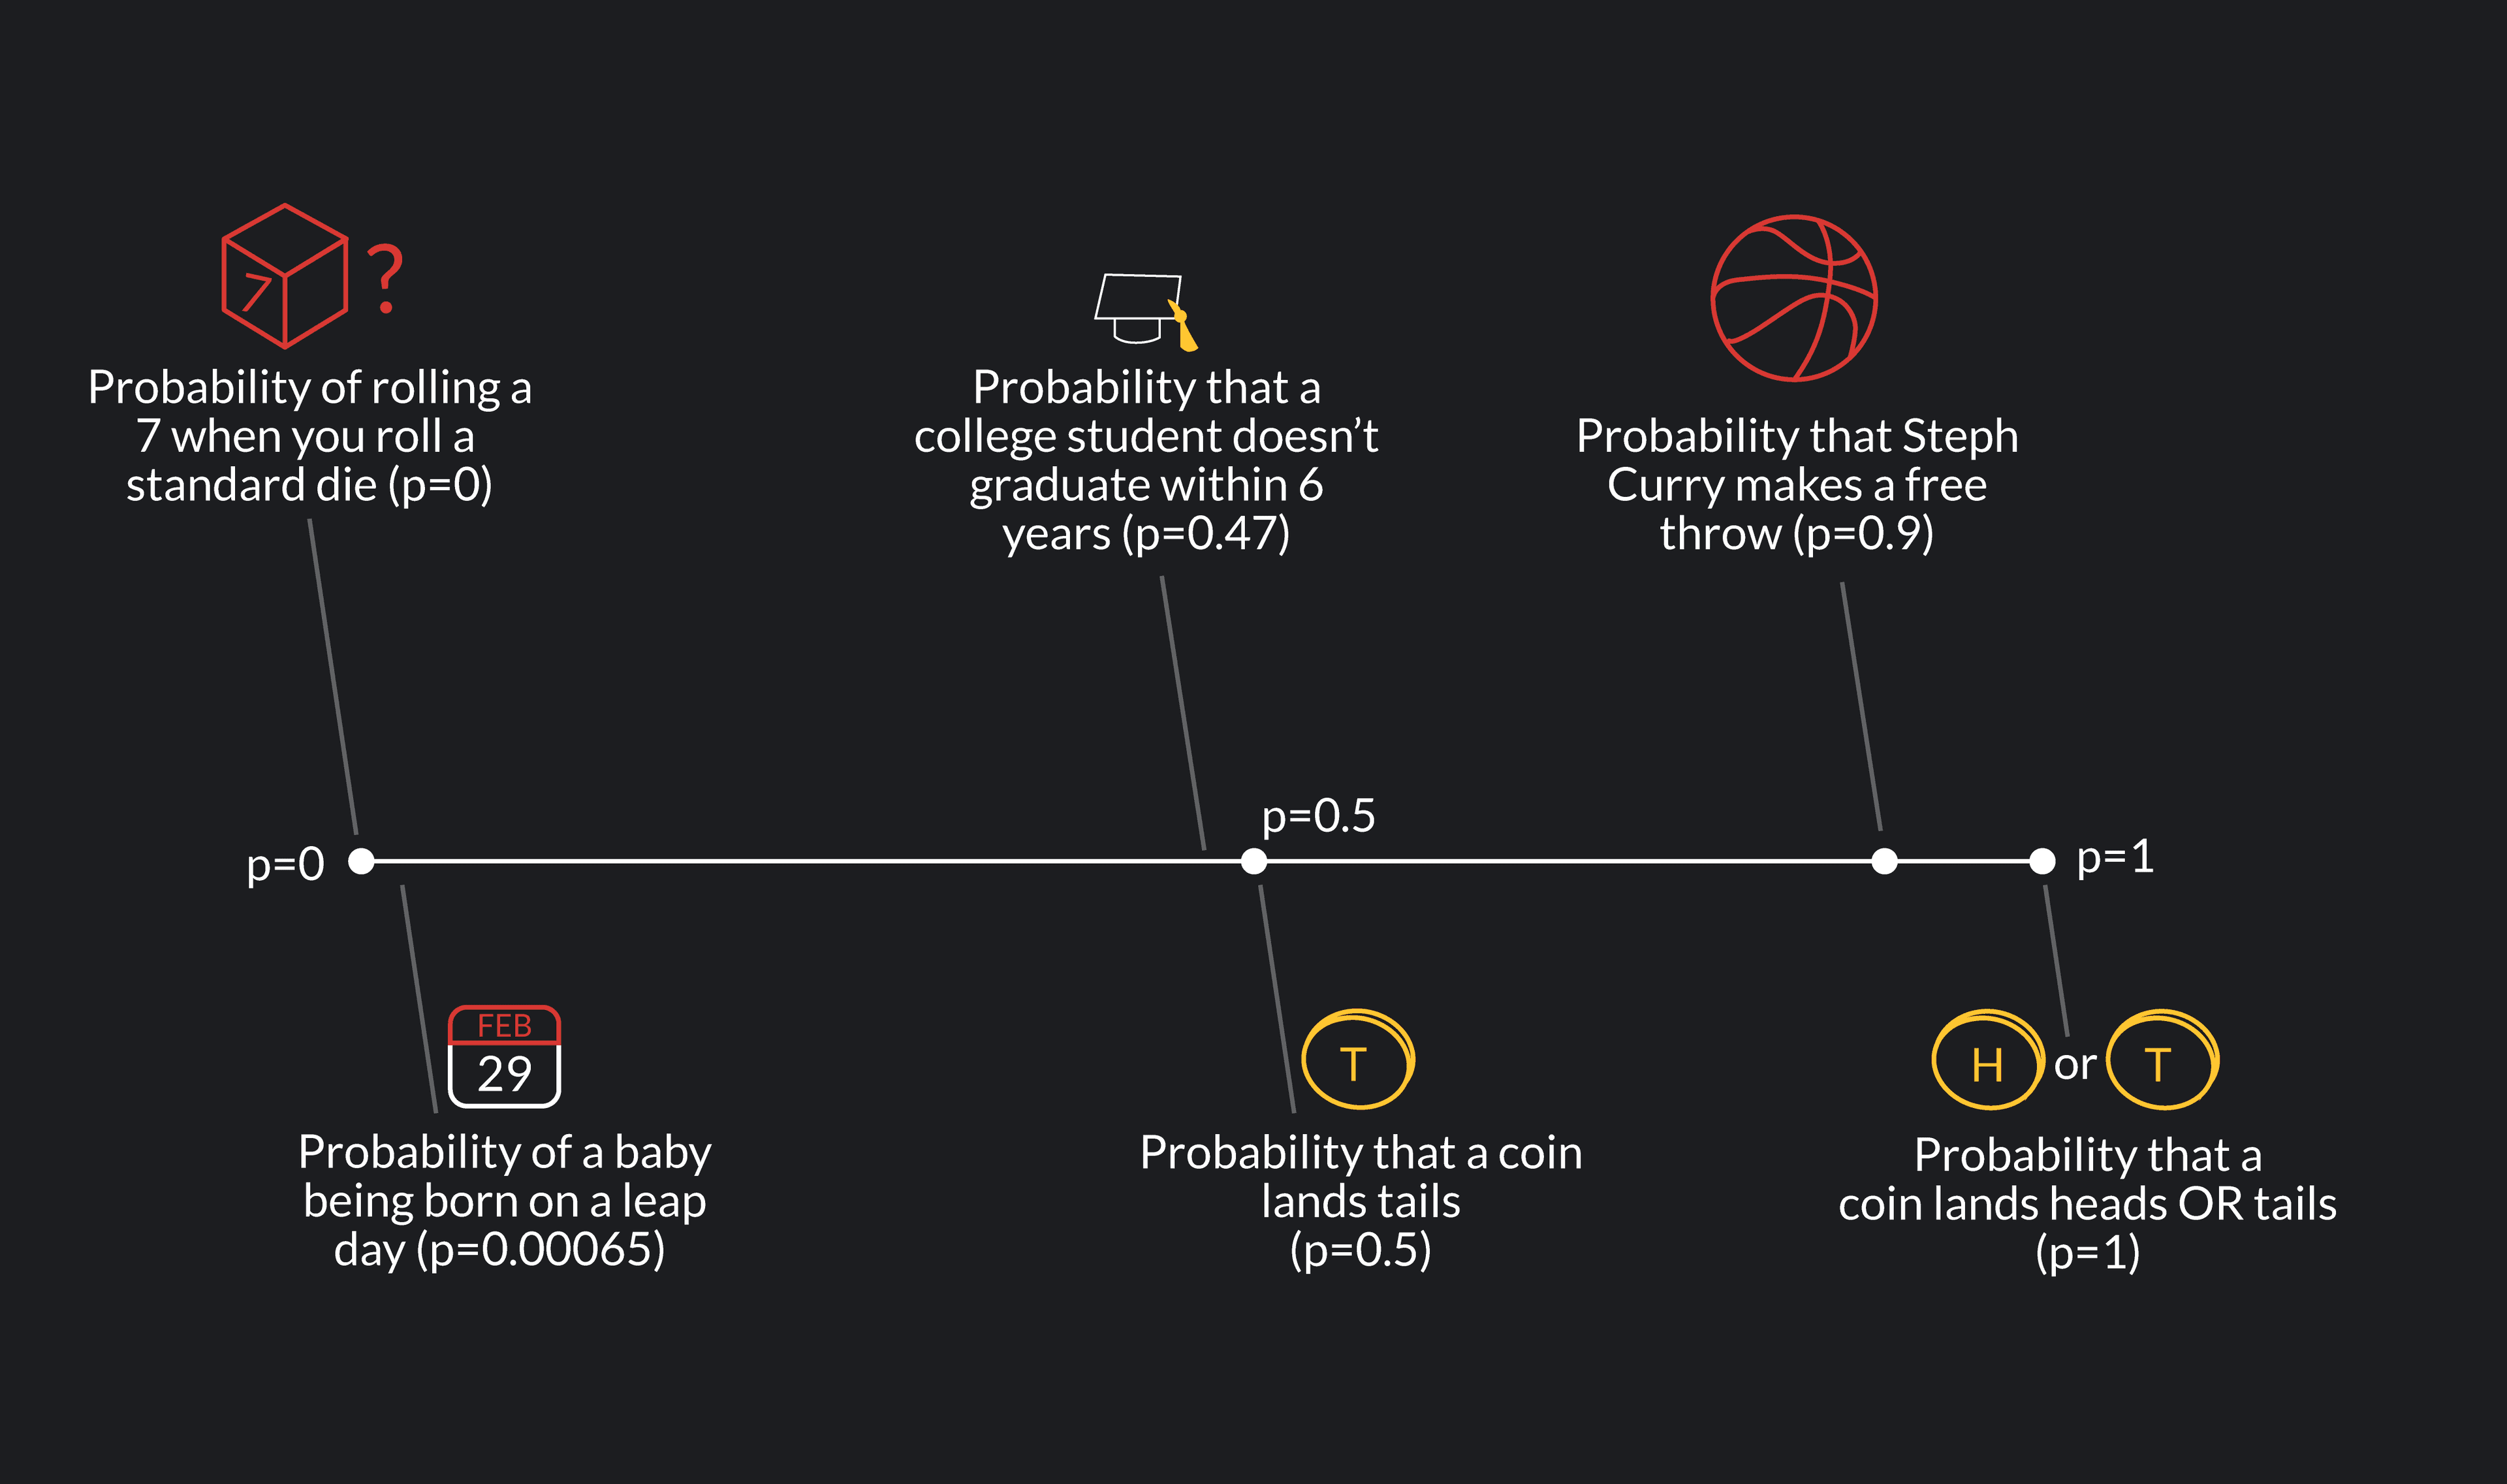
We measure probability on a scale from 0 to 1, where 0 and 1 both represent certainty.
A probability of 0 indicates that an event will definitely not happen, while a probability of 1 indicates that the event definitely will happen.
Very few things in life happen with certainty though. Most events and statements about the world involve some degree of uncertainty or randomness. Uncertain events have probabilities that fall somewhere between 0 and 1. The closer a probability is to 0, the less likely it is to occur. The closer a probability is to 1, the more likely it is to occur.
Here are three things to know about expressing probabilities:
We can express probabilities using decimals, percentages, or fractions.
You can easily convert a probability from a decimal to a fraction by placing the decimal over its place value (0.2 = or 0.02 = .
You can convert a probability from a decimal to a percentage by multiplying the decimal by 100 (0.2 x 100 = 20%).
The probability of getting heads on a coin flip = 0.5 =or ½ = 50%
The probability that Steph Curry makes a free throw = 0.9 == 90%
You can use the word “chance” interchangeably with “probability.”
There’s a 40% chance of rain tomorrow = There’s a 40% probability of rain tomorrow.
You cannot use the word “odds” interchangeably with “probability.”
Odds and probability are related concepts, but they are different. We calculate odds by taking the ratio of two probabilities: the probability that an event will occur and the probability that it will not occur. Careful not to confuse probabilities with odds.
The probability that Steph Curry makes a free throw = 0.9
The odds of Steph Curry making a free throw = 0.9/0.1 or 9:1
Below are some basic terms you should know before working with probabilities.
A random experiment is a process that you can repeat over and over again, where you cannot predict the outcome with certainty. Every repetition of the experiment should follow the exact same conditions and have an identical set of possible outcomes. When you run repeatedly a random experiment, each repetition is called a trial.
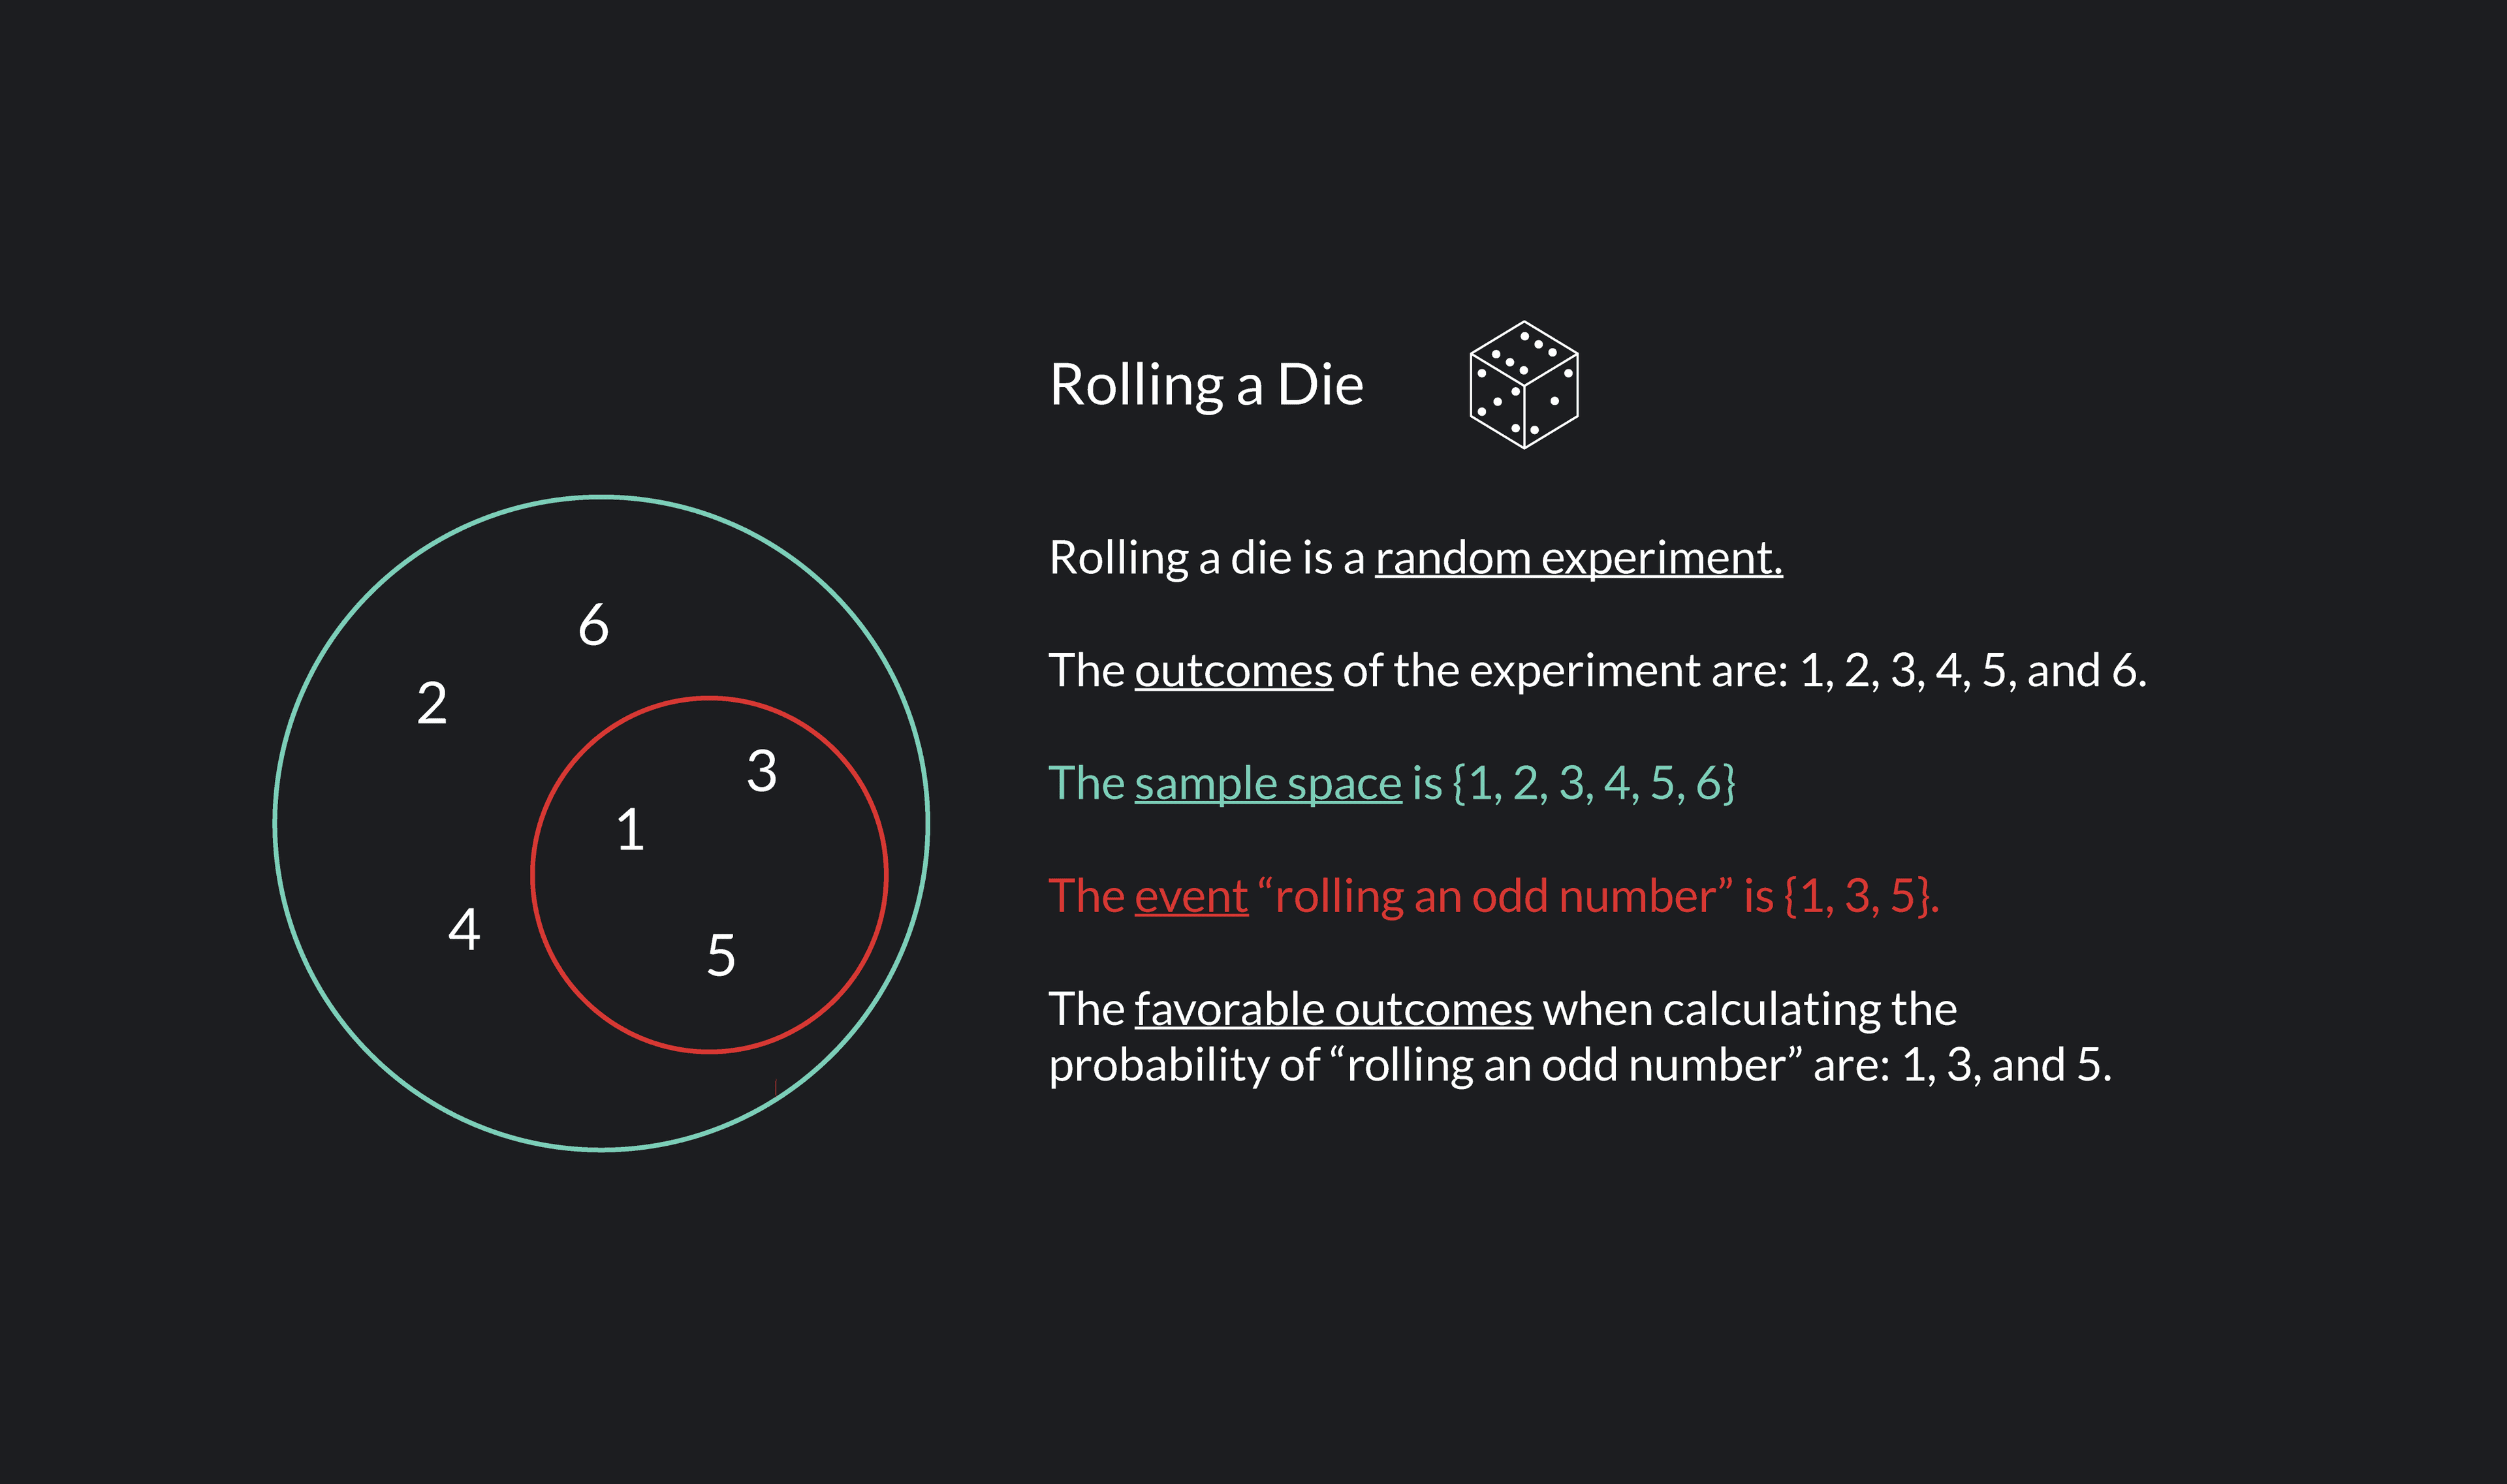
Rolling a die or flipping a coin are good examples of random experiments. Rolling a die is a process that you can repeat over and over again, and so is flipping a coin. Each time you roll a die, there are six possible outcomes, and the outcomes are uncertain — you could roll a 1, 2, 3, 4, 5, or 6. Each time you flip a coin, there are two possible outcomes, and the outcomes are uncertain — you could flip heads or tails.
Outcomes are the results of a random experiment. Outcomes are mutually exclusive, meaning you can only observe one outcome at a time.
There are six possible outcomes when you roll a die: 1, 2, 3, 4, 5, and 6. These outcomes are mutually exclusive because you cannot roll a 1 at the same time that you roll a 6. For every roll, you only observe one of the six outcomes.
The sample space is the set of all possible outcomes. We usually denote a sample space using set notation (i.e., curly brackets {}) or a Venn diagram.
The sample space when rolling a single die is {1, 2, 3, 4, 5, 6}. Similarly, the sample space when shooting a free throw is {make it, miss it}.
Favorable outcomes are the outcomes in the sample space that you collectively want to calculate a probability for.
If you want to calculate the probability of rolling a 2 when you roll a die, there is only one favorable outcome, 2. If you want to calculate the probability of rolling an even number, there are three favorable outcomes: 2, 4, and 6. If you want to calculate the probability of rolling a number less than 6, there are five favorable outcomes: 1, 2, 3, 4, and 5.
An event is a subset of the sample space to which you can assign a probability. As is the case for sample spaces, we often denote events using set notation (i.e., curly brackets {}) or a Venn diagram.
In an experiment where you roll a die, “rolling a 5” is an event, “rolling an even number” is an event, “rolling an odd number” is an event, and so on.
When drawing a card from a deck of playing cards, an event is:
Drawing a face card
Drawing a red card
Drawing a seven of diamonds or a seven of hearts
In math, the probabilities that are easiest to calculate involve experiments where there are a number of distinct and equally likely outcomes.
In such cases, calculating the probability of events is easy! You simply count the number of favorable outcomes and divide it by the total number of possible outcomes.
Probability of an Event =
As it turns out, many probabilistic situations involve equally likely outcomes, so this formula is incredibly useful for calculating probabilities.
Coin flips, rolling dice, and drawing cards are examples of random experiments where the possible outcomes are equally likely. This means we can apply the probability formula.
Below are some examples and practice problems of how you can apply the probability equation to flipping a coin, rolling a die, and drawing cards from a deck.
When flipping a coin, there are two equally likely outcomes, so the sample space (the set of all possible outcomes) is:
Using the probability formula, we can find the probability of the event “getting tails”. The number of favorable outcomes associated with this event is 1, and the total number of possible outcomes is 2.
P(T) = Probability coin lands on tails = = ½ or 0.5
The same goes for finding the probability of getting heads.
P(H) = Probability coin lands on heads = = ½ or 0.5
Using the probability formula, see if you can find the probability of getting heads or tails on a coin flip. Scroll to the bottom of this article to see the correct answer.
When rolling a die, there are six equally likely outcomes, so the sample space is:
Using the probability formula, let’s find the probability of rolling a number that is less than 3. The only numbers on a die that are less than 3 are 1 and 2, so the probability of rolling a number that is less than 3 is the same thing as the probability of rolling a 1 or a 2.
P(1 or 2) = Probability of rolling a number less than 3 = = or 0.3333
Using the probability formula, see if you can find the probability of rolling an odd number. Scroll to the bottom of this article to see the correct answer
Now let’s think about drawing a single card from a deck of playing cards. You are equally likely to draw any one of the cards in the deck; all possible outcomes are equally likely. There are 52 cards in the deck, so there are 52 possible outcomes in the sample space.
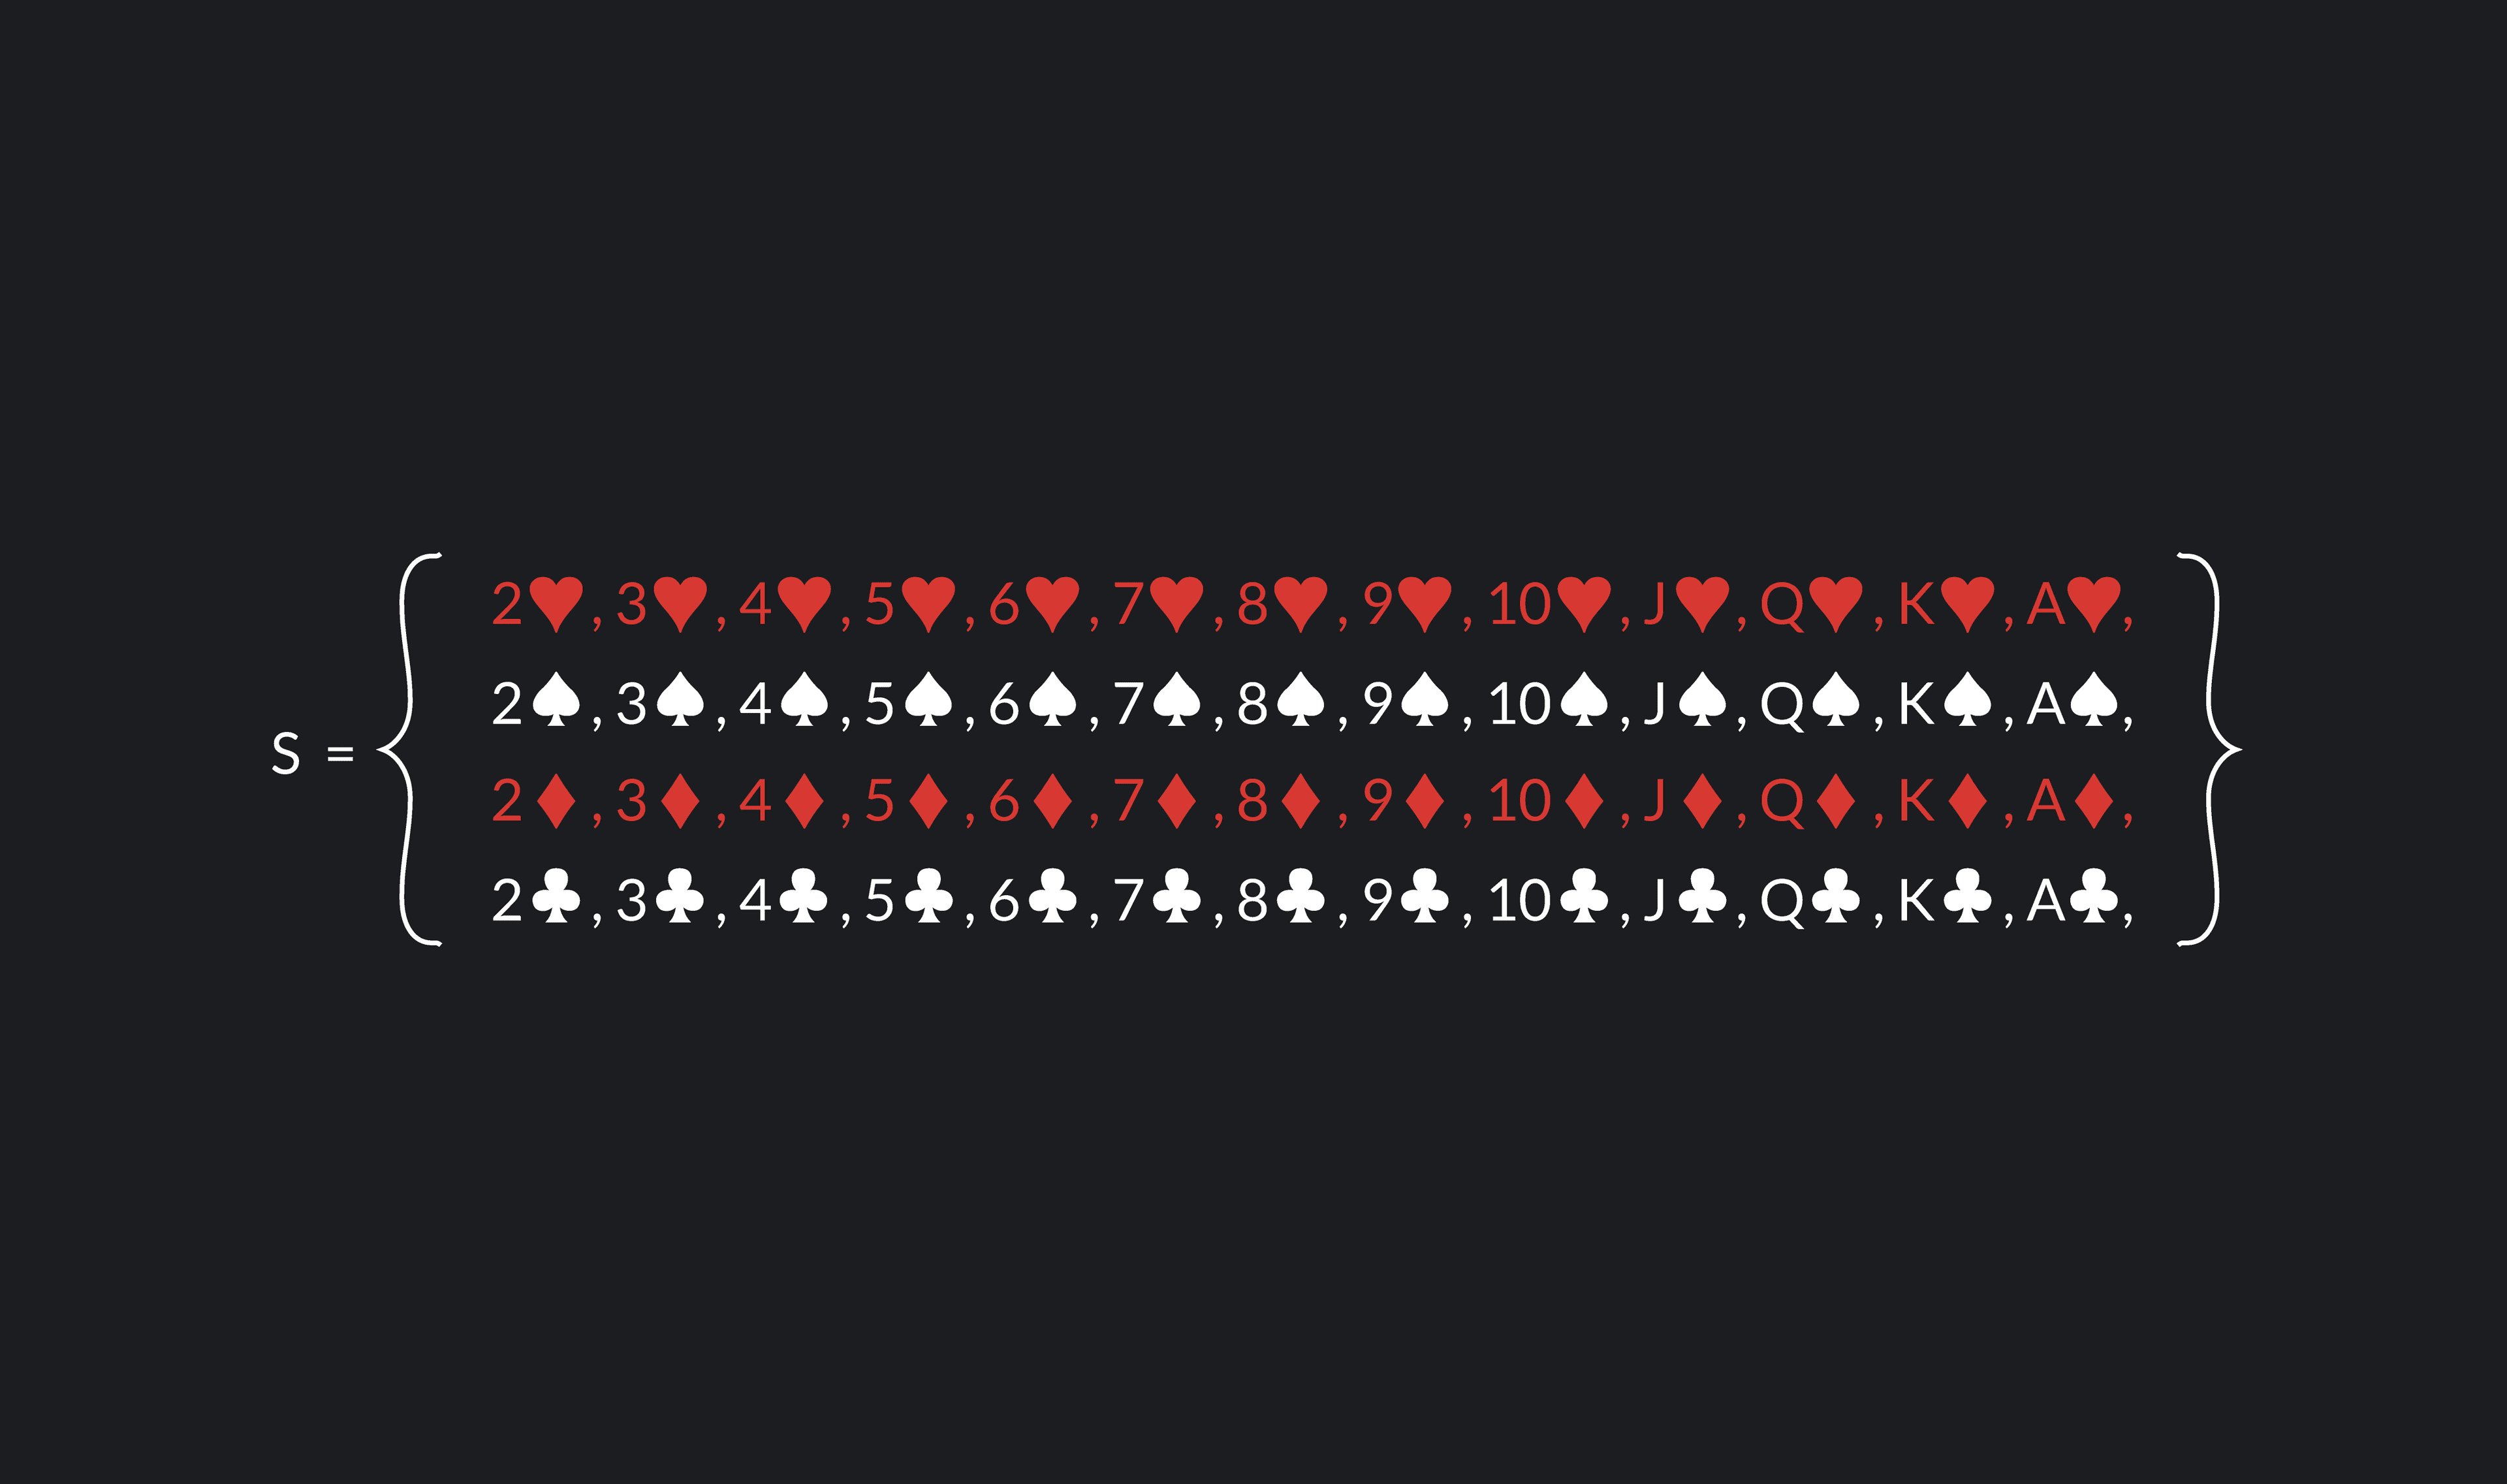
Given the sample space, what is the probability of drawing the 2 of hearts? Since there is only one 2 of hearts in the entire deck, the number of favorable outcomes is 1.
As we determined already, the total number of possible outcomes is 52.
P(2♥) = = 0.019
How about the probability of drawing a 2 regardless of the suit? In this case, there are four 2s in the deck, so there are 4 favorable outcomes.
P(2) = = 0.019
What is the probability of drawing a diamond? If you count the diamonds in the sample space, you’ll see that there are 13 cards in the deck that are diamonds.
P(♦) = = ¼ = 0.25
What is the probability of drawing a diamond or a spade? There are 13 diamonds in the deck and 13 spades in the deck. So there are a total of 26 favorable outcomes for this event.
P(♦ or ♠ ) == ½ = 0.5
To test yourself, see if you can find the following probabilities and scroll down to the bottom of this article to see if you are correct.
What is the probability of drawing a black card?
What is the probability of drawing a face card (a jack, queen, or king)?
What is the probability of drawing a spade, heart, or diamond?
You can apply the probability formula with greater ease and to a wider range of problems if you learn the following theorems.
The formula for the addition rule is:
The addition rule says that the probability of Event A or Event B happening is equal to the probability of Event A plus the probability of Event B minus the probability of the intersection of A and B.
One way to describe the relationship between events is to use the term intersection, one of four common set operation examples.
The intersection of A and B consists of the outcomes that are included in both Event A and Event B. The intersection of two events is denoted by the word “and” or with the symbol ⋂.
An easy way to demonstrate the addition rule is to return to our deck of cards.
Recall that the sample space is:
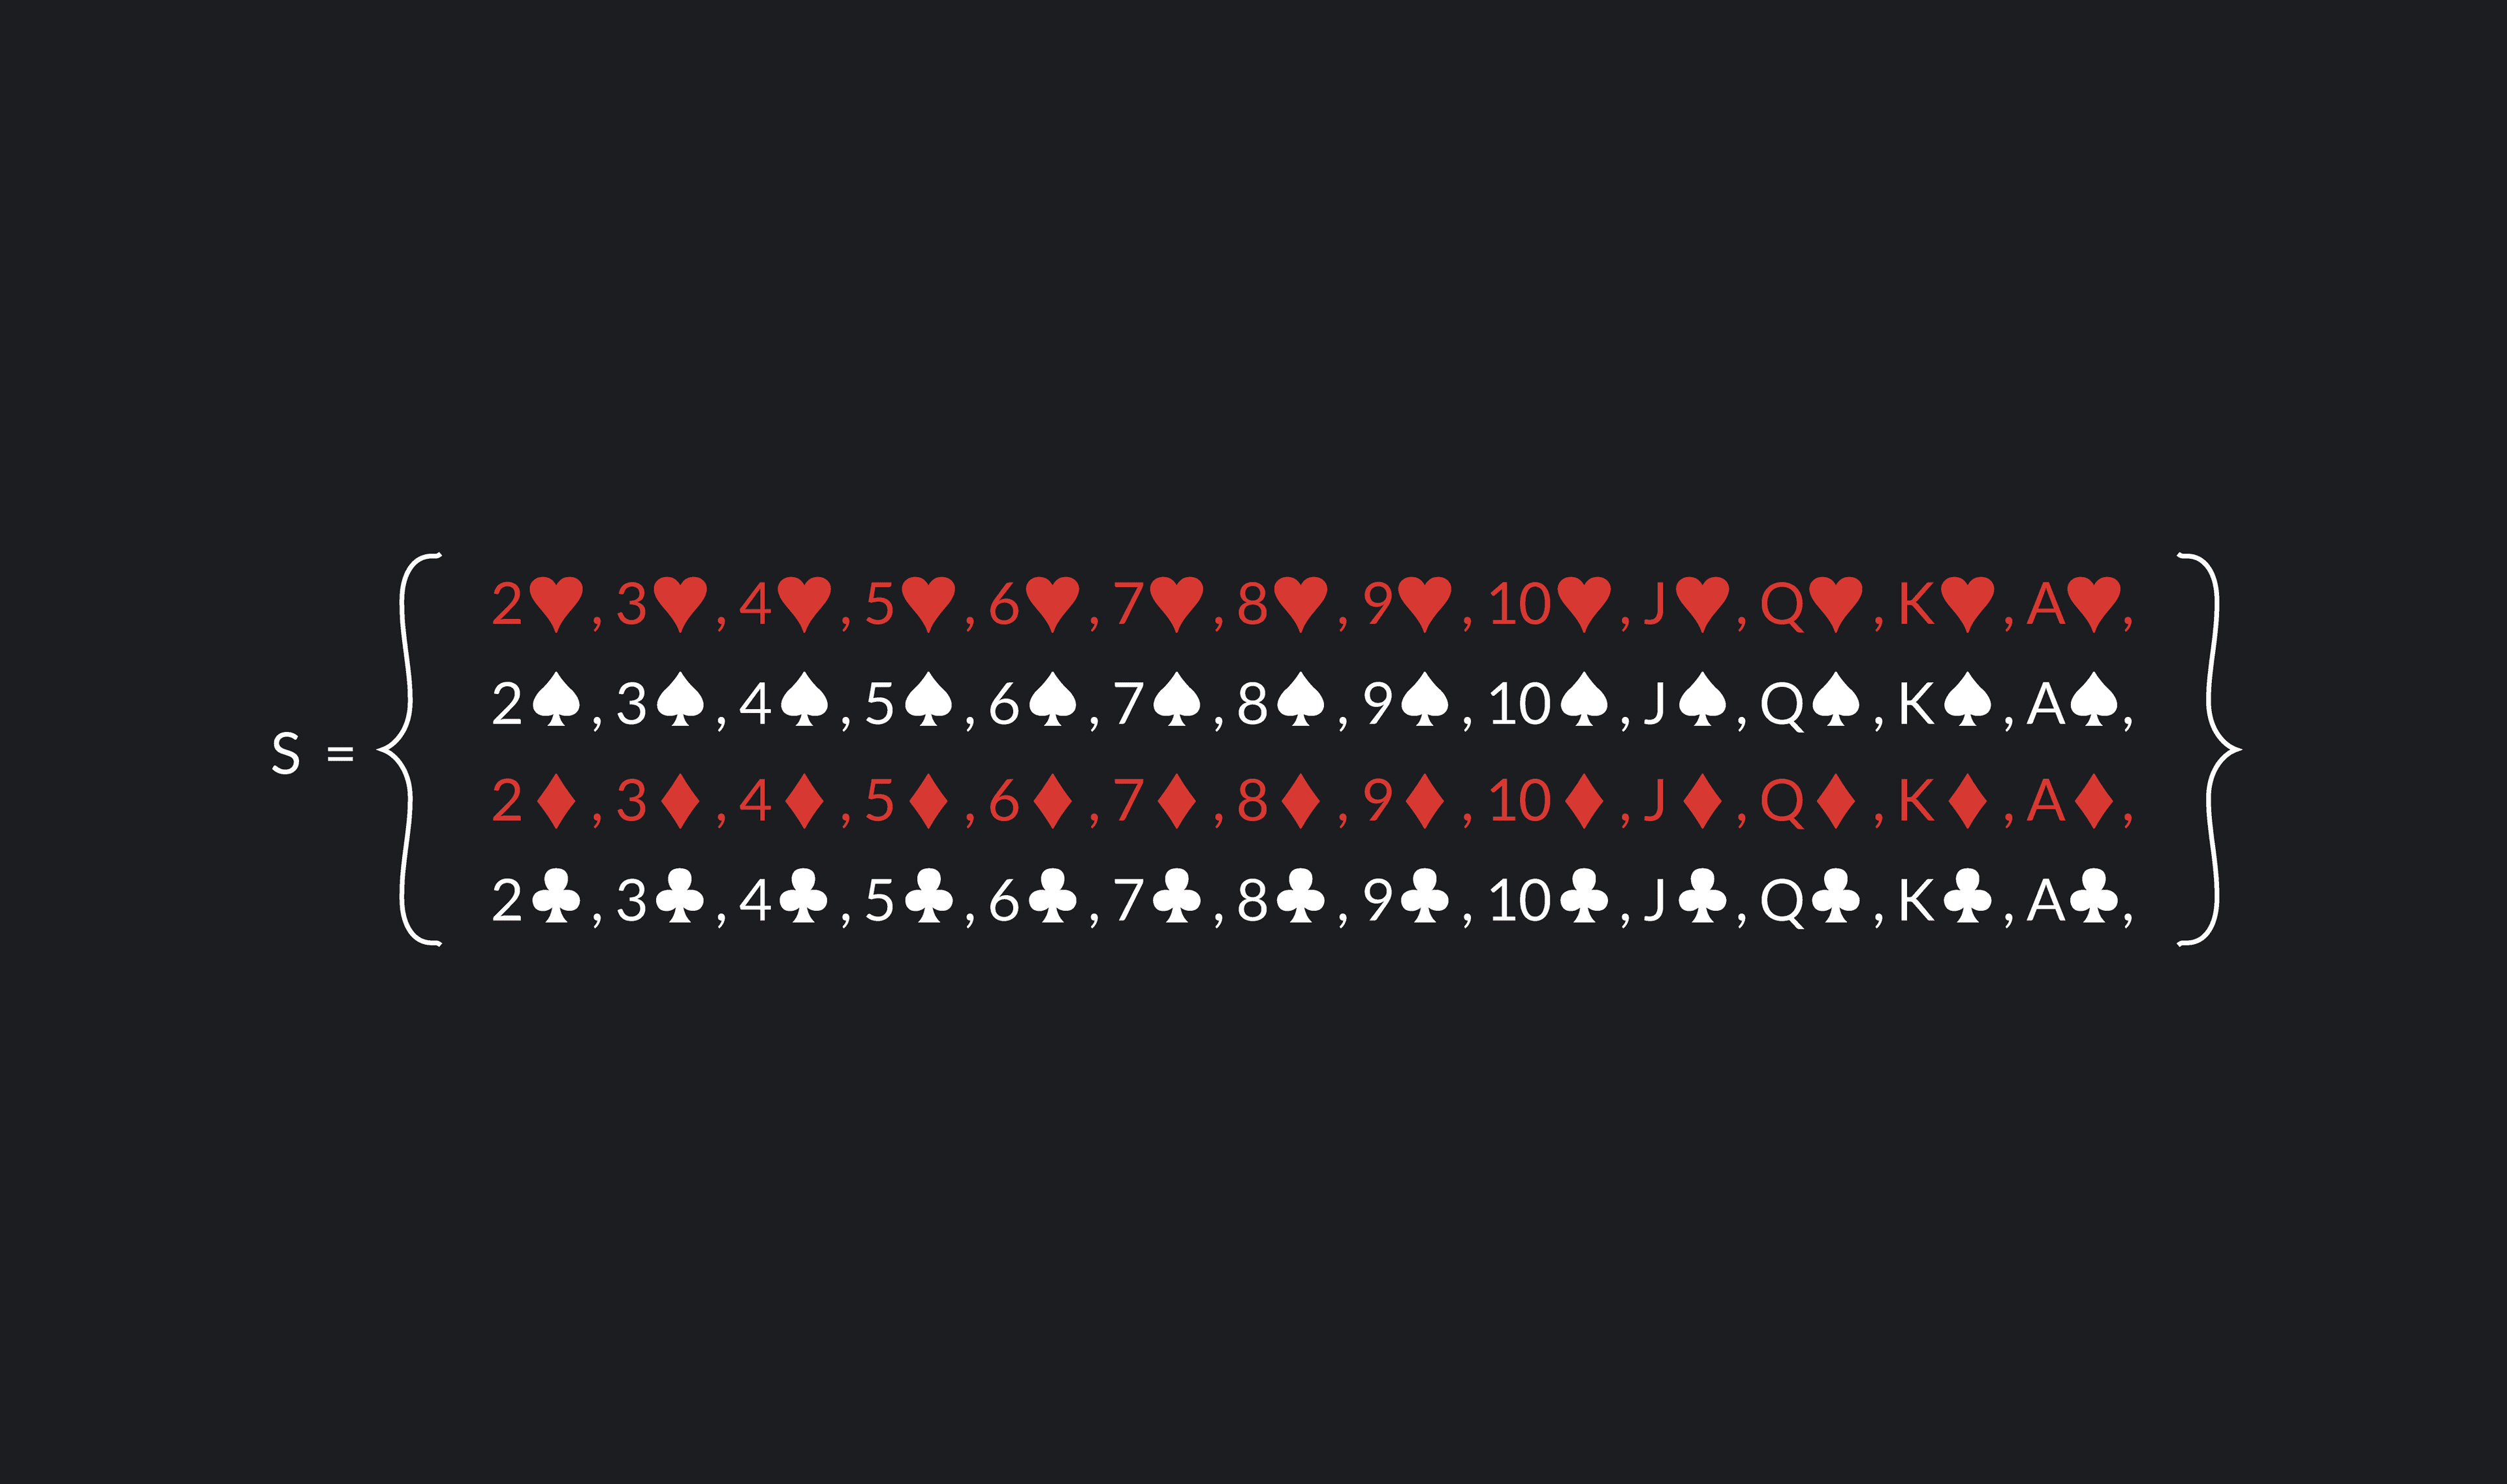
Let’s use the addition rule to find the probability of drawing a 2 or a diamond. The addition rule says:
We already found P(2) and P(♦) above. P(2) was 4/52, and P(♦) was . To apply the addition rule, all we need to do is to find the intersection of the two events P(2⋂♦).
If you look at the sample space, you’ll see that there is one outcome that is both a 2 and a diamond (the 2 of diamonds), so P(2⋂♦)=. Now that we have P(2), P(♦), and the intersection P(2⋂♦), we can plug each probability into the addition rule formula.
Well, if we think back to our probability equation, the general rule still applies. To find the probability of a 2 or a♦, we need to count all of the favorable outcomes (the outcomes that are a 2 or a ♦) and divide that by the total number of outcomes.
The problem is, if we count all of the 2s (there are four 2s in the deck), and count all of the ♦s (there are thirteen diamonds in the deck), and if we add these two numbers together (4+13), we are double-counting the 2 of diamonds! Subtracting the intersection ensures that we do not double count any of the favorable outcomes.
You might have noticed that we already calculated similar probabilities above without using the addition rule. We calculated the probability of rolling a 1 or 2, P(1 or 2), and we calculated the probability of drawing a diamond or a spade, P(♦ or ♠). In both of these cases, the intersection of the two events was equal to zero.
When rolling a die, there are no outcomes that involve rolling a 1 and a 2. Similarly, there is no way to draw a card from the deck that is both a diamond and a spade. Because the intersection is empty, we didn’t have to worry about double counting any outcomes.
See if you can use the addition rule to calculate the following probabilities. Scroll down to the bottom of this article to see if you are correct.
What is the probability of drawing a king or a red card from the deck? Hint: you’re looking for P(King or Red).
What is the probability of drawing a red card or a spade?
The complement of an event A is the event that A does not occur. Let’s say that we are rolling a die again, and we are looking at the event of “rolling a 2.” The complement of this event is “not rolling a 2.” In other words, the complement of rolling a 2 is the event of rolling a 1, 3, 4, 5, or 6. Complements are often denoted with the symbol ‘ or c. So the complement of A is A’ or .
The complement rule says the probability of an event A and the probability of its complement event A’ will sum to 1.
We can check this with our die. The probability of rolling a 2 plus the probability of not rolling a 2 equals:
P(2) + P(2’) = P(2) + P(1, 3, 4, 5, 6) = = 1
Intuitively, this should make sense. The complement of an event contains all of the outcomes that are not in the original event. Therefore, the probability of P(A) + P(A’) is really the probability of selecting an outcome from the entire sample space. It is the probability of rolling any one of the six numbers on the die. The chance of doing that is 1 or certainty.
The conditional rule can be applied when you want to find the probability of some event occurring conditional (or given that) another event has also occurred. The notation for a conditional probability is P(A|B). This is the probability that event A occurs, given that B has occurred.
The conditional rule states that P(A|B) is equal to the probability of the intersection of A and B, divided by the probability of B.
Similarly, if we are looking for the probability of B given A, the conditional rule would look like this. Notice that the numerator is the same, but the denominator of the equation is P(A) instead of P(B).
Back to our cards. What is the probability of getting an ace, given that you have drawn a club? This is P(Ace|♣).
If we take a look back at our sample space, we can see that the event of “Ace and ♣” only has one favorable outcome (the ace of clubs, A♣). Therefore, the probability of the intersection, P(Ace and ♣), is . The probability P(♣) = , and the conditional probability P(Ace|♣) is then divided by or .
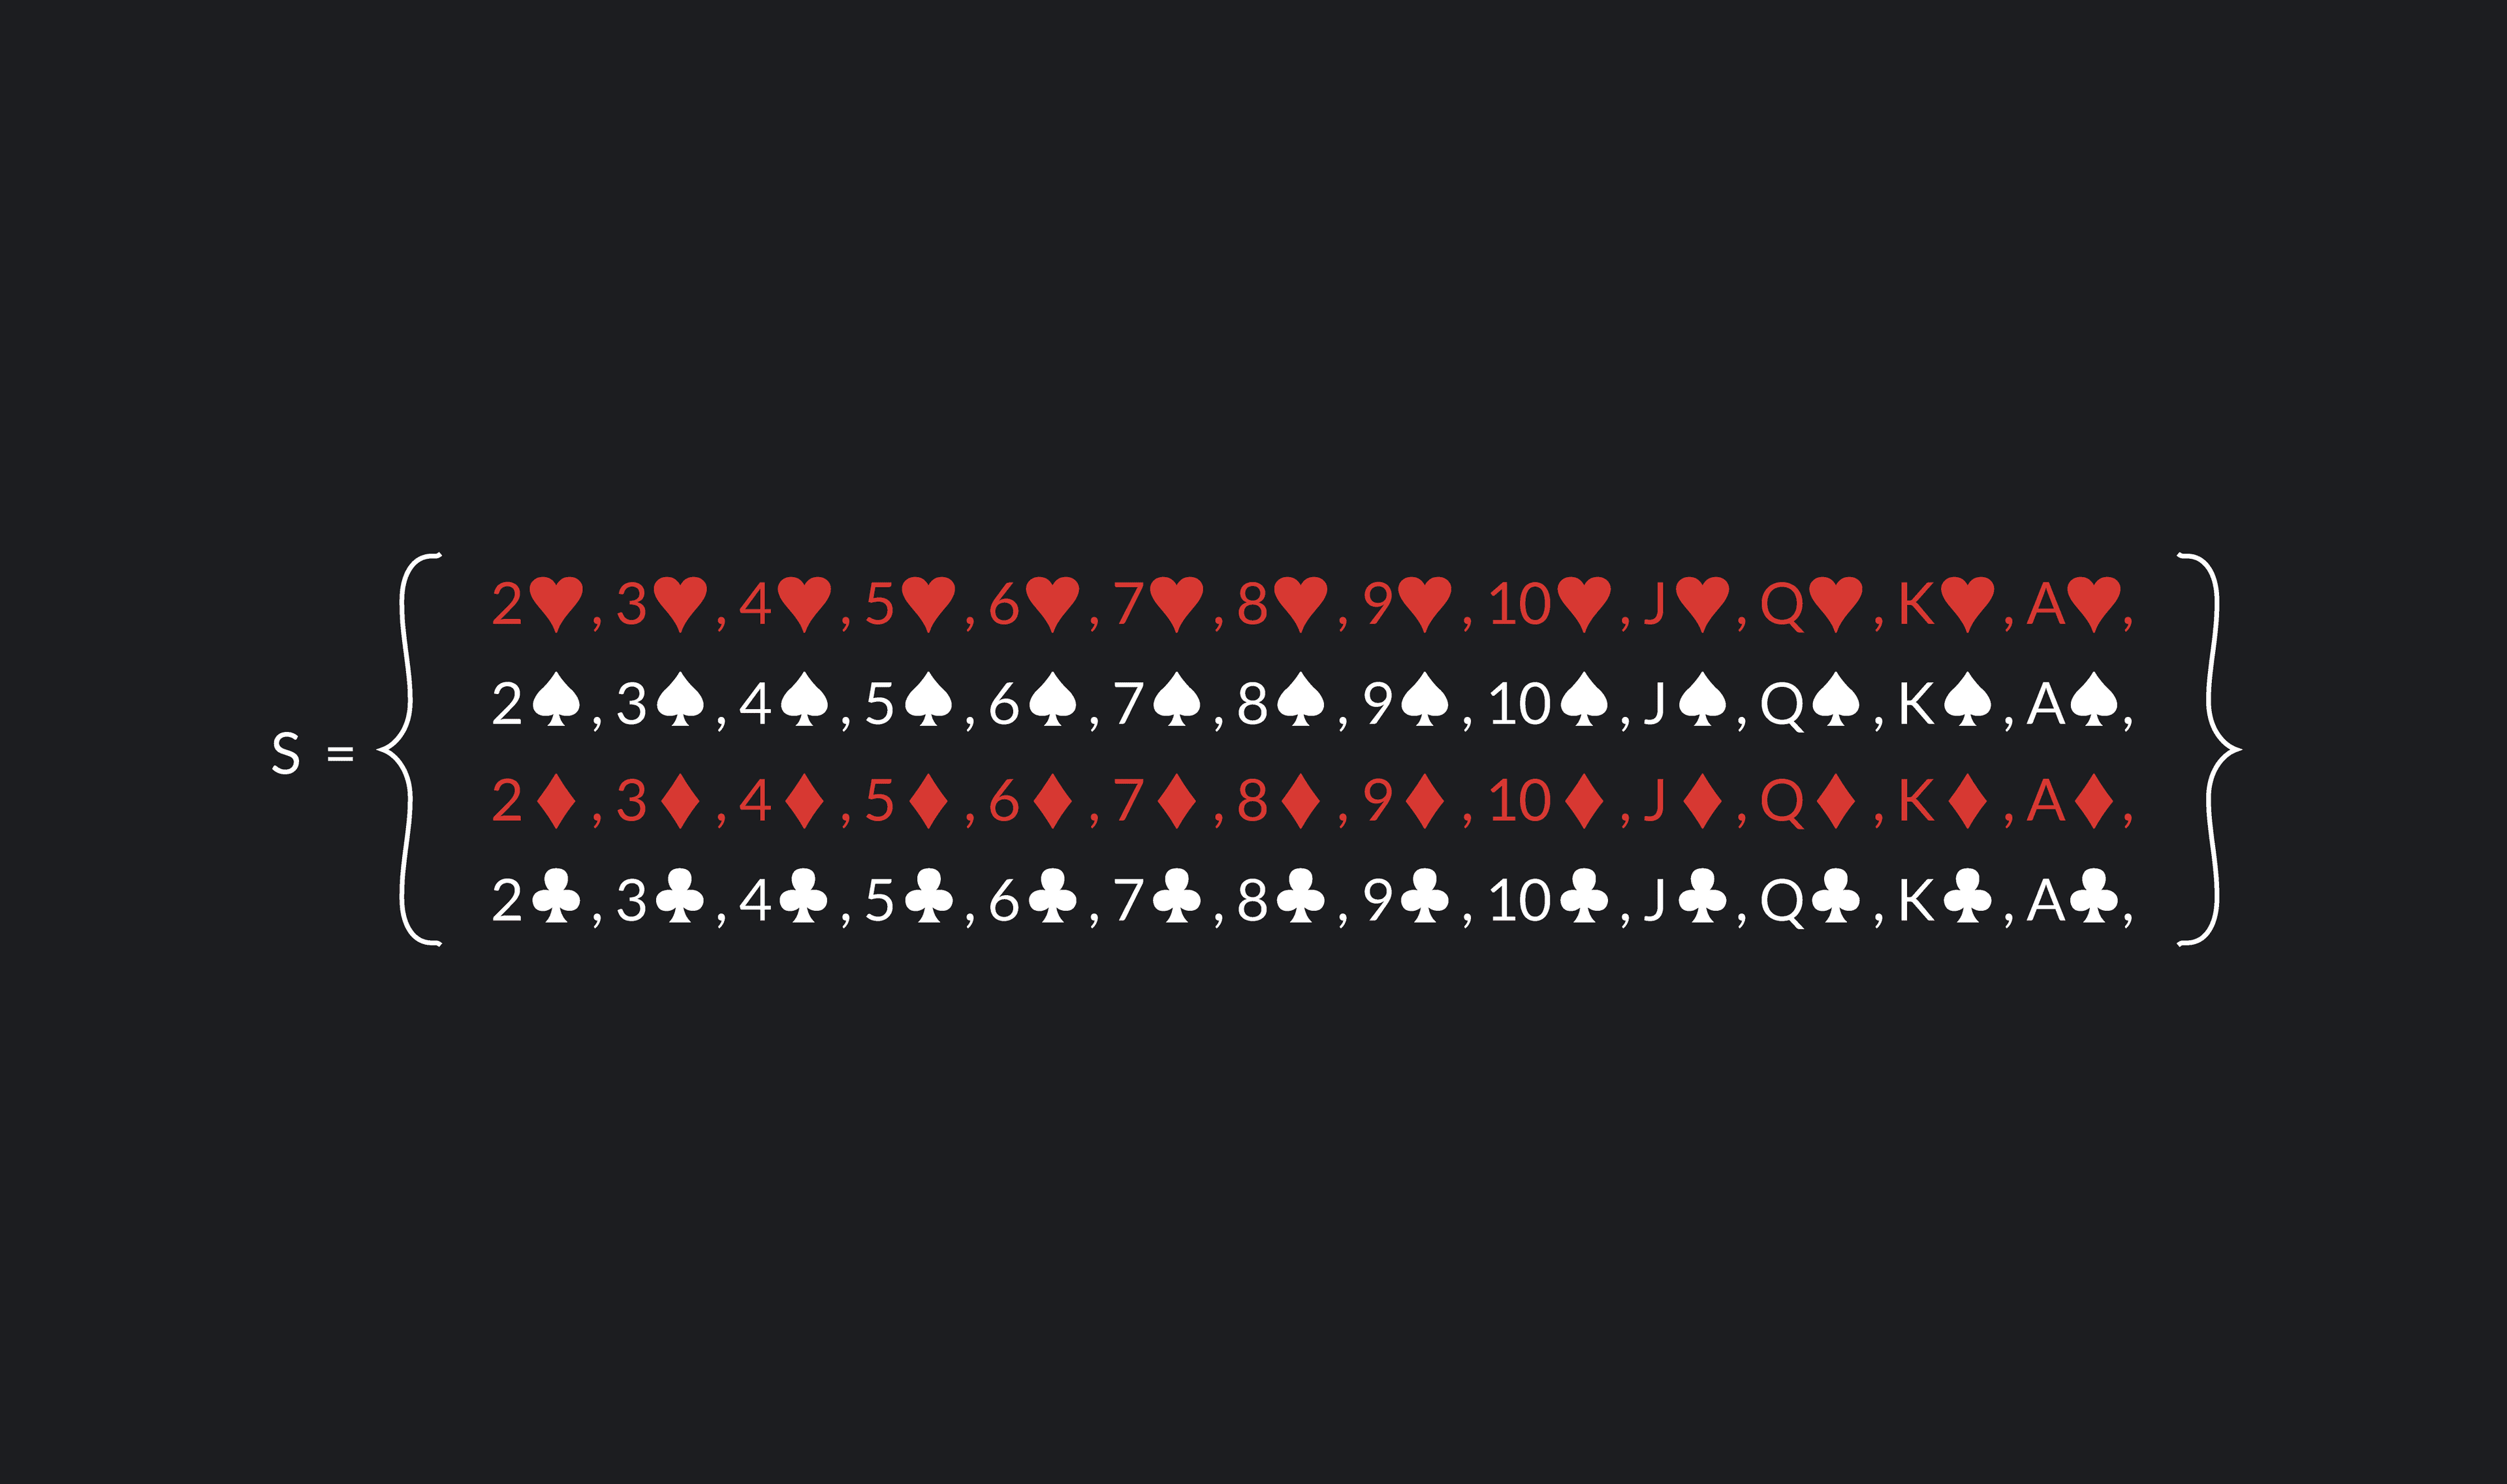
Another way of thinking about this is as follows. If you know you drew a club, the sample space, in effect, has shrunk from 52 cards to 13. You know you didn’t select any of the other suits. There are now thirteen possible cards you drew instead of the original 52. Of these thirteen cards, there is only one favorable outcome, the Ace. Hence, P(Ace|♣) is .
Use the conditional rule to see if you can find the probability of drawing a club given that you have drawn an ace, P(♣|Ace). Careful! This is not the same thing as P(Ace|♣). Scroll down to the bottom of this article to check your answer.
The multiplication rule is a rearrangement of the conditional rule. The rule says that the probability of the intersection of A and B, P(A and B), is equal to the conditional probability of A given B, P(A|B), multiplied by the probability of B, P(B). This is just a rearrangement of the conditional rule for P(A|B).
Because , we can also write the multiplication rule as:
You can also view more on many of these essential rules below.
The last thing you need to know to get a basic grasp of probability is that there are different approaches to studying probabilities. When we were applying the probability formula, we were actually using theoretical or classical probability. There are times, however, when the sample space or the likelihood of outcomes is unknown. If this is the case, we can approach probability a bit differently.
Theoretical (or classical) probability deals with experiments with multiple possible outcomes that are all equally likely. Theoretical probability can be applied to a wide range of problems. Still, it can not be used as general probability theory because it cannot be applied in cases where we lack sufficient information about the sample space and the likelihood of outcomes. It cannot be used in cases where the outcomes are not all equally likely to occur.
The frequency (or empirical) interpretation of probability uses actual trials and observations to estimate probabilities. In experimental probability, a person starts with no prior beliefs about the likelihood of outcomes. Rather, to estimate probabilities, they repeat experiments over and over again, assigning probabilities to events based on the relative frequencies with which they observe particular outcomes.
As a simplified example, say a person shoots one hundred free throws, and they make 75. In this case, a frequentist would estimate that the probability of that person making a free throw is 75/100 or 0.75. The more trials that are run, the better the estimates are thought to be.
Bayesians (or subjective) interpretations of probability involve individual beliefs about probability. From the Bayesian perspective, probability is the reasonable expectation that a person has about the likelihood of an event.
This may sound like an entirely unscientific approach to probability. It’s essentially saying probabilities are whatever people believe them to be. However, Bayesians argue that subjective beliefs about probability can be put to the test and that if people build their beliefs rationally, subjective probability falls in line with the basic rules of probability and can be updated as new information and evidence about events emerges.
Probability of getting heads or tails on a coin flip:
= = 1
Probability of rolling an odd number:
= = 0.5
Probability of drawing a black card:
= = 0.5
Probability of drawing a face card (a jack, queen, or king):
= = 0.231
Probability of drawing a spade, heart, or diamond :
= = ¾ =0.75
Probability of drawing a king or a red card:
= 0.538
Probability of drawing a red card or a spade:
Notice that the probability of the intersection P(Red ⋂ ♠) is equal to 0 here. This is because there are no red cards that are also ♠s. It is impossible to draw a red spade!
Outlier (from the co-founder of MasterClass) has brought together some of the world's best instructors, game designers, and filmmakers to create the future of online college.
Check out these related courses:

Statistics
This article explains what subsets are in statistics and why they are important. You’ll learn about different types of subsets with formulas and examples for each.
Subject Matter Expert

Statistics
Here is an overview of set operations, what they are, properties, examples, and exercises.
Subject Matter Expert

Calculus
Knowing how to find definite integrals is an essential skill in calculus. In this article, we’ll learn the definition of definite integrals, how to evaluate definite integrals, and practice with some examples.
Subject Matter Expert