
Statistics
Understanding Variables in Statistics: Types & Examples
Learn the different types of variables in statistics, how they are categorized, their main differences, as well as several examples.
Sarah Thomas
Subject Matter Expert

Statistics
04.26.2023 • 5 min read
Subject Matter Expert
Explore degrees of freedom. Learn about their importance, calculation methods, and two test types. Plus dive into solved examples for better understanding.
In This Article
In statistics, you’ll often come across the term “degrees of freedom.” You might be reading the results of a statistical analysis and see the abbreviation d.f., or you may be trying to calculate a statistic like the standard deviation and see degrees of freedom in the denominator of the formula.
The term “degrees of freedom” pops up in many different contexts, and it can be challenging to grasp what degrees of freedom are.
In this article, we’ll dive deeper into the meaning and importance of this much-used statistical term.
Degrees of freedom are the number of independent pieces of information used in calculating a statistical estimate. We say these independent pieces of information are “free to vary” given the constraints of your calculation.
To understand the intuition behind degrees of freedom, think about a game show where a prize is hidden behind 1 of 3 doors. How many doors would you need to open to be sure of where the prize is located?
You might get lucky and find the prize behind the first door you open, but if the prize is not behind door number 1, you’ll need to open another door. Suppose you open door number 2, and again, you find no prize. What can you be sure of? The prize must be behind door number 3.

If a prize is behind 1 of the 3 doors, and you’ve opened 2 doors, you know for sure what must be behind the third door. The outcome of what’s behind door number 3 is not free to vary given what lies behind doors 1 and 2. In this case, we might say there are 2 degrees of freedom. Once you know what’s behind 2 of the 3 doors, the outcome of what’s behind the third door is fixed. It’s not free to vary.
Here’s another example. Say we have sample data on 3 individuals: Timmy, Tommy, and Joey. Suppose I told you, the average age of the sample is 20. I also tell you Timmy is 20, and so is Tommy. What must be true about Joey’s age? That’s right! He must also be 20.
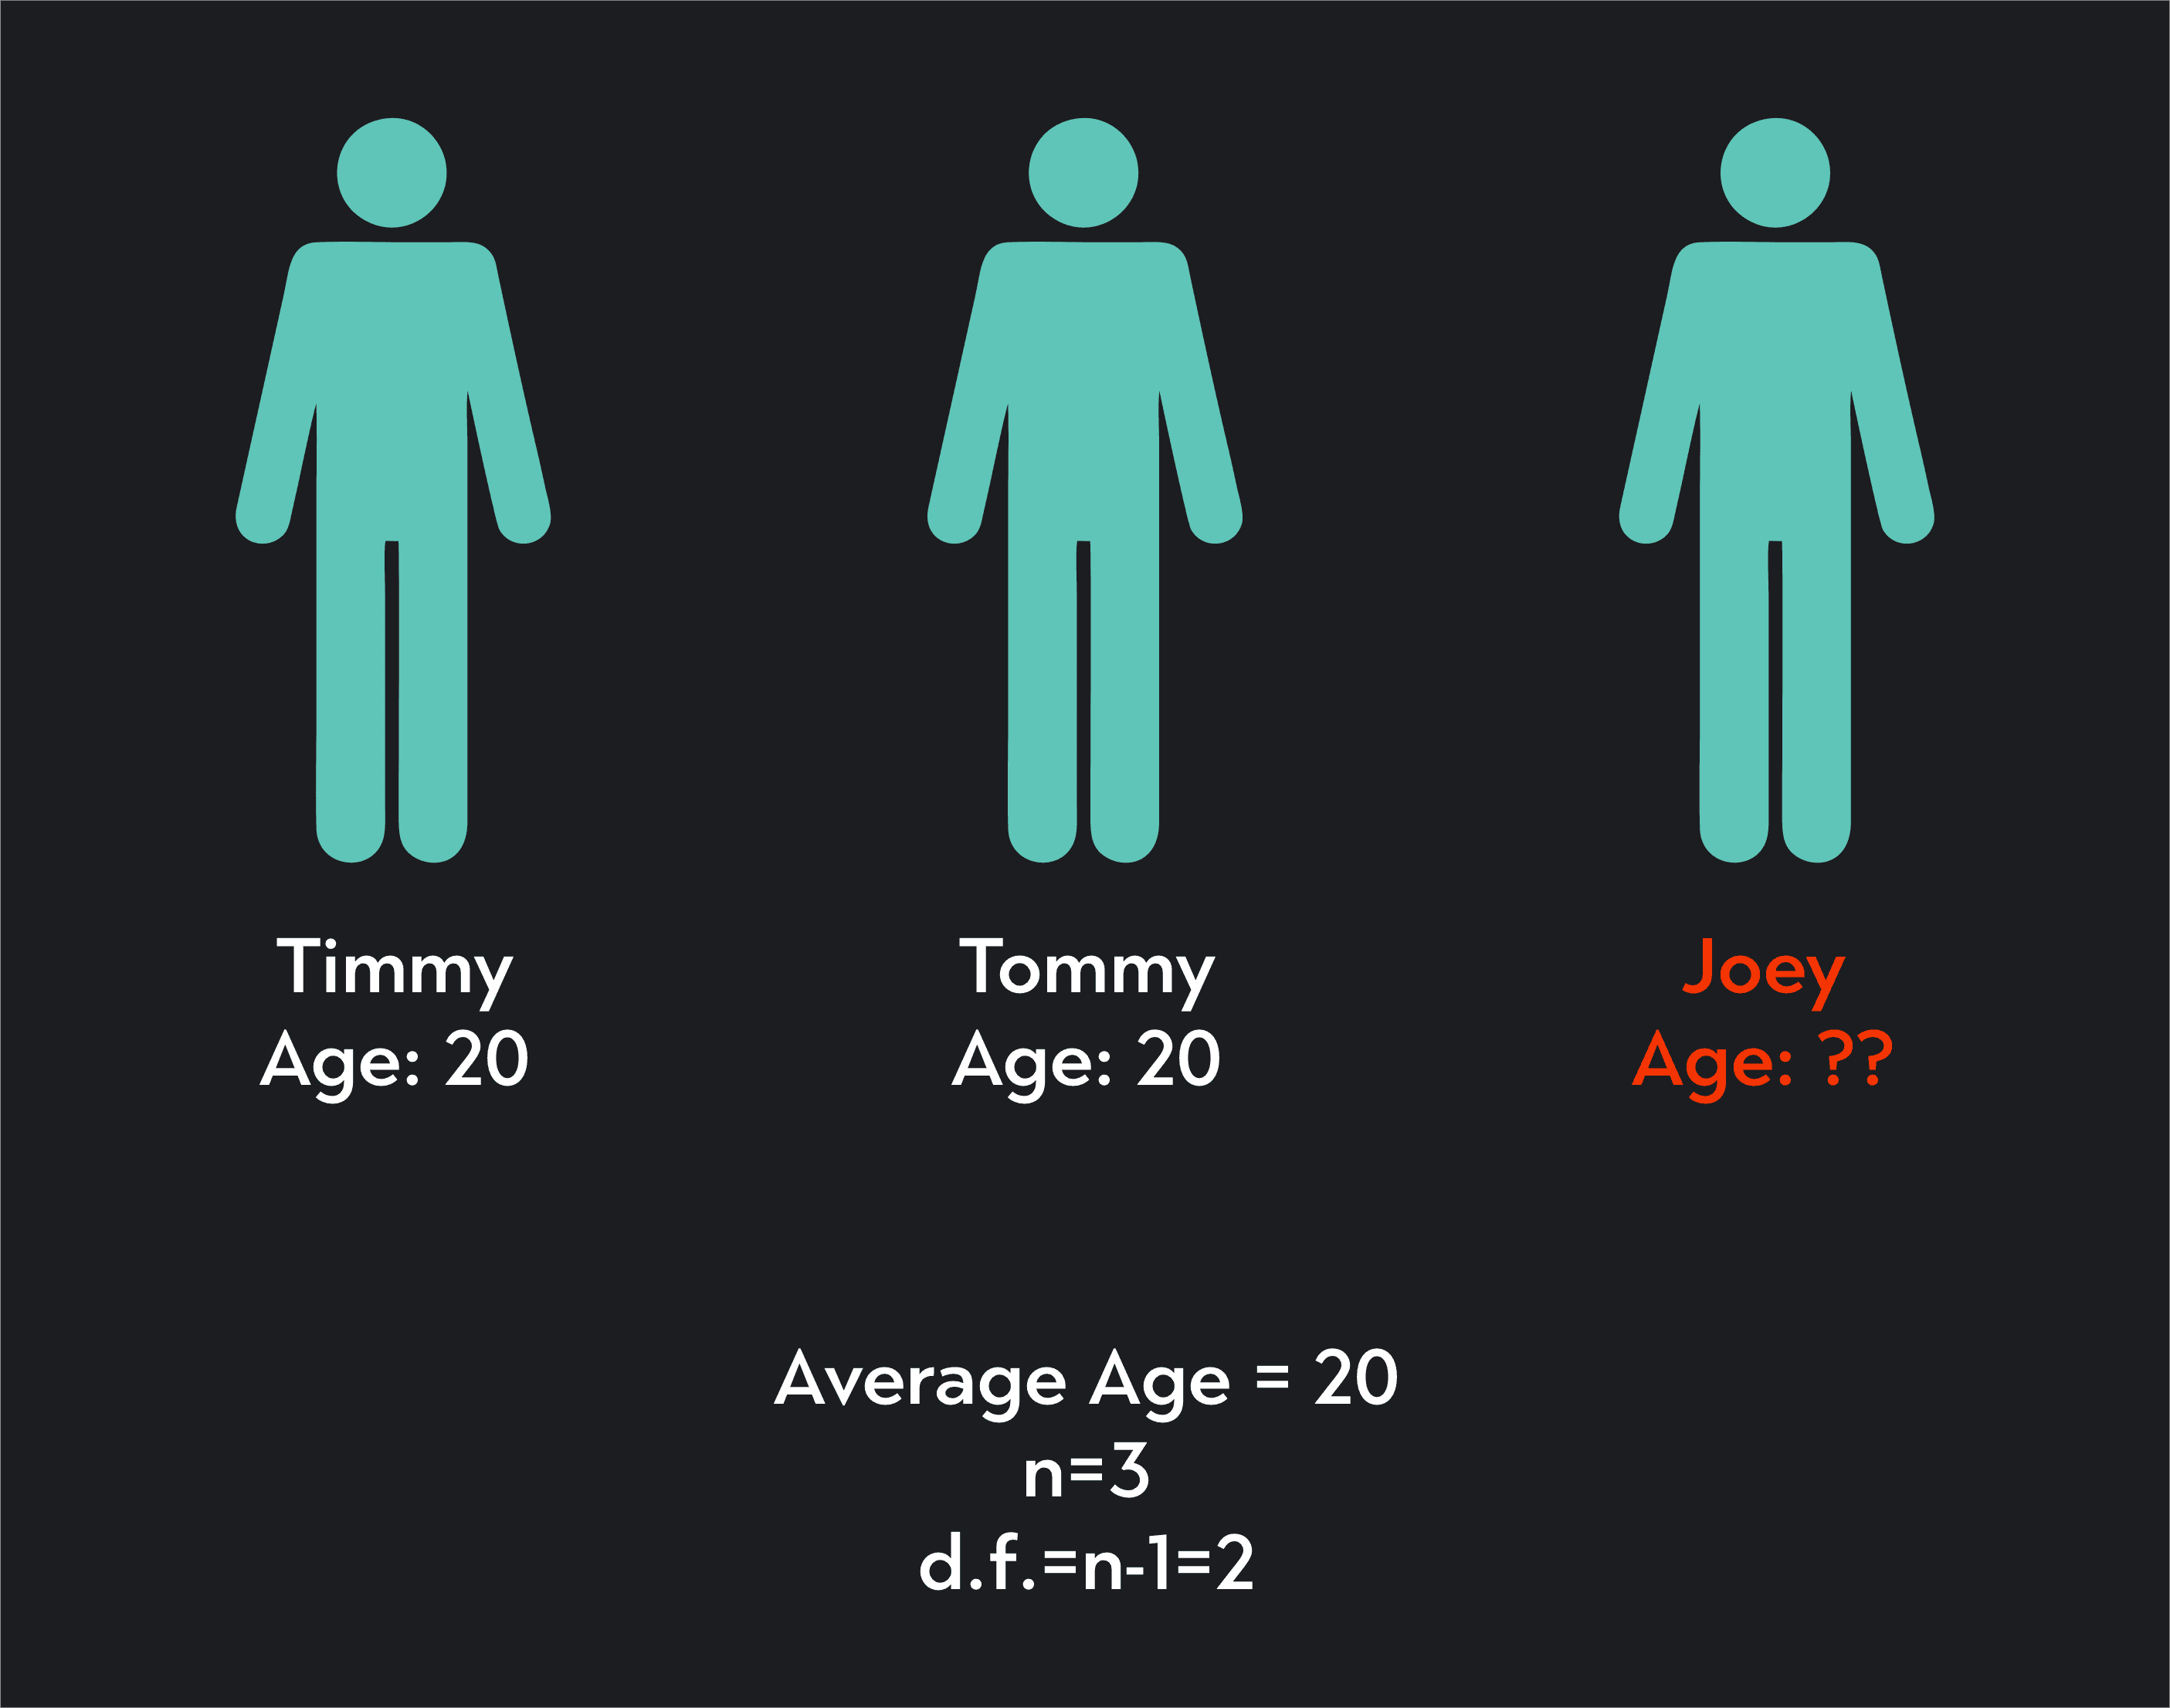
If Timmy and Tommy are both 20, the only way the average age of your sample can be 20 is if Joey is the same age as the others.
This pattern holds true whenever you calculate an average. If you calculate an average (or mean) for a sample size of n, once you know the mean, only n-1 of the values in your sample are free to vary. Once you’ve calculated a sample average for your data, you are left with n-1 degrees of freedom!

How you calculate degrees of freedom varies depending on what you are estimating. Typically, degrees of freedom are equal to your sample size minus the number of parameters that have already been estimated as intermediary steps in your calculation.
Let’s look at the example of calculating a sample standard deviation. A sample standard deviation, , is a sample statistic used to estimate the true standard deviation, , of a population.
The formula for calculating a sample standard deviation is shown below. Notice that to calculate a sample standard deviation, we need to first calculate the sample mean . Once we have the sample mean, we take the square root of the sum of squared deviations from the sample mean divided by n-1 to get the standard deviation.
The n-1 in the denominator represents the degrees of freedom we need to use. As we already saw, by calculating the sample mean, , we are placing a constraint on our data.
We are anchoring 1 point in the data, which is not free to vary given the values of all the other data points used in the calculation. When we go to calculate the sample standard deviation, we account for this constraint by using n-1 degrees of freedom in our calculation.
Degrees of freedom are important in statistics because they affect the accuracy of our statistical estimates. The lower the degrees of freedom, the less reliable your results will be. Just like a detective who has limited evidence to solve a crime, a statistician working with low degrees of freedom has limited information to estimate a parameter and will come up with a less reliable estimate.
Degrees of freedom also play an important role in statistical tests. For example, in a t-test using a Student’s t-distribution, degrees of freedom affect both the shape of the t-distribution and the critical values you use to reject the null hypothesis.
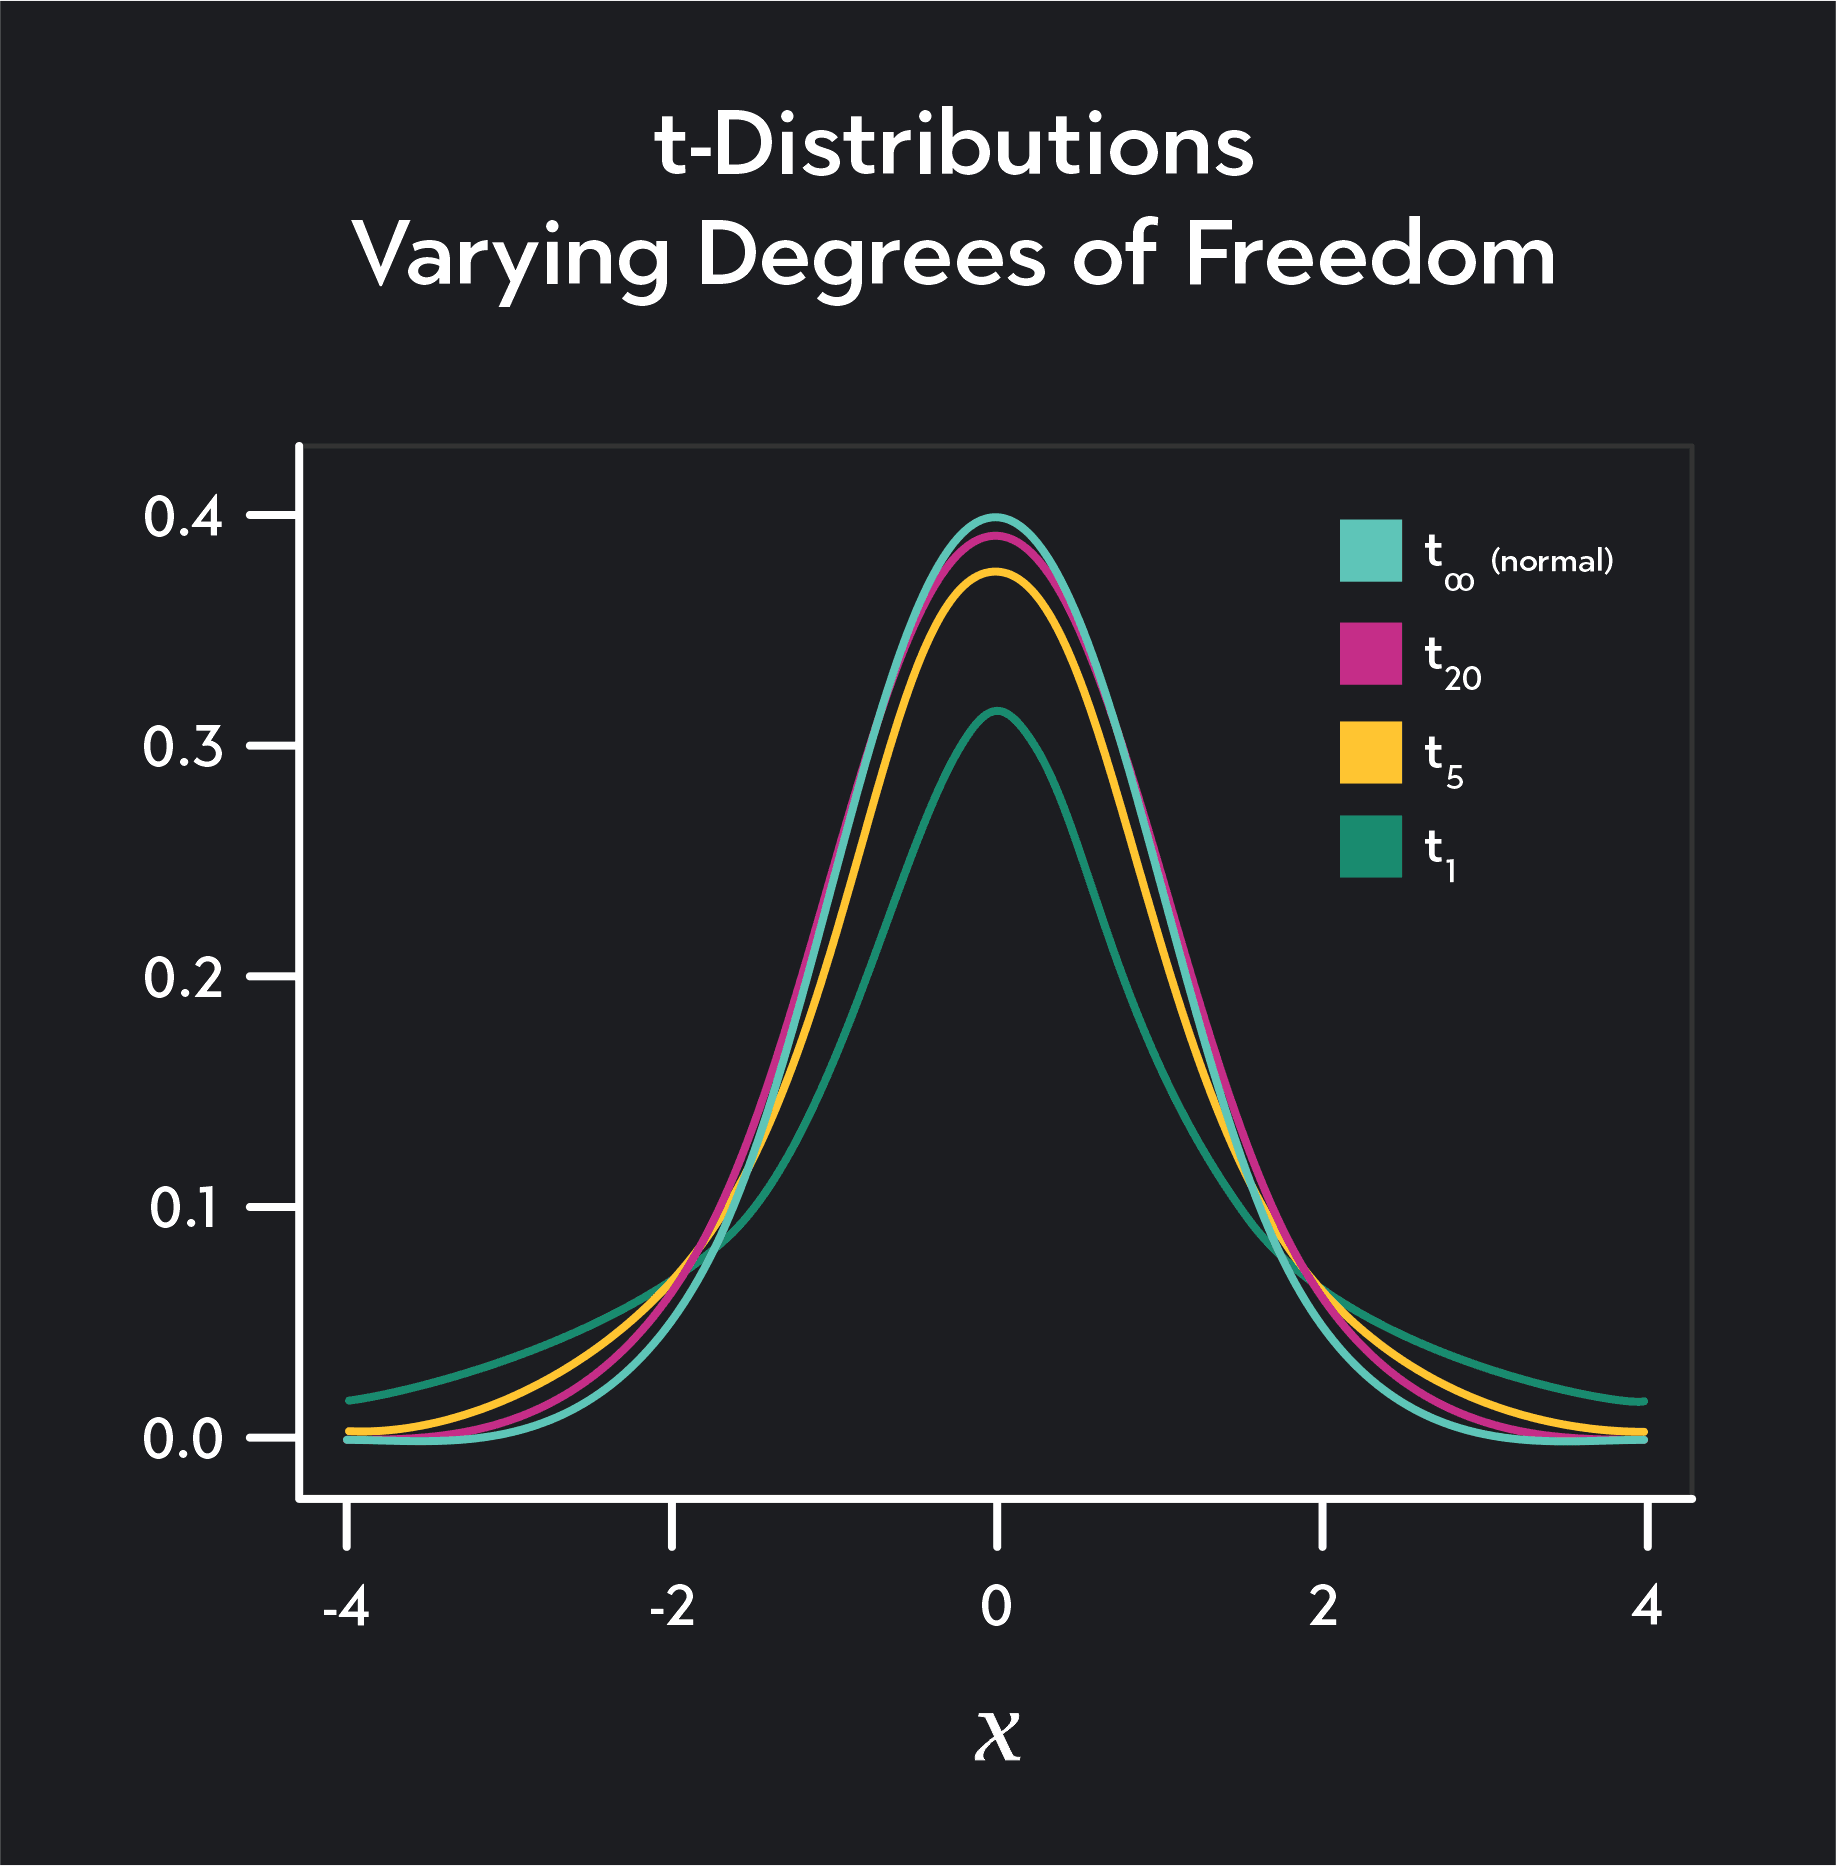
The t-distribution is a distribution quite similar to a normal distribution. It’s unimodal, bell-shaped, and symmetric. The main distinction between a t-distribution and a normal distribution is that a t-distribution has fatter tails, and its shape depends on degrees of freedom.
The higher the degrees of freedom on a t-distribution, the closer the shape of the distribution will be to a normal distribution.
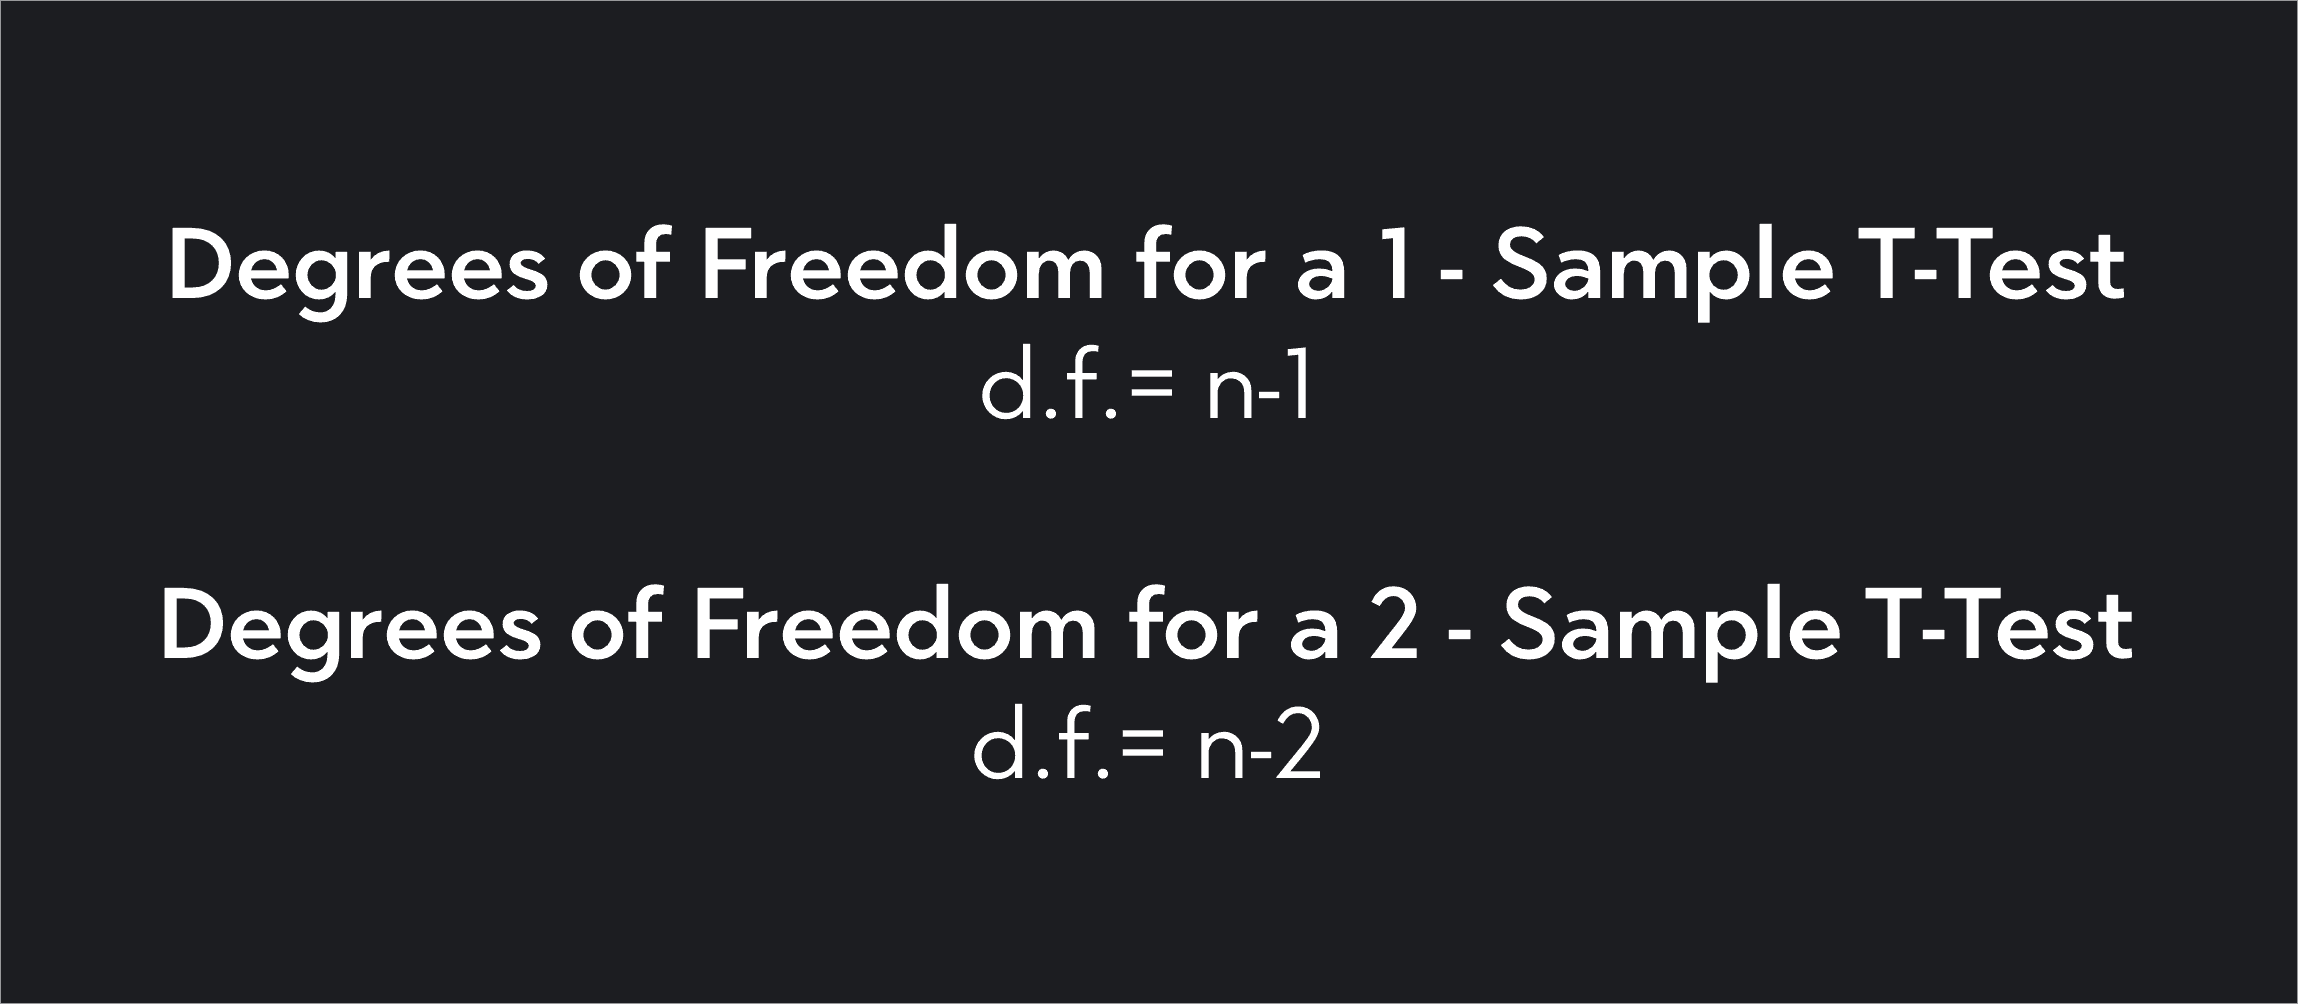
When you’re using a t-distribution in a 1-sample t-test, you can determine the degrees of freedom by subtracting 1 from your sample size n. If you had a sample size of 10, for example, your degrees of freedom would be 10-1 = 9. If you are conducting a 2-sample t-test, your degrees of freedom will equal n-2.
We use chi-square distributions in several statistical tests including tests for goodness of fit and tests of independence between categorical variables.
Just like the Student’s t-distribution, the shape of a Chi-square distribution depends on degrees of freedom. When dealing with chi-square distributions, we represent degrees of freedom with the lowercase letter k.
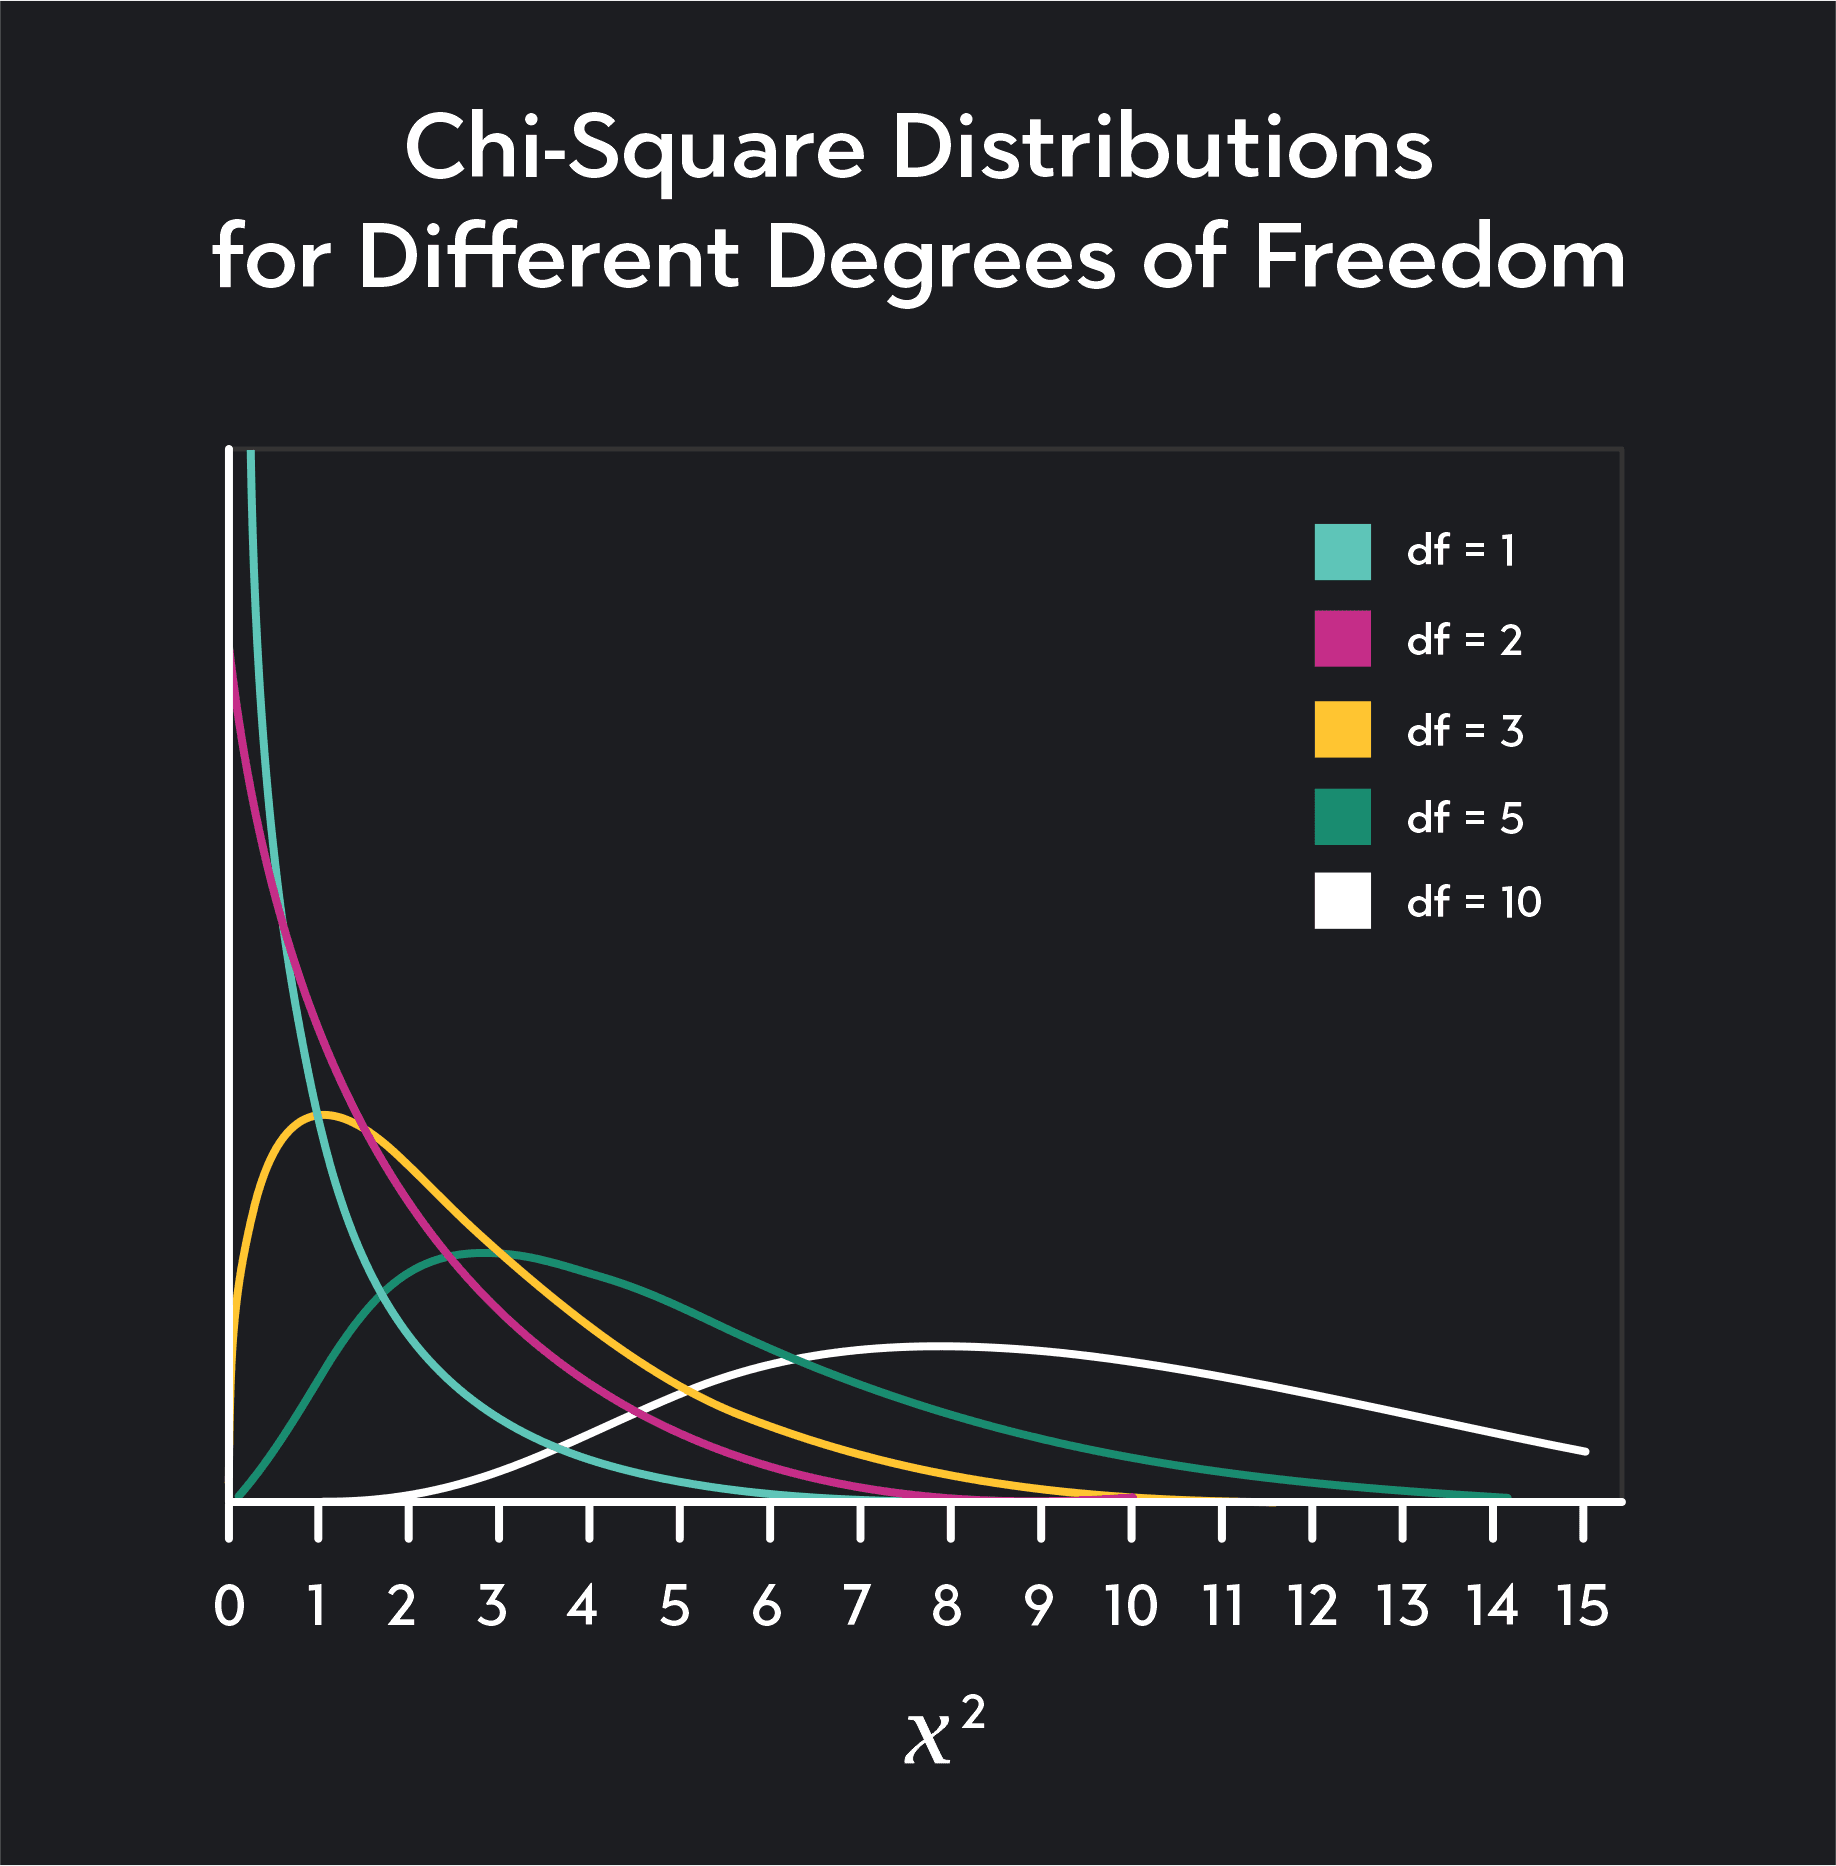
A chi-square distribution is the distribution of the sum of squares of k-independent normally distributed random variables. To find the degrees of freedom for a chi-square distribution, you need to count the number of k-independent normally distributed random variables used to construct the sum of squares.
For example, say you have a normally distributed random variable . is then a random variable with a chi-square distribution with 1 degree of freedom. If you have 2 independent, normally distributed, random variables and , will have a chi-square distribution with k=2 degrees of freedom.
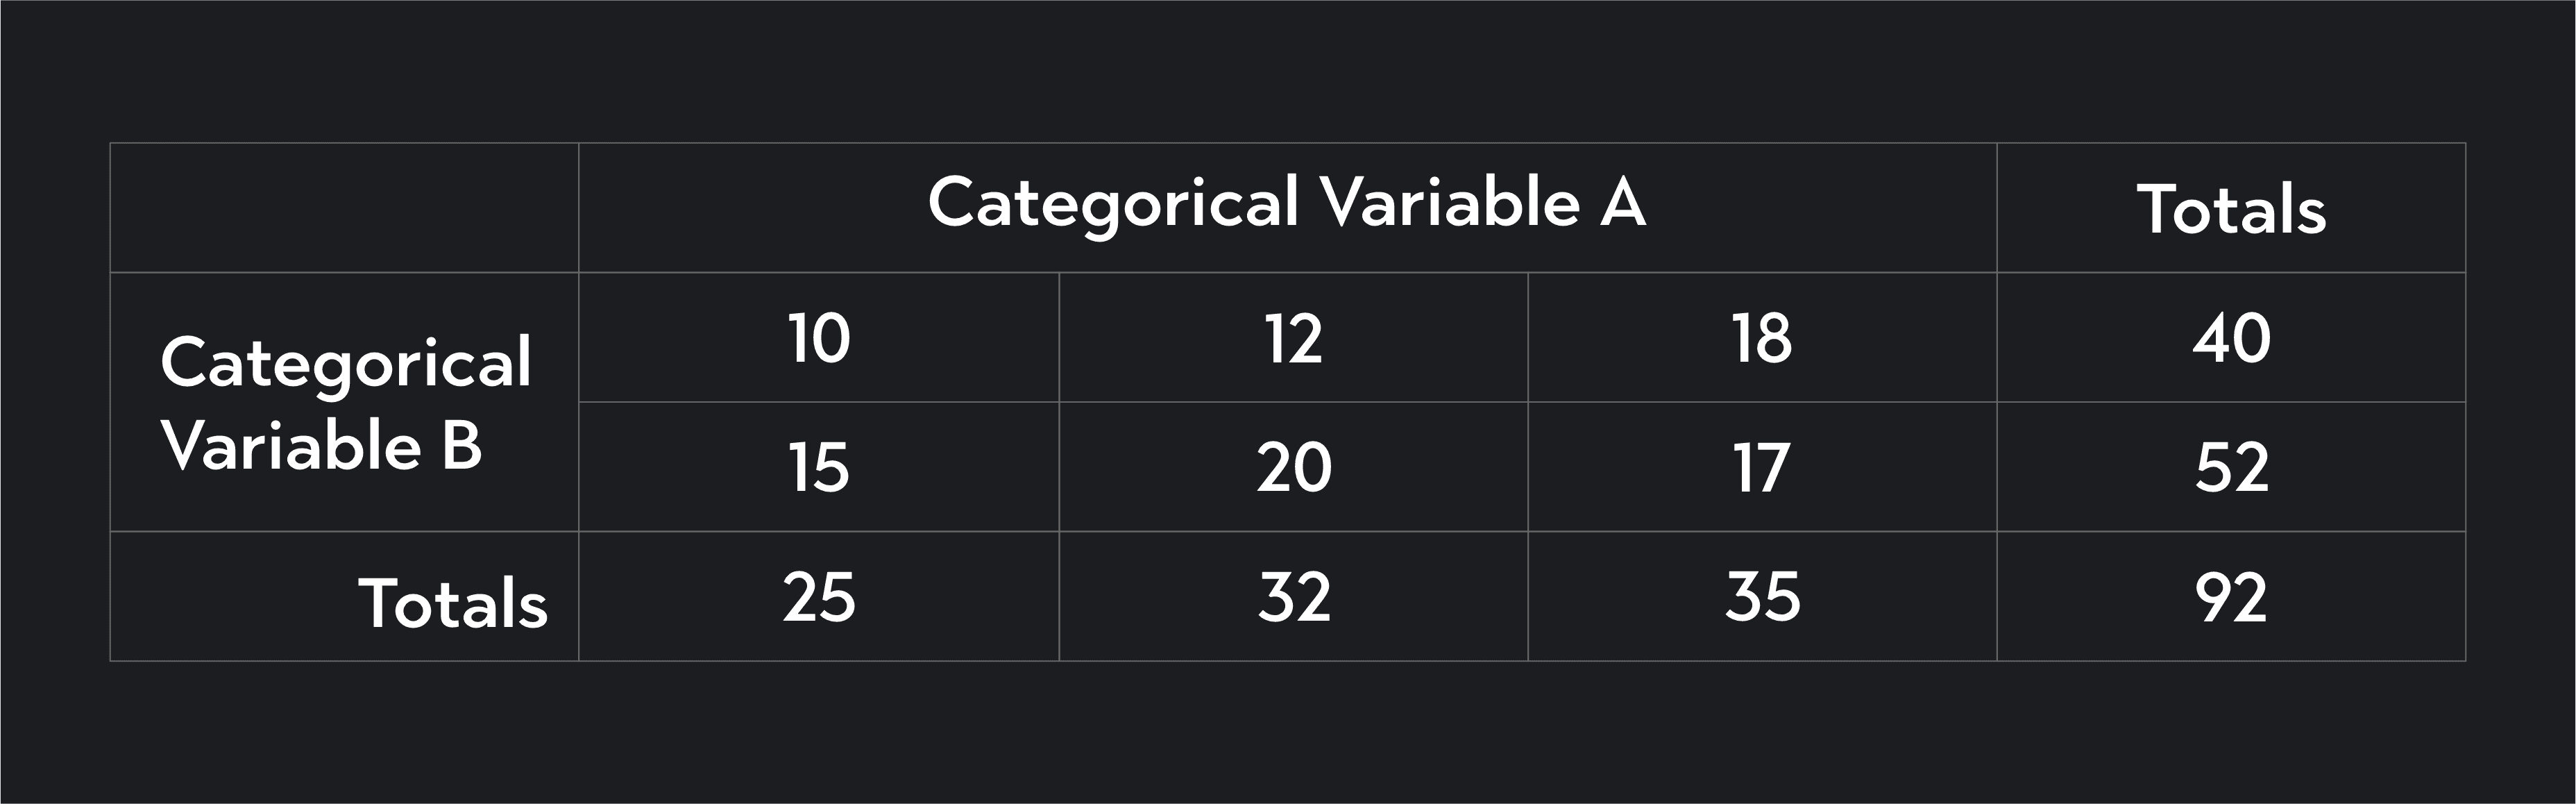
In a chi-square test of independence, you can find the degrees of freedom by looking at a contingency table (also called a cross-tabulation) of your data. The degrees of freedom is equal to the number of columns listed under 1 of the categorical variables minus 1 multiplied by 1 minus the number of rows listed under your other categorical variable.
Degrees of Freedom for a Chi-Square Test of Independence
d.f. = k = (number of columns -1) x (number of rows - 1)
The contingency table below has 3 columns listed under Variable A and 2 rows listed for Variable B, and therefore, the degrees of freedom equal:
Linear regression is a method statisticians use to study the relationship between variables. Once again, degrees of freedom plays a crucial role.
In linear regression, the degrees of freedom equals the number of observations n minus the number of independent variables in your regression k, minus 1.
Degrees of Freedom in Linear Regression
d.f. = n-k-1
Where:
n is your sample size
k is the number of independent variables in the regression
Here’s more about linear regression:
Degrees of freedom is a measure of the number of independent pieces of information used in calculating a statistical estimate. In inferential statistics, you’ll come across degrees of freedom as you calculate sample statistics, as you construct confidence intervals or conduct hypothesis tests, and as you run regressions.
Remember, degrees of freedom typically depend on both your sample size and the number of parameters you’re trying to estimate. All else being equal, a statistical analysis where the degrees of freedom are high is typically an analysis with more power and more reliable estimates.
Outlier (from the co-founder of MasterClass) has brought together some of the world's best instructors, game designers, and filmmakers to create the future of online college.
Check out these related courses:


Statistics
Learn the different types of variables in statistics, how they are categorized, their main differences, as well as several examples.
Subject Matter Expert

Statistics
Learn all about the coefficient of variation. Included are explanations of the standard deviation and the mean as well as examples and common applications.
Subject Matter Expert

Psychology
This article describes what a variable is, what dependent and independent variables are, a list of examples, how they are used in psychology studies, and more.
Subject Matter Expert