In This Article
What Is Data?
Types of Data in Statistics
What Is Qualitative Data?
What Is Quantitative Data?
FAQ About Data
What Is Data?
In statistics, data are the raw materials we use in our analysis. Data are the pieces of information, such as labels or numbers, we use to test hypotheses and make predictions.
Types of Data in Statistics
We can divide data into two broad categories: qualitative and quantitative.
We can further divide these two categories into:
Nominal
Ordinal
Discrete
Continuous
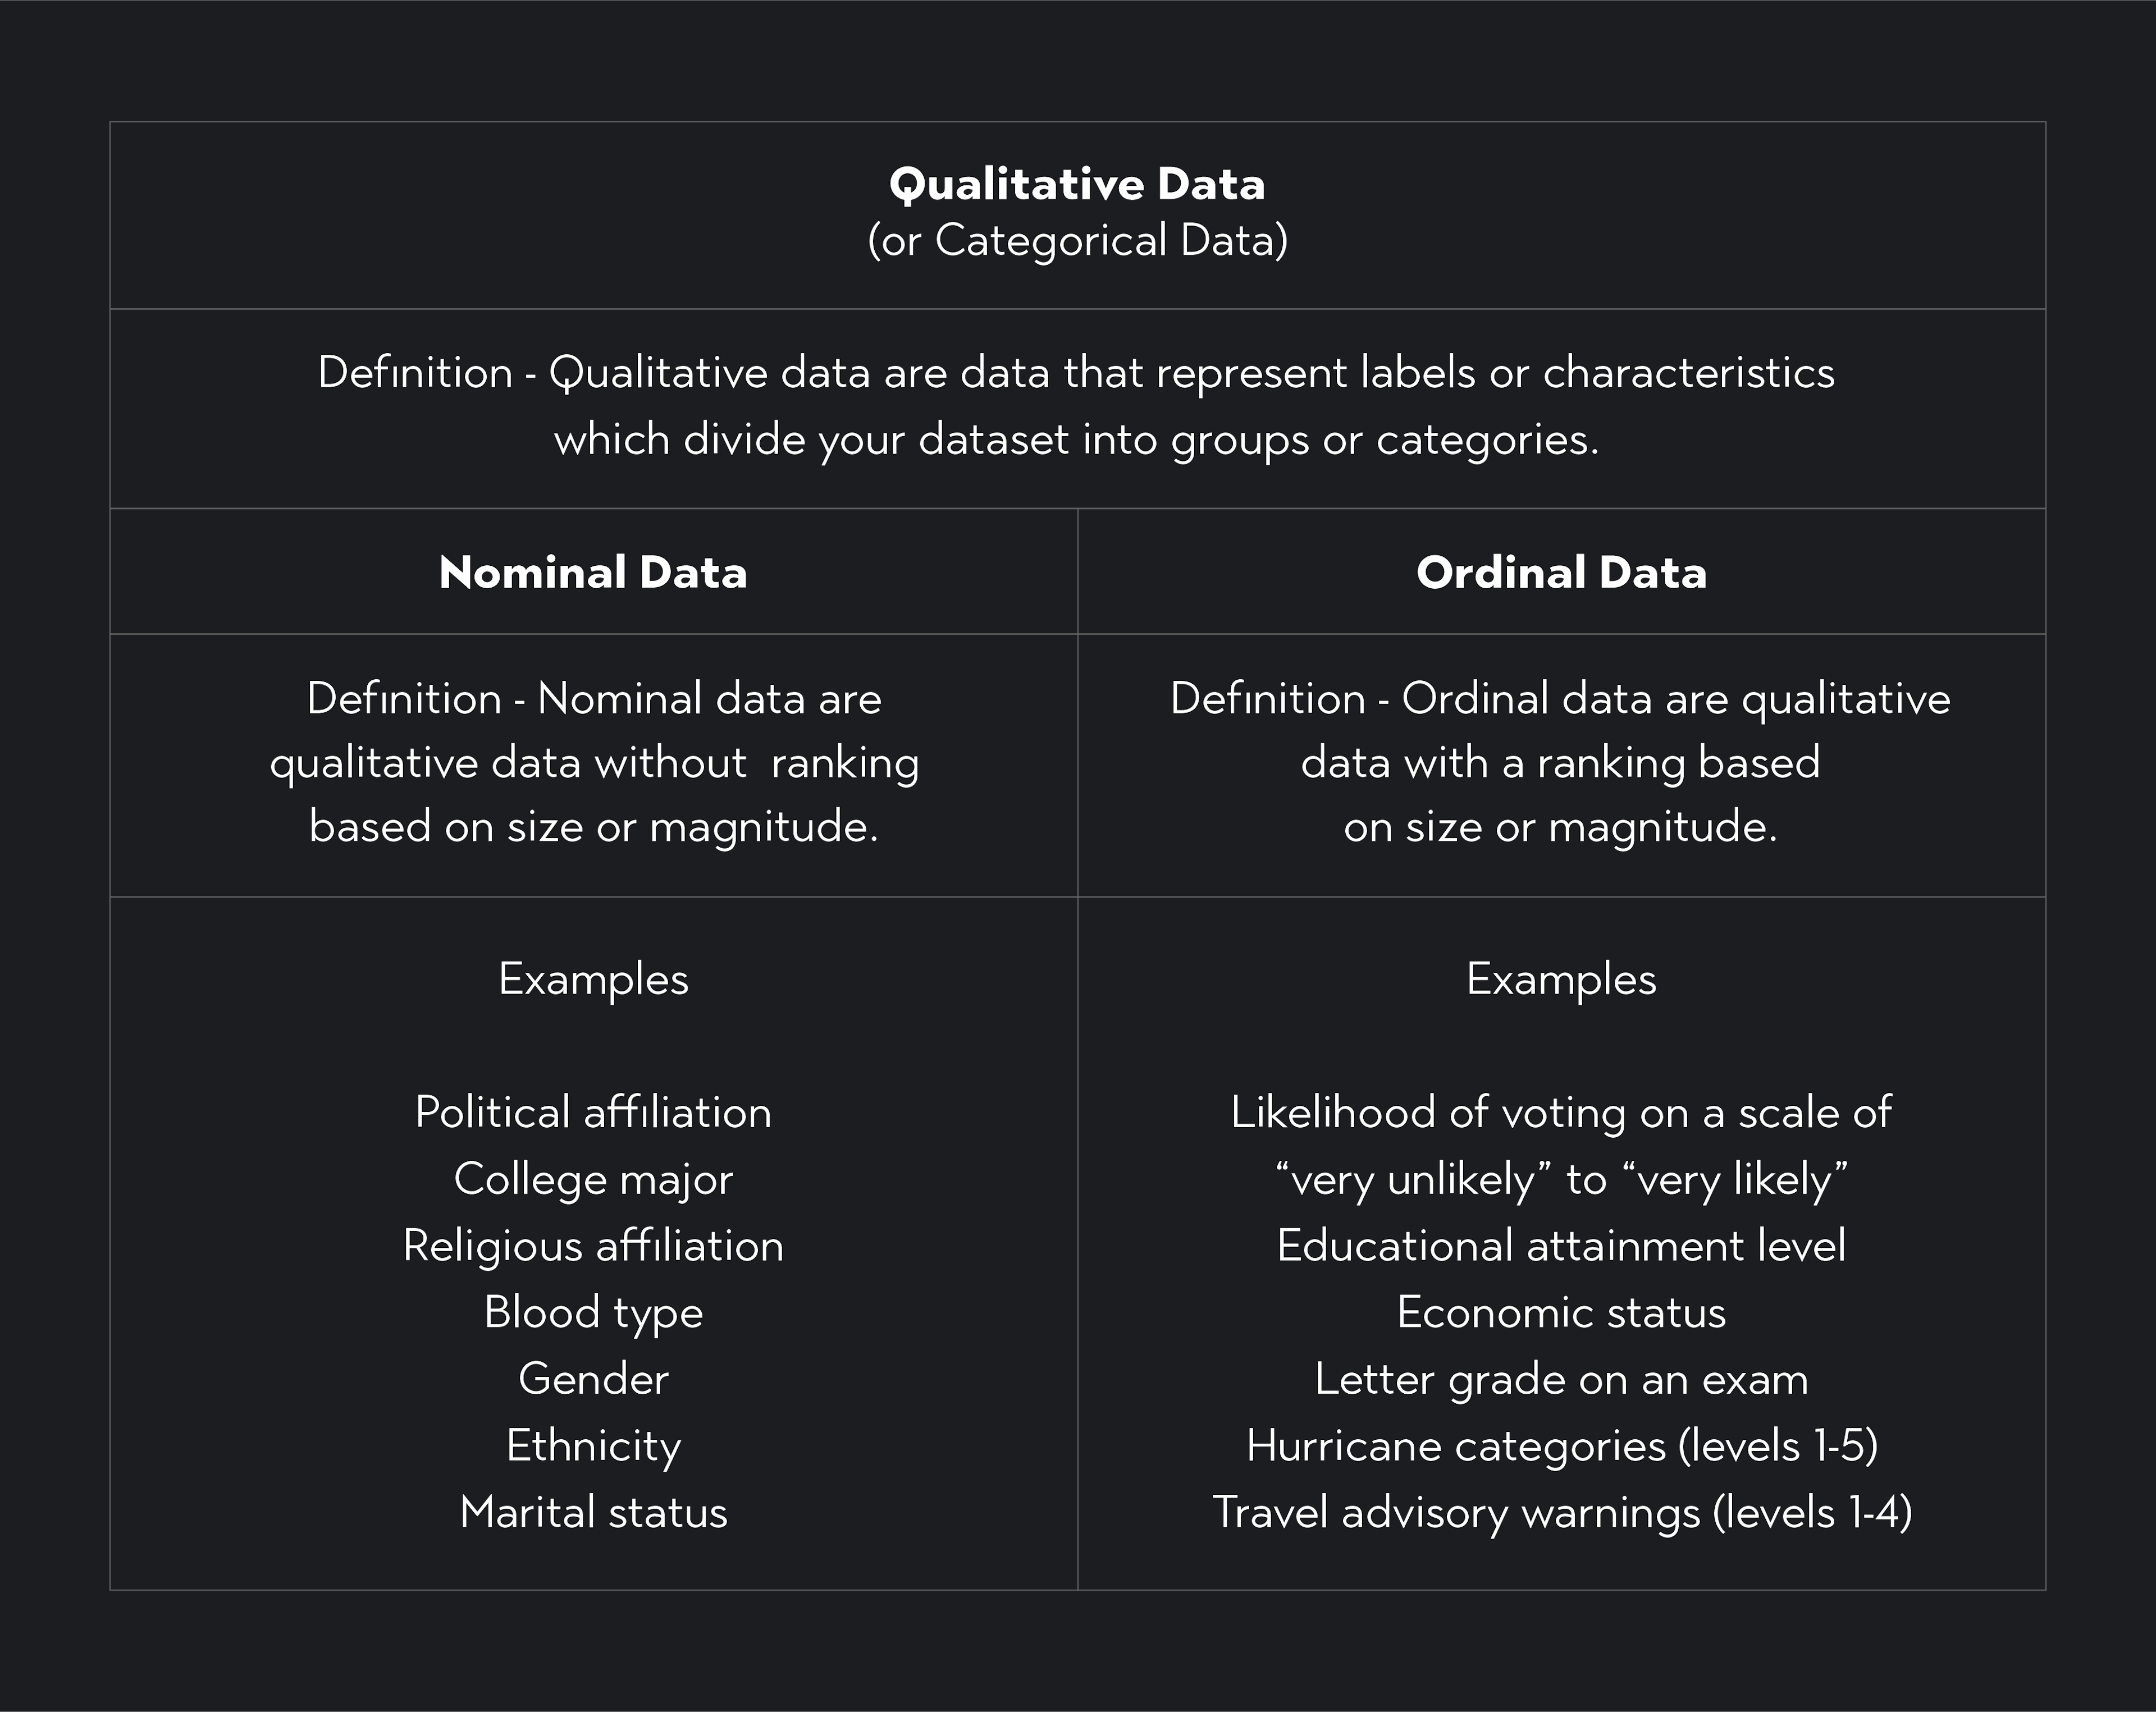
Qualitative Data (or Categorical Data)
Qualitative data represent labels or characteristics that divide your overall data set into distinct groups or categories.
Nominal Data
Nominal data are qualitative data with no inherent ranking based on size or magnitude.
Example - Nationality
Ordinal Data
Ordinal data are qualitative data with an order based on size or magnitude.
Example - Self-reported happiness of survey respondents
Very unhappy
Somewhat unhappy
Neutral
Somewhat happy
Very happy
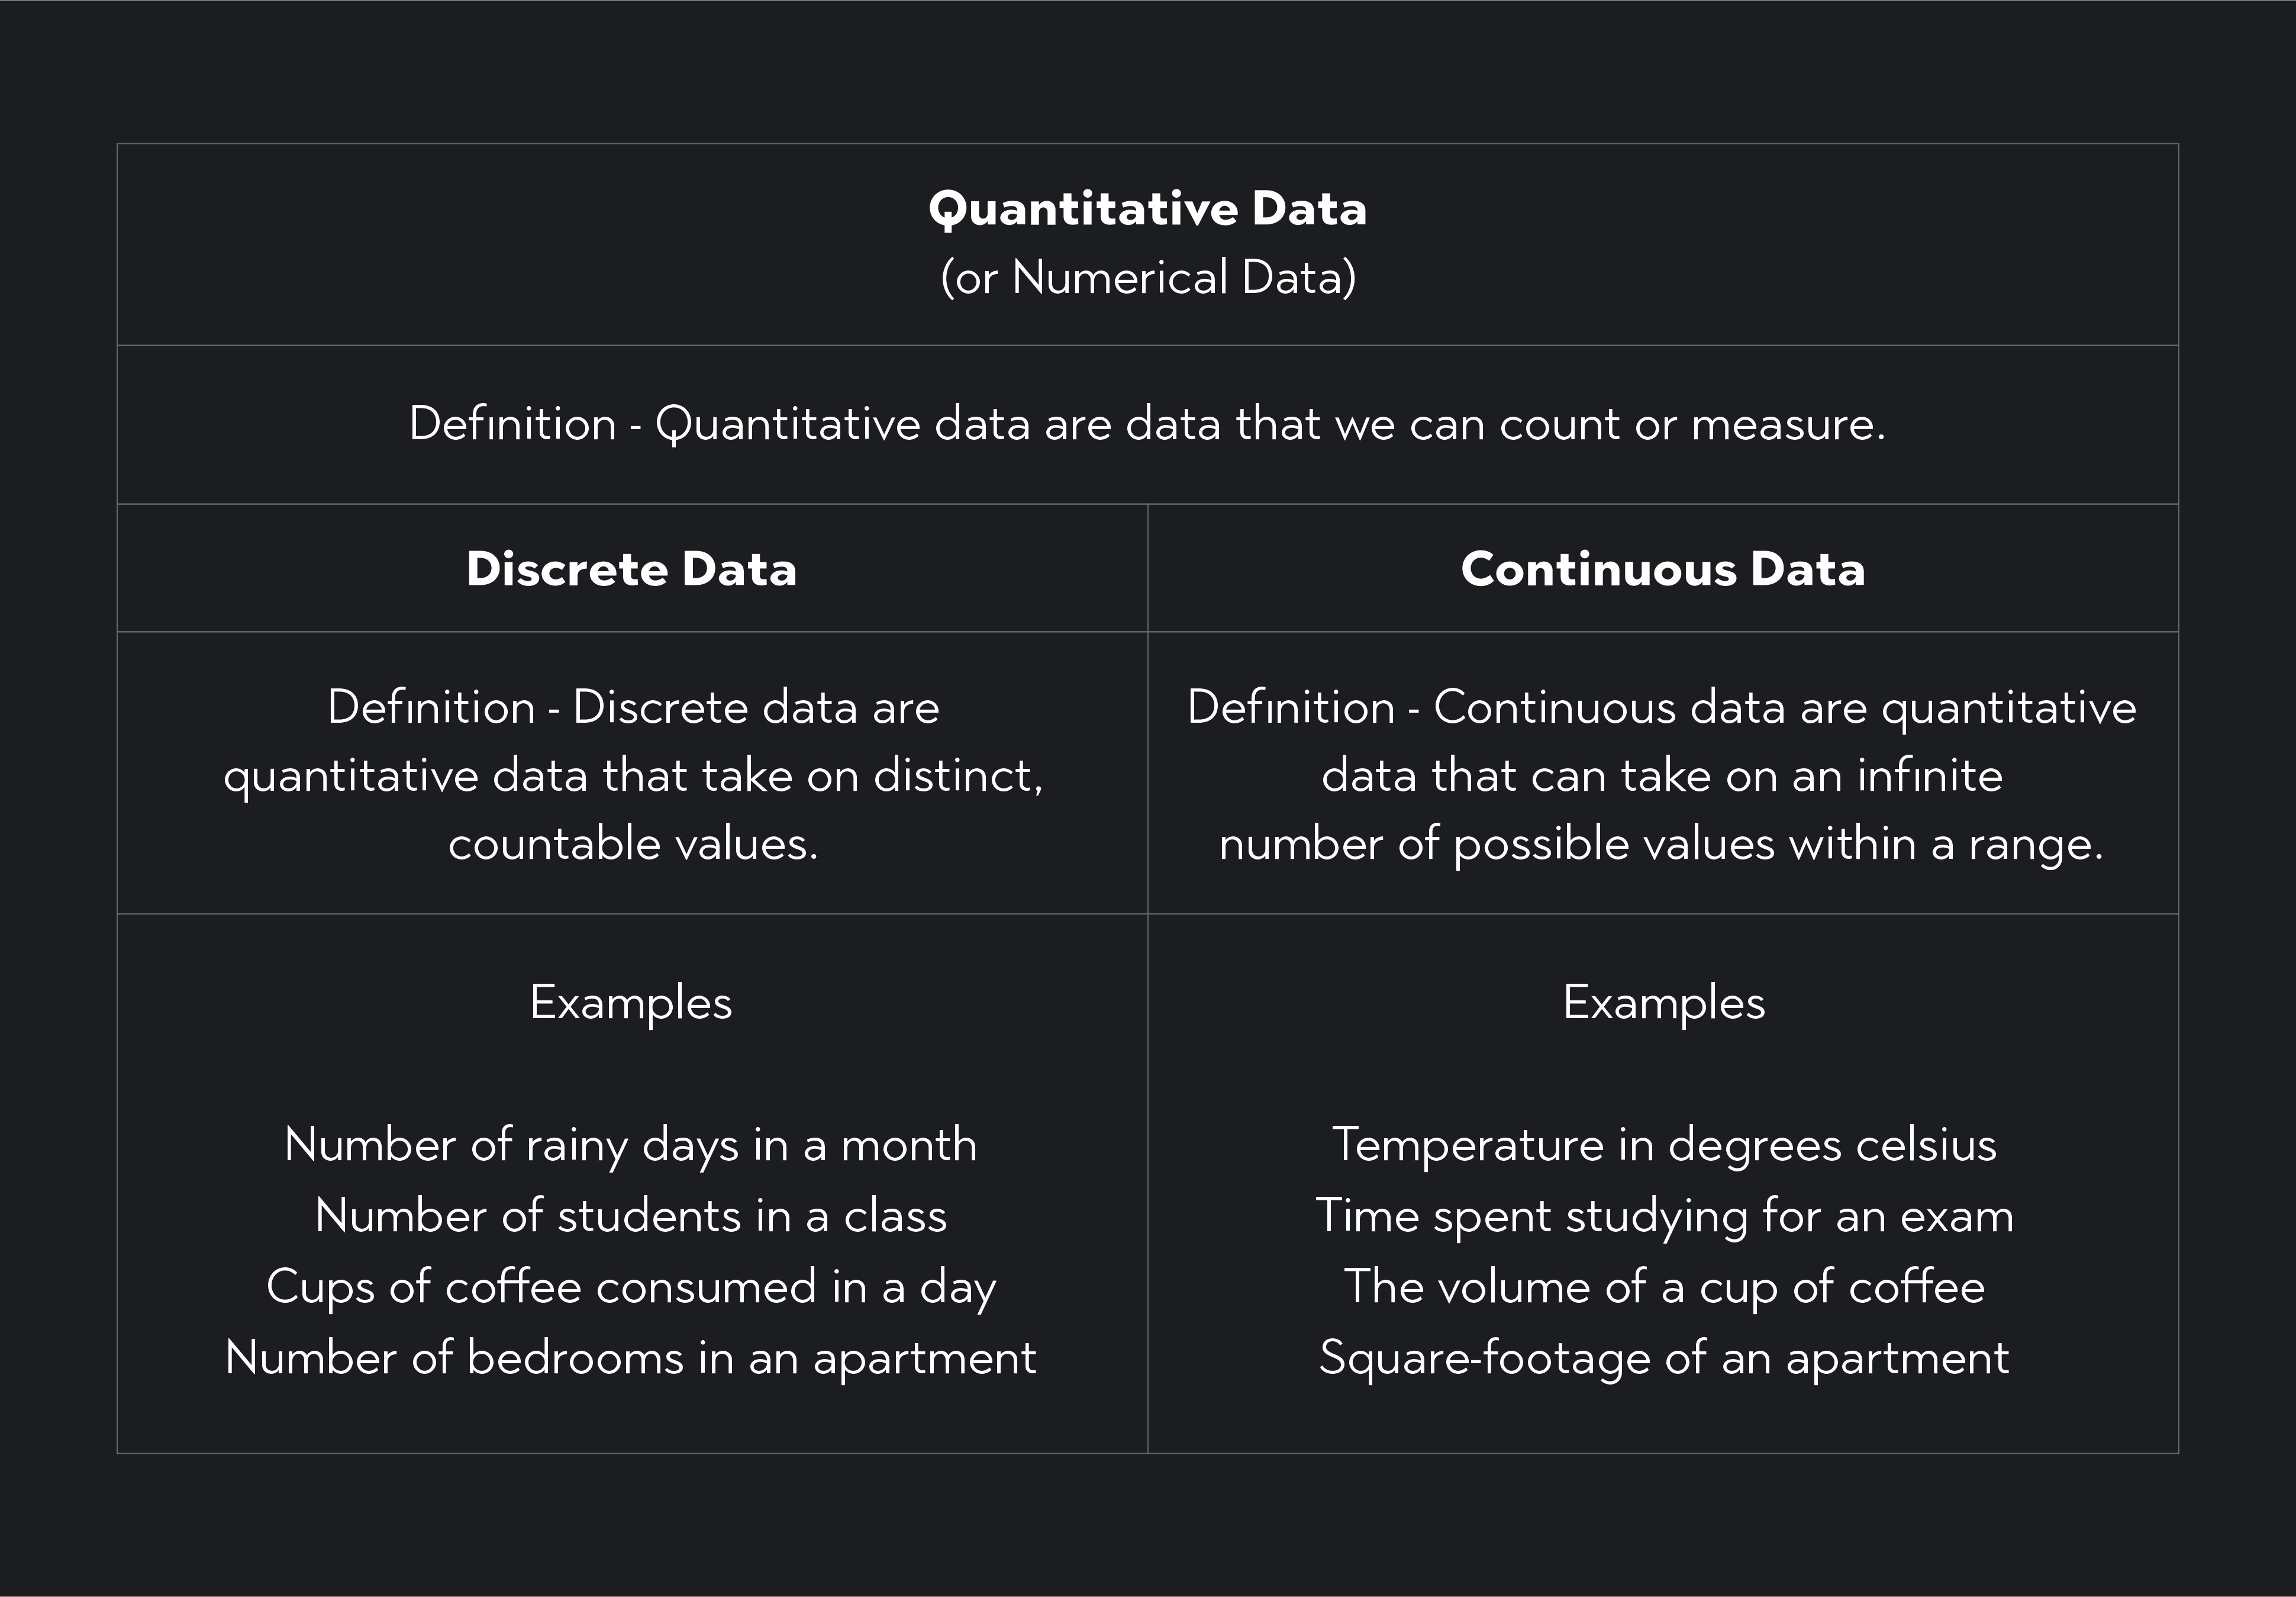
Quantitative Data (or Numerical Data)
Quantitative data consists of counts or measurements.
Discrete Data
Discrete data are quantitative data representing distinct countable values. Discrete data usually takes the form of whole numbers or integers.
Example - The number of customers who visit a coffee shop each hour.
Continuous Data
Continuous data are quantitative data where the data can take on decimals or fractional values. They represent measurements. Continuous data can take on an infinite set of values within a range. You usually need a measuring device like a stopwatch or scale to collect continuous data.
Example - The time it takes runners to complete a half-marathon.
What Is Qualitative Data?
The table describes qualitative data and provides some additional examples of the two types of qualitative data: nominal and ordinal
What Is Quantitative Data?
The table describes qualitative data and provides some additional examples of the two types of quantitative data: discrete and continuous.
FAQ About Data
What are the four different types of data in statistics?
The four main types of statistical data are:
Ordinal data
Nominal data
Discrete data
Continuous data
Ordinal and nominal data both fall under the category of qualitative (or categorical) data. Discrete and continuous data fall under the category of quantitative (or numerical) data.
Why are some numerical categories, such as travel advisory warnings, ordinal rather than discrete?
It’s easy to mistake some types of qualitative data with discrete numerical data. Certain types of qualitative data may take the form of a numerical value, but all that number does is classify your data into groups.
For example, the U.S. State Department issues travel advisory warnings on a scale of 1-4. Where Level 1 urges travelers to exercise some caution while traveling, and Level 4 urges people not to travel to certain destinations. These numbers are discrete values, but all they do is divide travel warnings into categories ranked by severity. The numbers do not count or measure anything.
Is age discrete or continuous?
Age is a good example of a continuous variable that is treated as a discrete variable. Technically, we can measure a person’s age in fractions of a year. This means a person’s age can take on an infinite number of possible values. However, we are typically only concerned with age measured in years; therefore, we treat age as a discrete variable.
What types of data visualizations can I use to represent qualitative and quantitative data?
Certain types of data visualizations, such as bar graphs, pie charts, and frequency tables, are particularly useful for visualizing qualitative data.
Histograms, dot plots, box plots, and frequency distributions are great for visualizing quantitative data.
Are proportions and percentiles qualitative or quantitative data?
Proportions and percentages are quantitative, but they can also bridge qualitative and quantitative data. Percentages allow you to convert qualitative values into quantitative values.
For example, say you have the political affiliation of 1000 voters. The political affiliation (Republican, Democrat, Independent) is a categorical variable, but by taking the proportion of voters who fall into each category, you can convert your data into a numerical variable.
What is the difference between experimental data versus observational data?
In addition to categorizing data as quantitative or qualitative, statisticians and data scientists also categorize data by data collection methods. Statistical data that has been collected through a carefully controlled randomized experiment is called experimental data. Data collected through passive observation are called observational data.
Explore Outlier's Award-Winning For-Credit Courses
Outlier (from the co-founder of MasterClass) has brought together some of the world's best instructors, game designers, and filmmakers to create the future of online college.
Check out these related courses: