
Statistics
What Is a Residual in Stats?
This article gives a quick definition of what’s a residual equation, the best way to read it, and how to use it with proper statistical models.
Sarah Thomas
Subject Matter Expert

Statistics
02.24.2022 • 10 min read
Subject Matter Expert
This overview is about negative correlation, its definition, its importance, how to determine it, and differences between positive and zero correlation.
In This Article
Take Intro to Statistics Online with Outlier.org
From the co-founder of MasterClass, earn transferable college credits from the University of Pittsburgh (a top 50 global school). The world's best online college courses for 50% less than a traditional college.
Get started
A negative correlation — also known as an inverse correlation — describes a relationship between two variables that tend to move in opposite directions. When two variables are negatively correlated, a higher value of one is associated with a lower value of the other and vice versa.
Covid cases and air travel
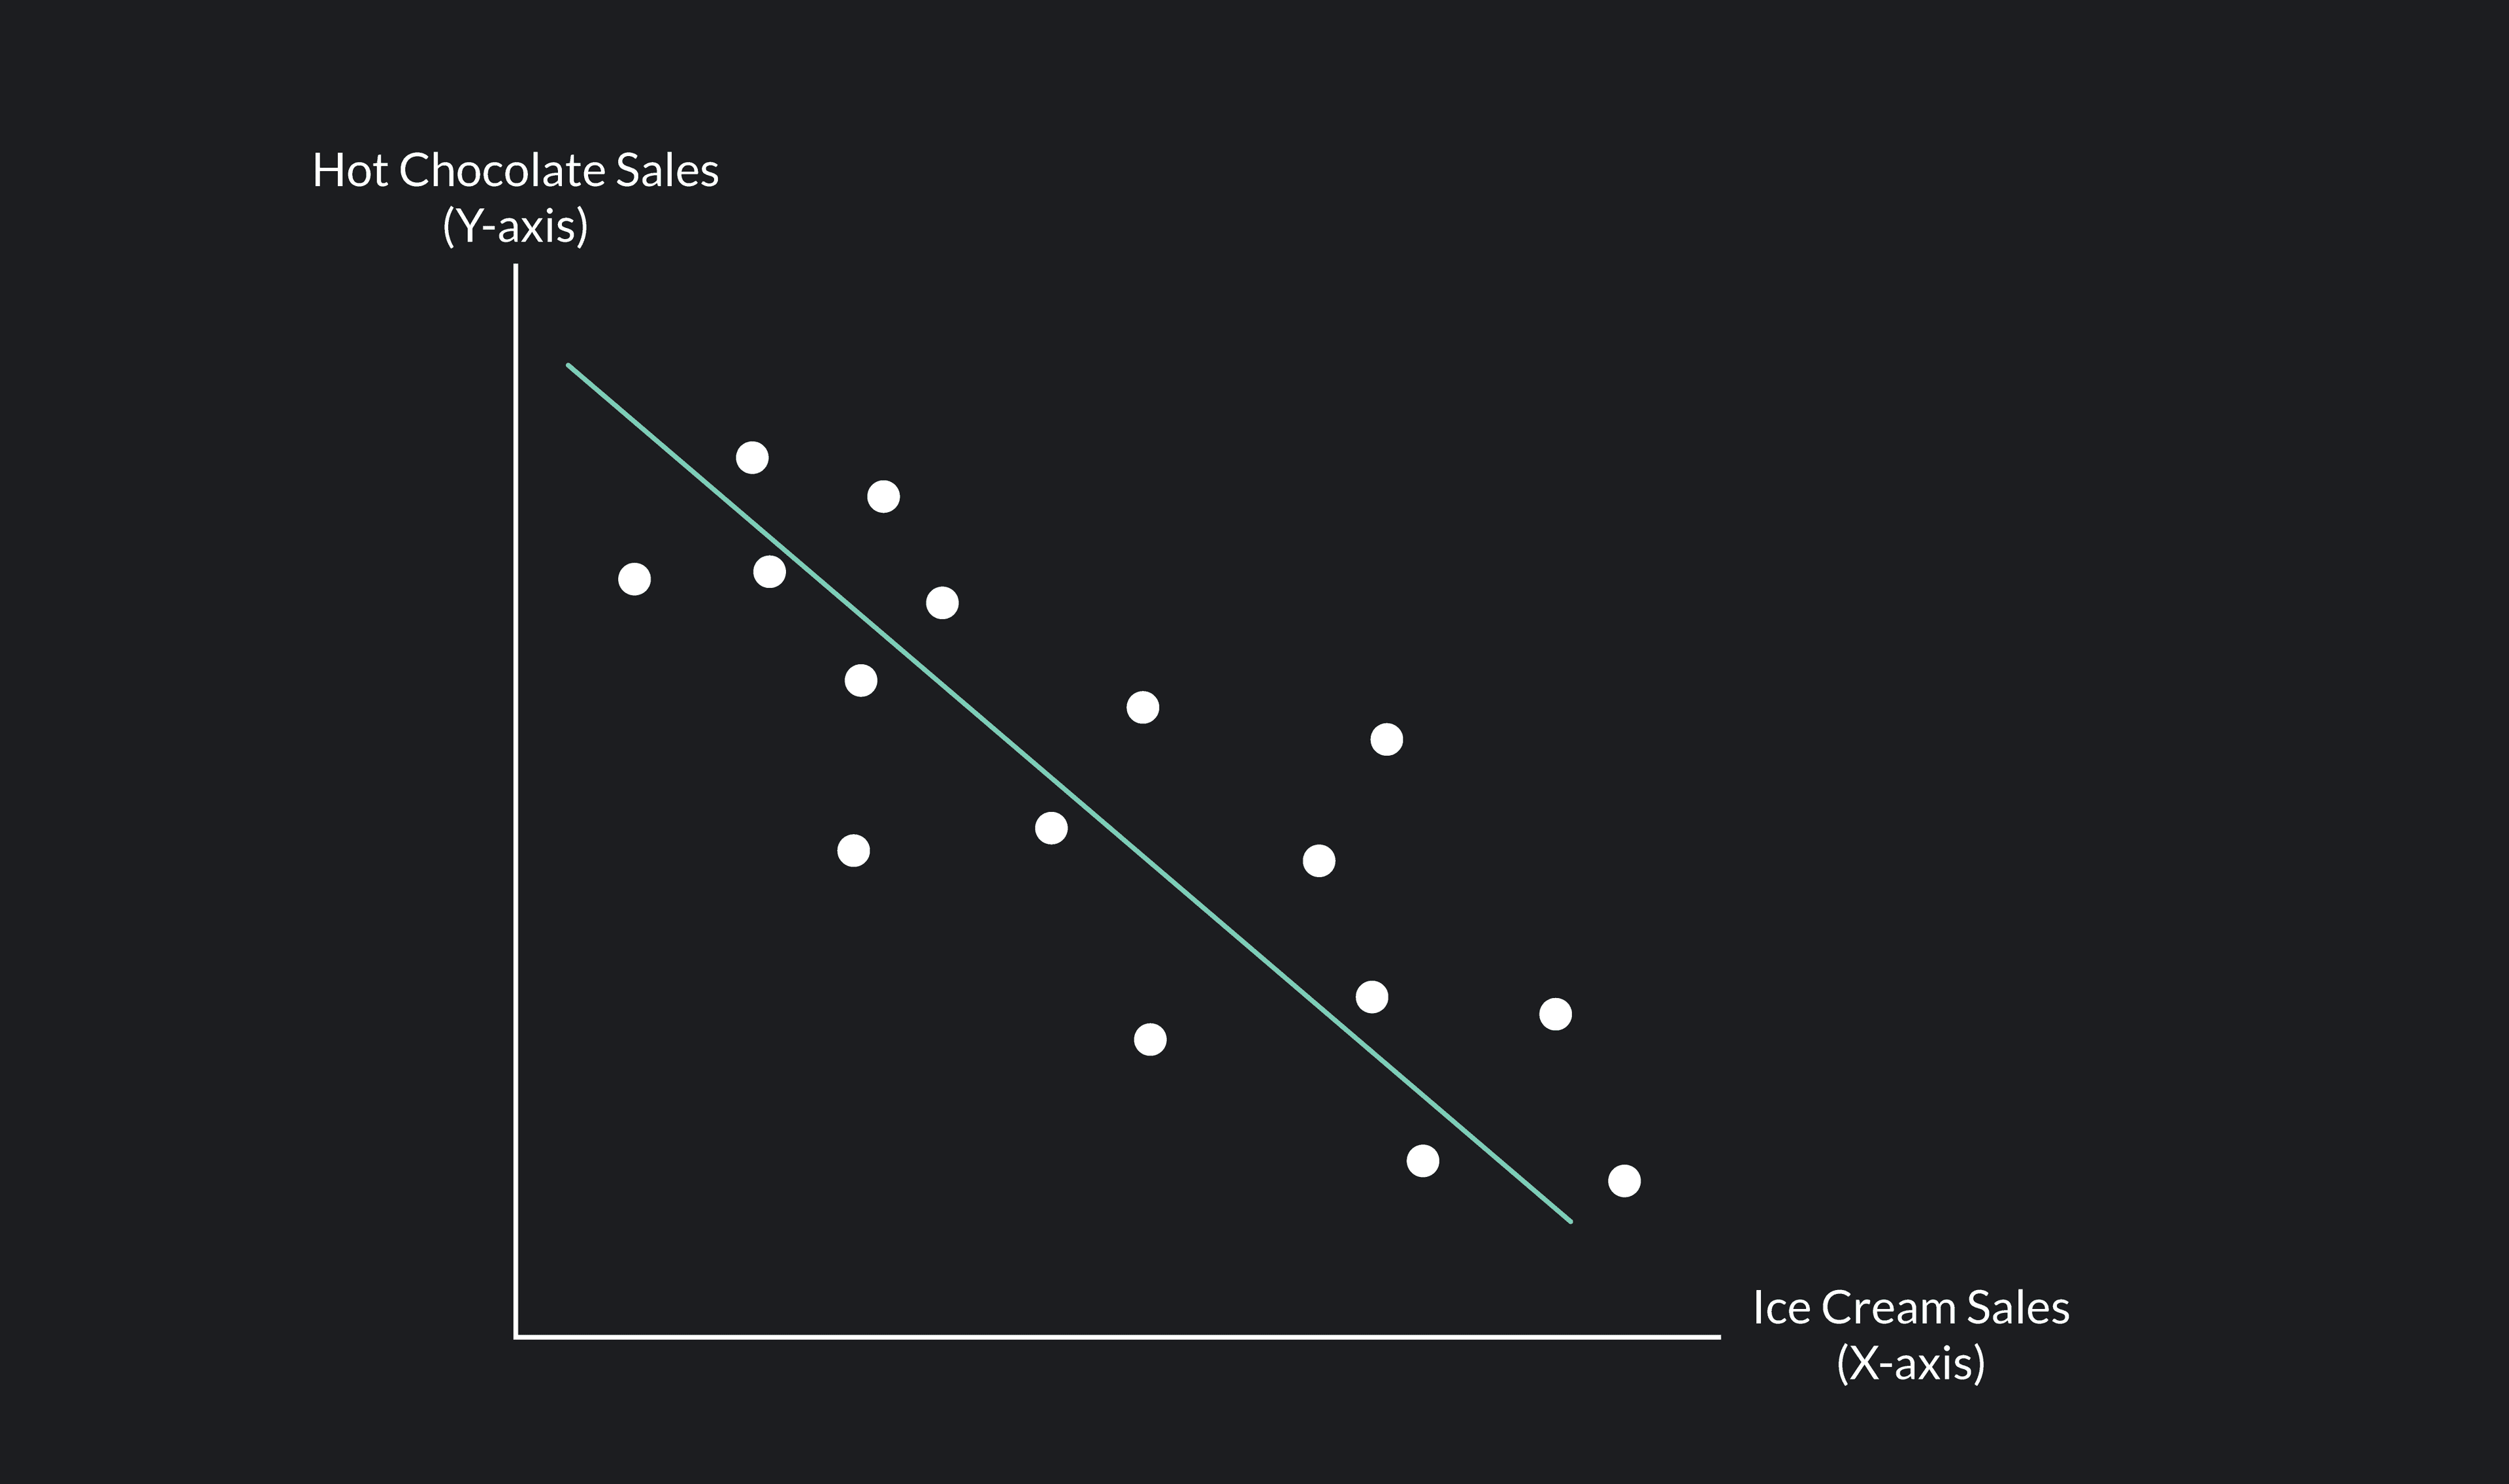
Ice cream sales and hot chocolate sales
Hours spent NOT studying for an exam and performance on an exam
Exercise and body fat
A negative correlation does not imply that one variable causes a change in the other. While this could be the case, it could also be the case that some third variable explains the correlation. It could even be that the correlation occurs by chance and not because of any causal factors.
Consider two of the examples from above. In the negative correlation between Covid cases and air travel, the number of COVID cases has a causal effect on air travel. The prevalence of COVID makes people less inclined to book a flight. In the case of ice cream and hot chocolate sales, however, nothing about selling ice cream causes the sale of hot chocolate to fall. Instead, a third factor, temperature, is responsible for the negative correlation. The temperature has a causal effect on the sale of both items. People crave more hot chocolate and less ice cream when temperatures are low, and people crave more ice cream and less hot chocolate when temperatures are high.
Remember, just because two things are correlated does not mean that one causes the other. Correlation does not imply causation! A correlation simply establishes an observable association between two variables.
A great way to visualize correlations is with a scatter plot. A scatter plot is a graph that plots the value of one variable measured along the y-axis in relation to values of another variable measured along the x-axis.
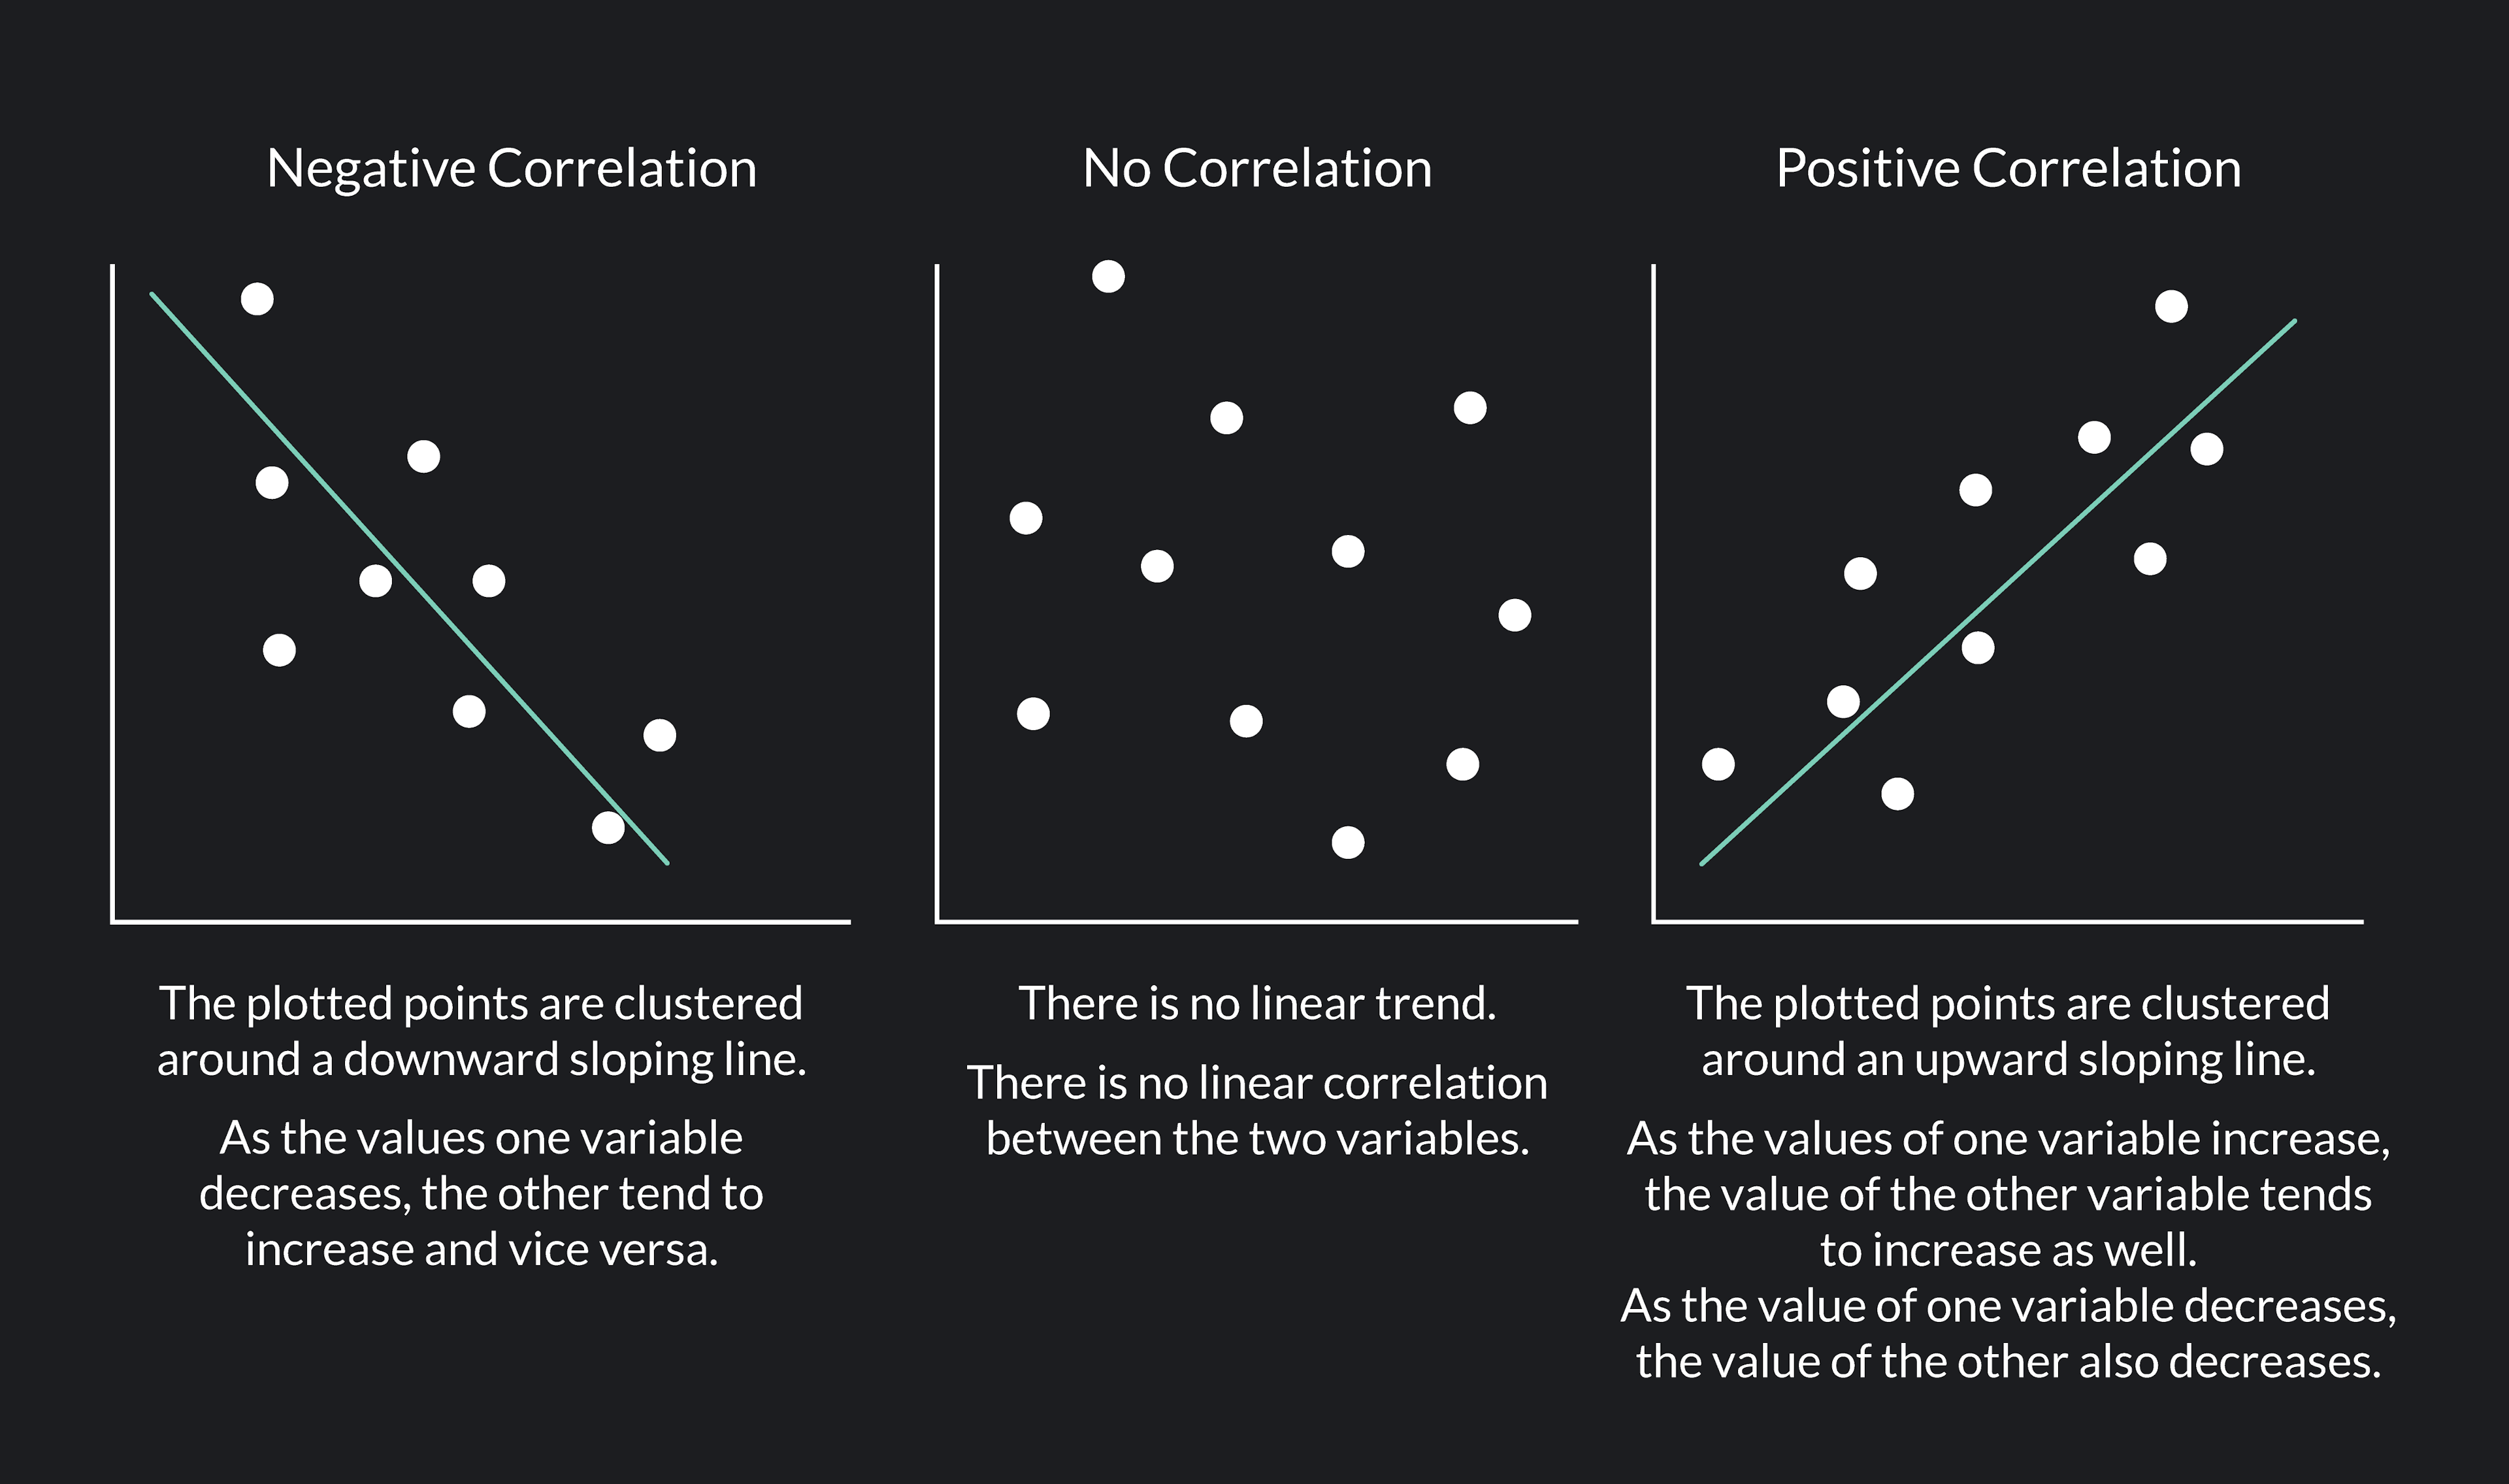
When two variables are negatively correlated, the plotted points will be clustered around a downward sloping line. Why? Because higher values of the good on the y-axis are associated with lower values of the good on the x-axis, and lower values of the good on the y-axis are associated with higher values of the good on the x-axis.
Negative correlations are just one type of correlation. Correlations can be positive, equal to zero, or negative.
While a negative correlation indicates that two variables tend to move in opposite directions, a positive correlation means that two variables tend to move in the same direction (think ice cream sales and popsicle sales). If two variables are positively correlated, higher values of one will be associated with higher values of the other and vice versa. A zero correlation (or no correlation) indicates no observable relationship between the two variables.
When two variables are positively correlated, their values will be clustered around an upward-sloping line on a scatter plot. If the two variables are not correlated, there will be no line of best fit that you can draw to show a linear trend in the plotted points.
Negative correlations, and correlations more generally, are important because they improve our ability to estimate and predict things. If two variables are correlated, knowing something about one gives you valuable information about the other.
As an illustration, suppose you are a doctor who knows there is a well-established negative correlation between a person’s daily minutes of cardiovascular exercise and the risk of suffering a particular heart disease. Knowing this correlation allows you to diagnose your patients better. By learning about your patients’ exercise habits, you are better able to assess which patients are at a higher risk of having the disease.
If two variables are not correlated, knowing the value of one of the variables tells you nothing about the value of the other.
Correlation is measured on a scale from -1 to 1. A correlation that is less than 0 and greater than or equal to -1 is a negative correlation. A correlation equal to 0 is a zero correlation, and a correlation greater than zero or less than or equal to 1 is a positive correlation.
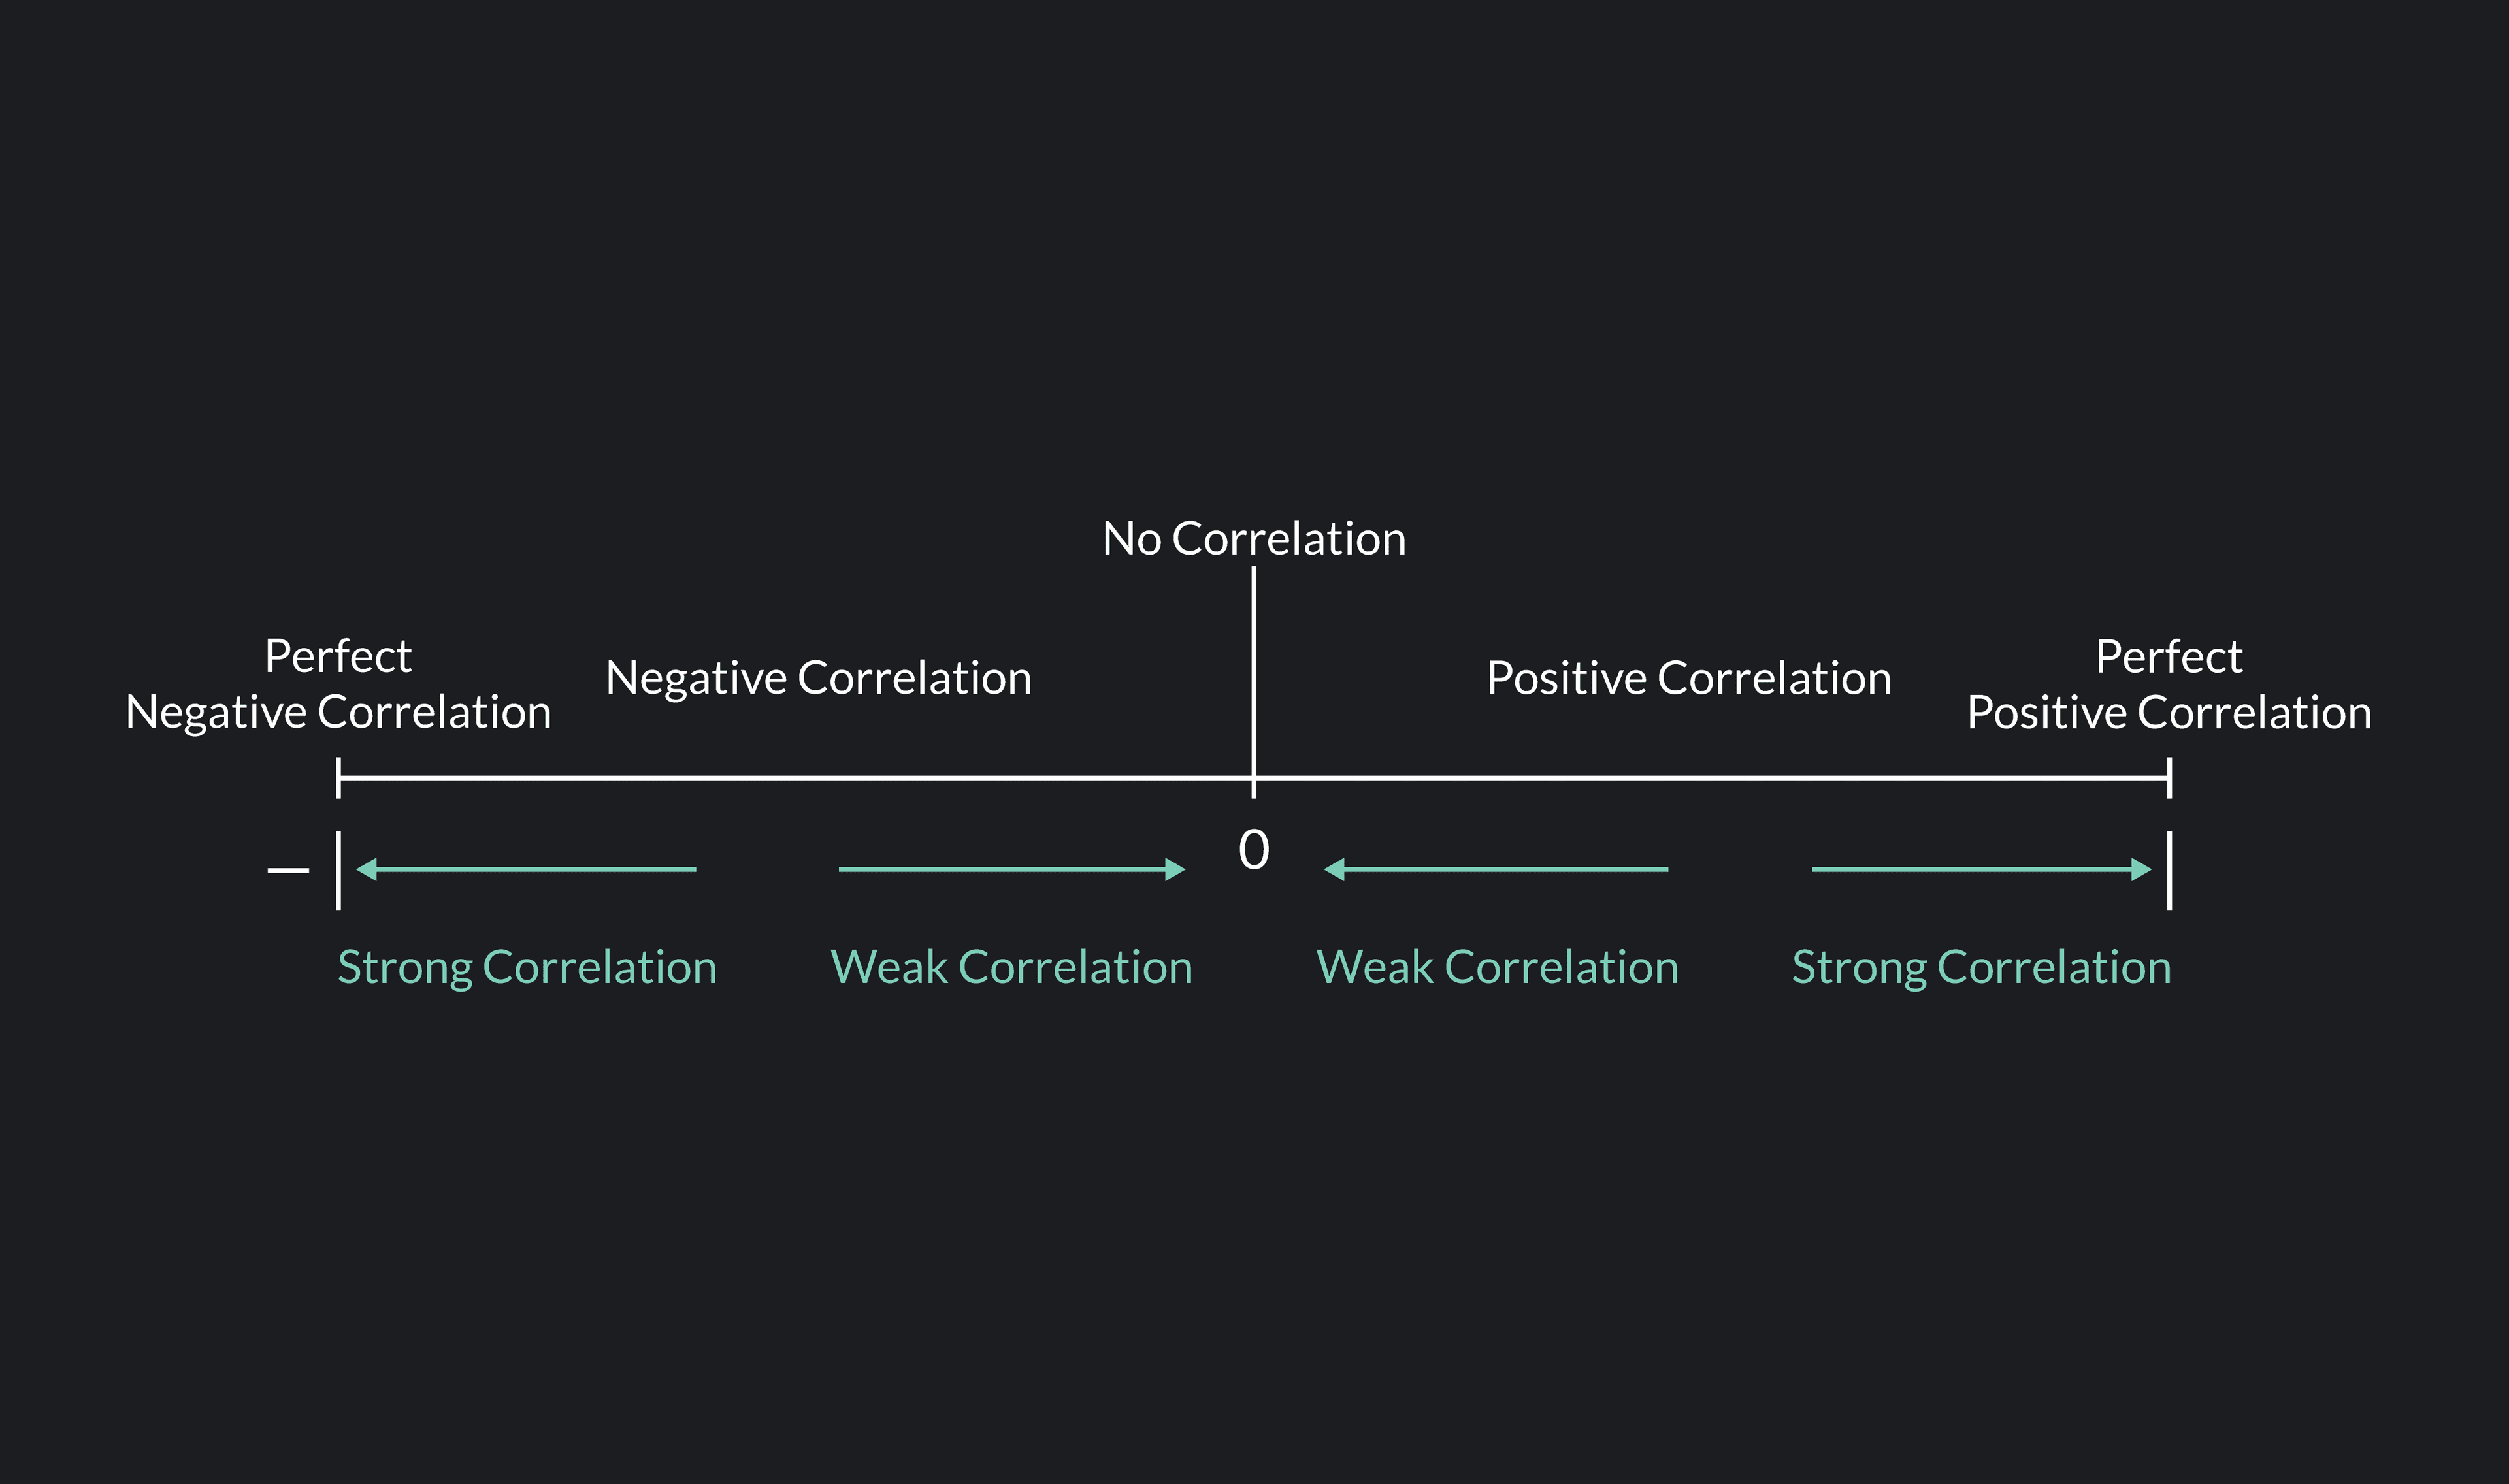
In addition to being positive, negative, or zero, correlations can be strong or weak. The closer a correlation is to -1 or 1, the stronger the correlation is. The closer a correlation is to 0, the weaker it is. A strong correlation means that the association between the two variables is strong and that your ability to estimate the value of one variable based on the value of the other is better than if the correlation was weaker.
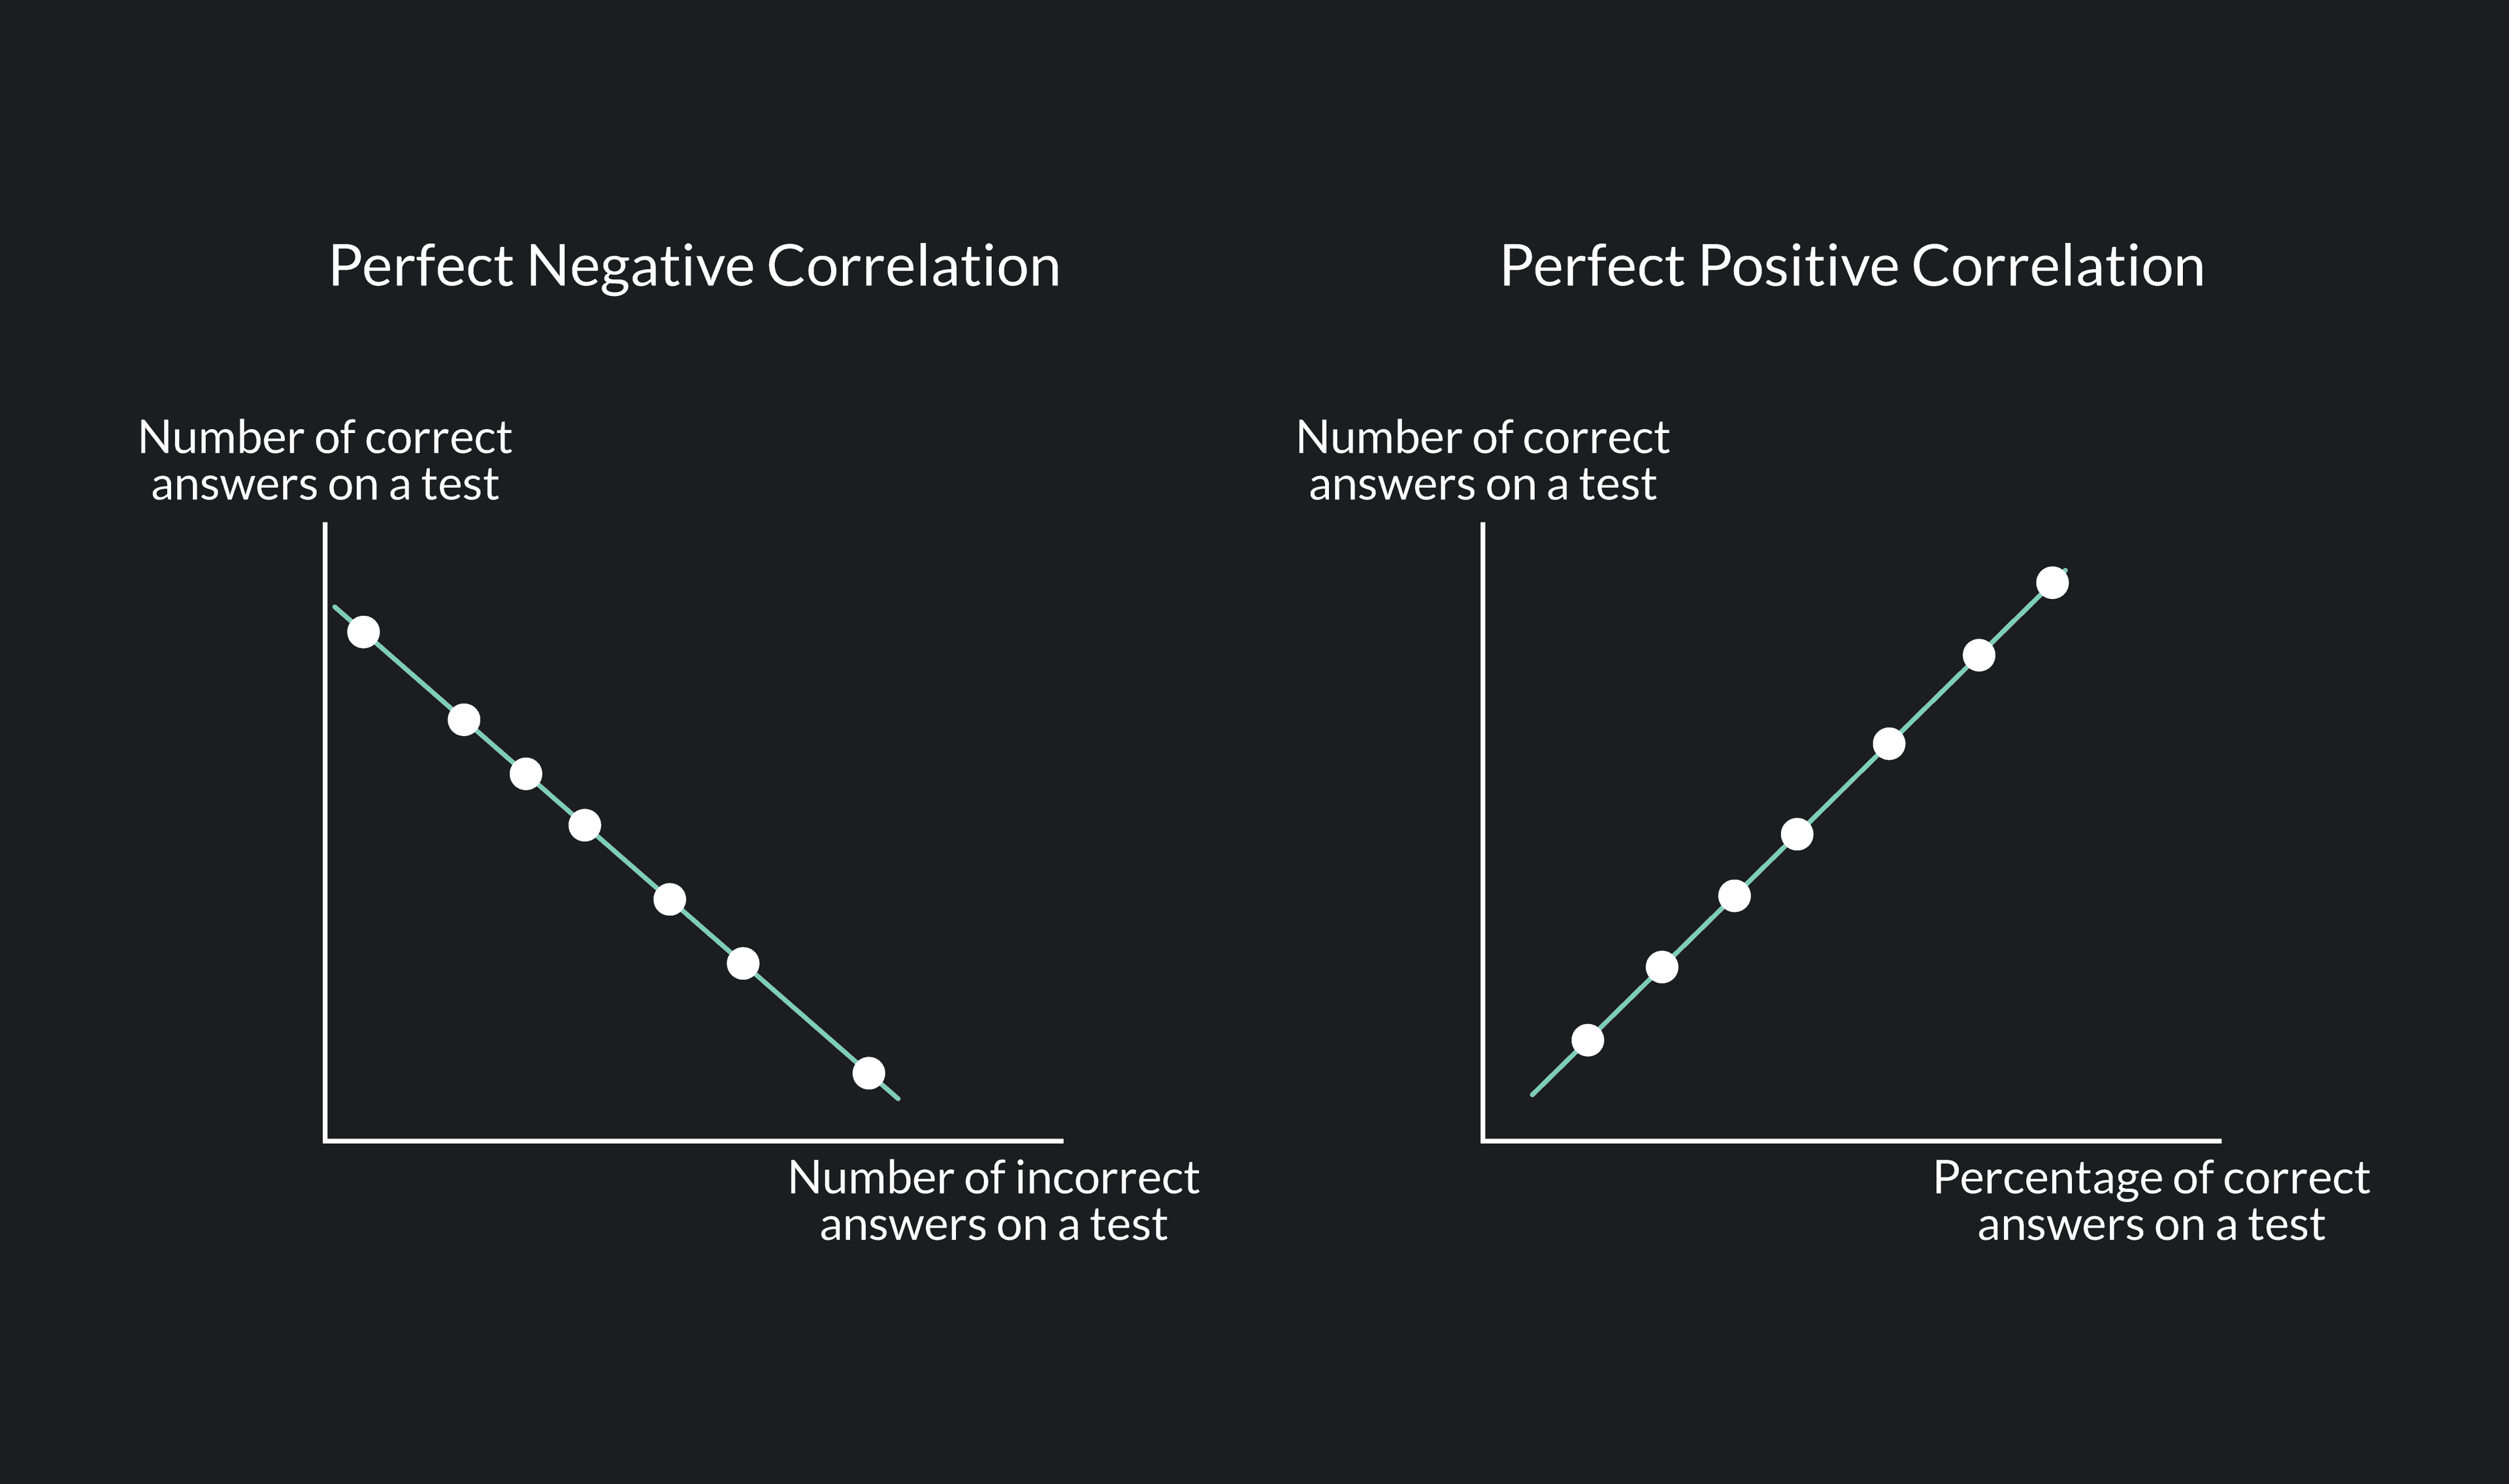
A correlation of -1 is called a perfect negative correlation, and a correlation of 1 is called a perfect positive correlation. A perfect correlation, though rare, is the strongest type of correlation you can observe. When a correlation is perfect, knowing one variable allows you to predict the value of the other perfectly. As an example, think of a test that has 100 questions. The number of correct answers a student gets on the test and the number of incorrect answers the student has on the test is an example of a perfect negative correlation. If you know a student got 70 out of 100 questions correct, you know for sure that the student got 30 questions wrong!
On a scatter plot, the points of two perfectly correlated variables will not be clustered around a line of best fit. Instead, every point falls exactly on the line.
The most common measure of correlation is the Pearson correlation coefficient. The Pearson correlation coefficient (often just called the correlation coefficient) is denoted by the Greek letter rho (⍴) when calculated for a population and by the lower-case letter r when calculated for a sample.
There are many ways to calculate the Pearson correlation coefficient. Here we will cover two methods for calculating the Pearson correlation coefficient for a sample. Both methods will give you the same result.
The first way to calculate the Pearson correlation coefficient is to divide the covariance of x and y by the product of the standard deviation of x and the standard deviation of y.
Where is the correlation coefficient for two variables and
cov(X,Y) is the sample covariance between and
is the sample standard deviation of
is the sample standard deviation of
The sample covariance between the price of two stocks is -8. The sample standard deviation of the price of the first stock is 5, and the sample standard deviation of the price of the second stock is 16.
Use the correlation coefficient equation from above to calculate the correlation coefficient for these two stocks. Is the correlation positive or negative? Is it a strong or weak correlation?
The correlation between the two stocks is -0.1. This is a weak negative correlation.
The second way to calculate the Pearson correlation coefficient is to take the average of the sum of the cross-product of the Z-scores of and . When calculating a sample correlation coefficient, we must divide the sum of the cross product by -1 (the sample size minus one) rather than dividing by .
Where is the correlation coefficient for two variables and
∑ is the sum of the product of and for every data point (x,y)
is the Z-score of a value of
is the Z-score of a value of
is the sample size
Calculate the sample correlation coefficient for and .
The table shows the values of and drawn from a sample of 5 (n=5).
Use the information in the table and the equation from Method 2 to find the Pearson correlation coefficient for and . Is the correlation positive or negative? Is it a strong or weak correlation?
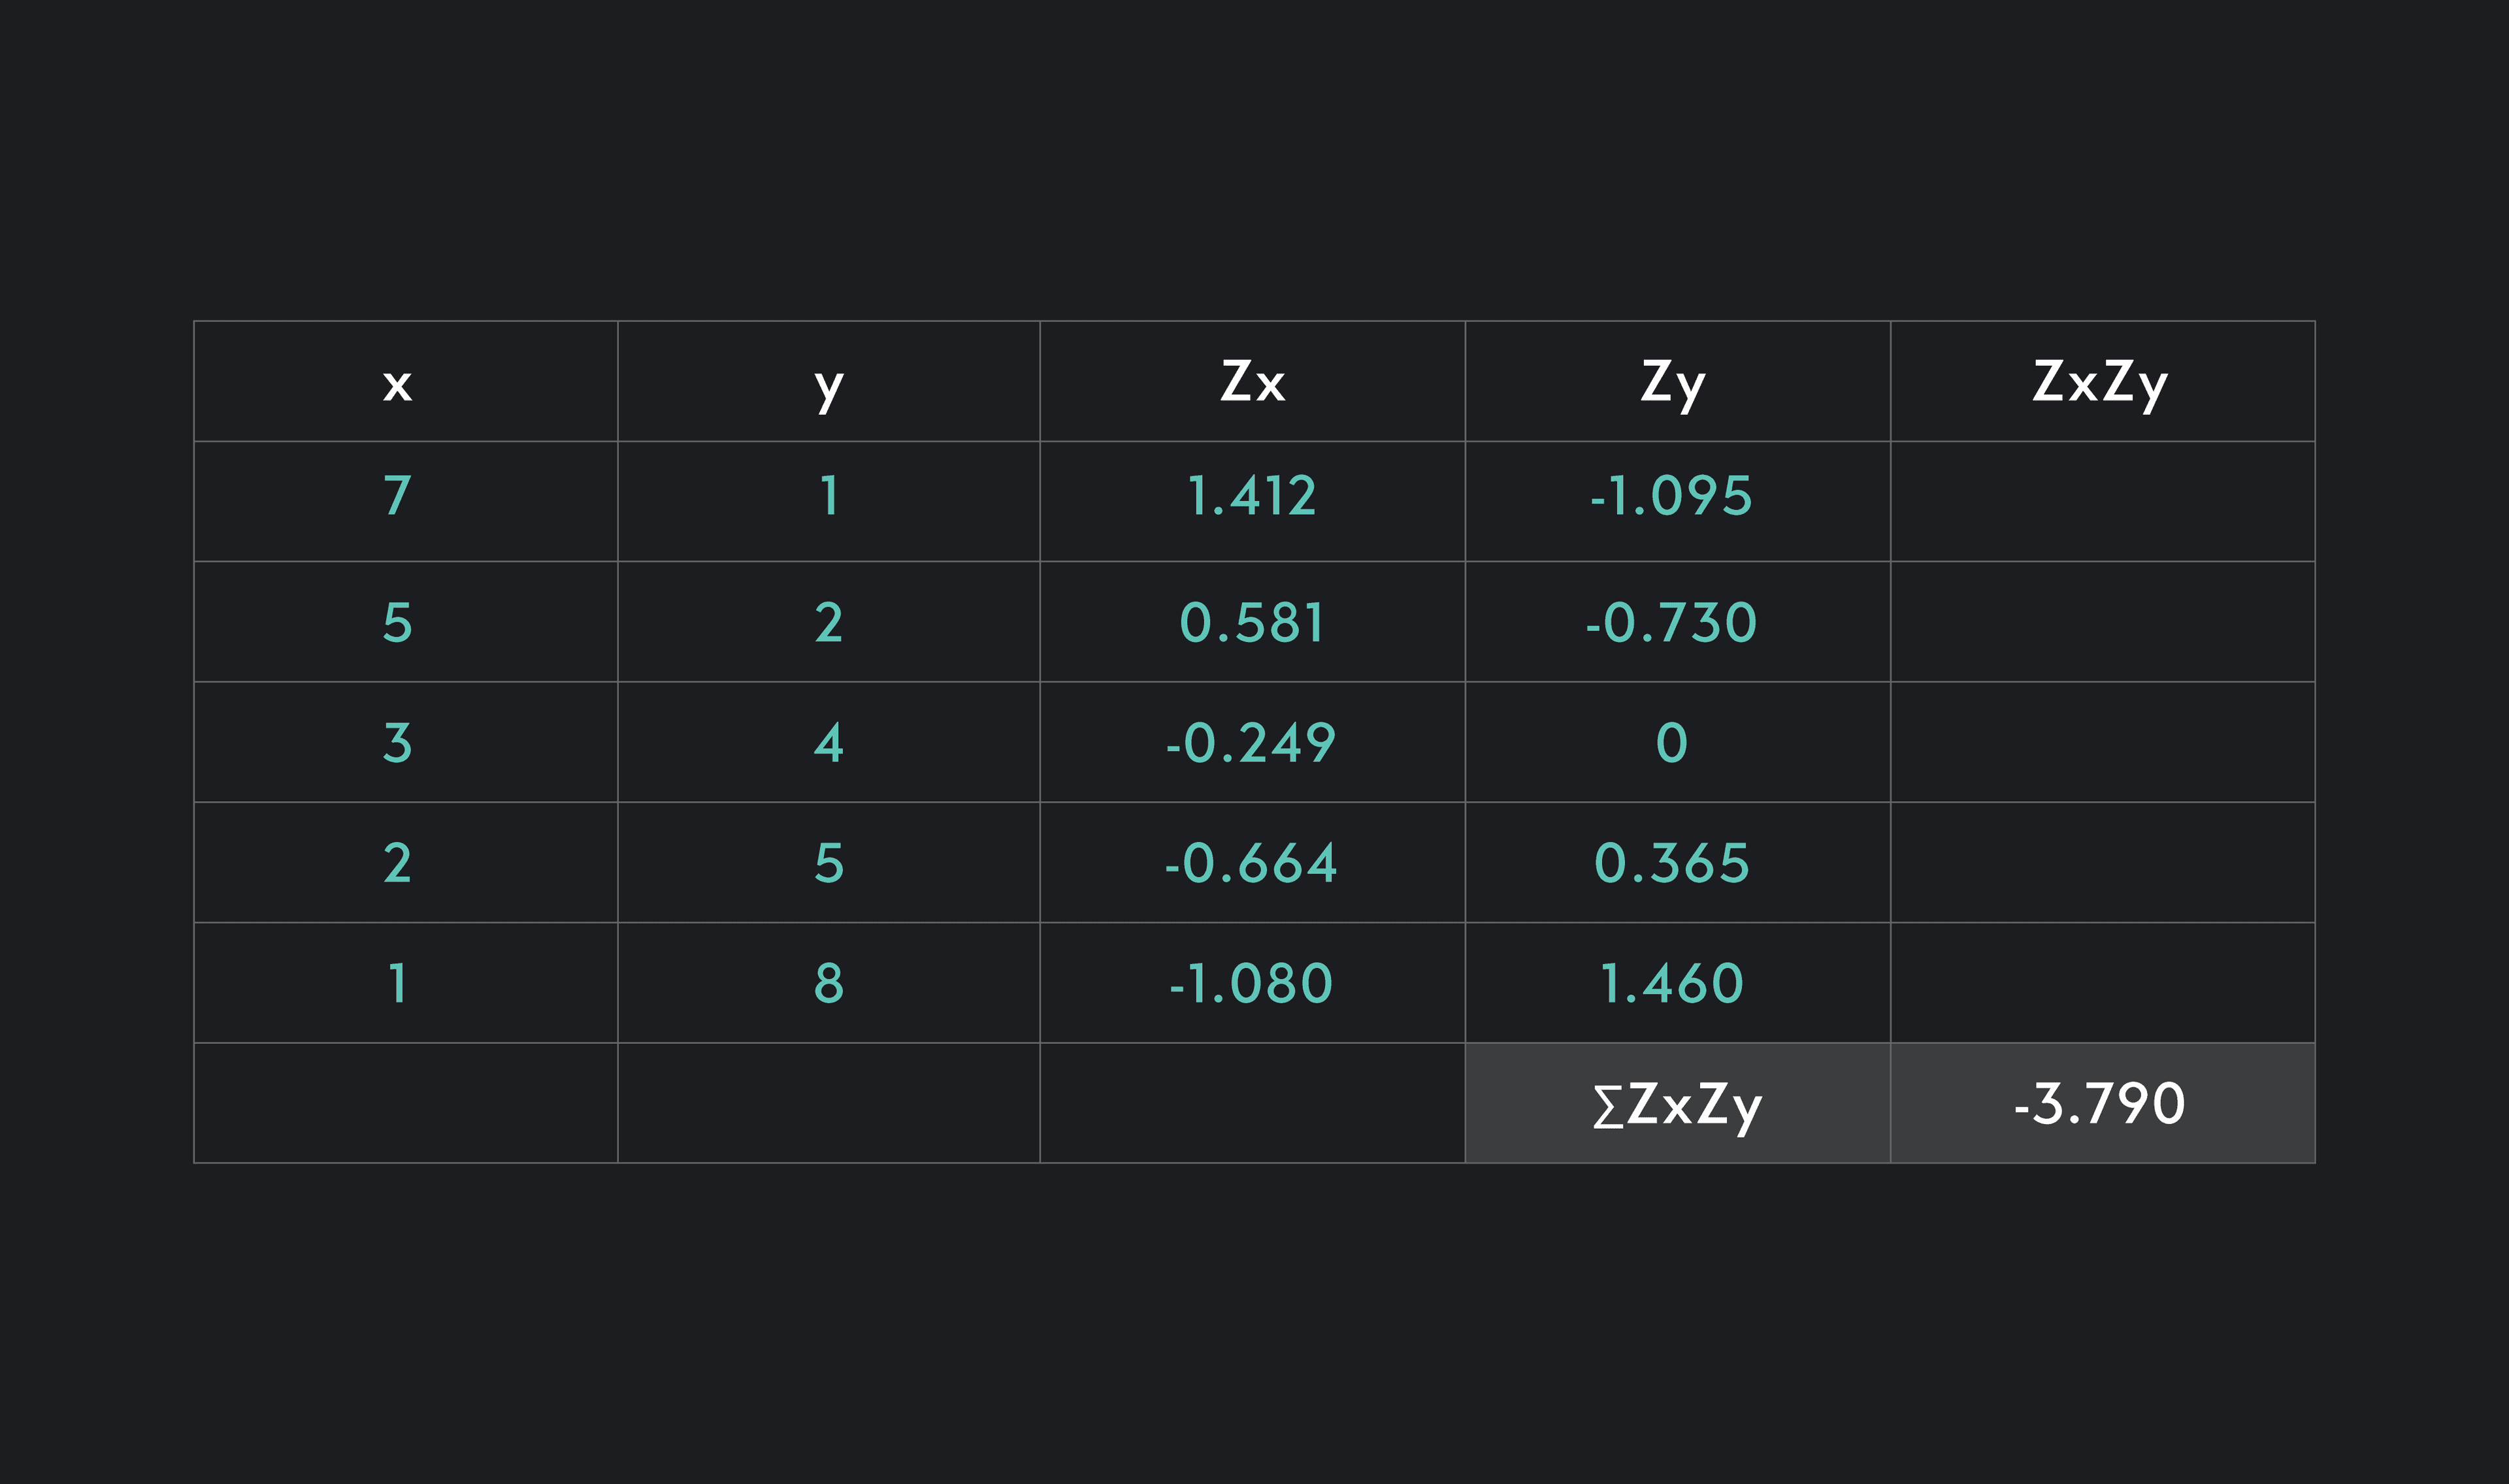
The table provides us with the values of and and the Z-scores for each of the values of and .
The first step to finding the correlation coefficient is finding the Z-scores’ product (). To do this, you can fill out the last column of the table.
You should find that the five values from top to bottom are:
-1.547
-0.425
0
-0.243
-1.577
Next, you need to sum the values you found in Step 1 to find the sum . If you do this, you should get the value in the bottom-right cell of the table = -3.790.
Now that you have the sum of the cross product of the Z-scores, all you need to do is divide by -1. Since the sample size in this problem is 5, -1 is equal to 4.
Answer: The correlation coefficient for and , , is equal to -0.948. This is a strong negative correlation.
While it’s important to understand how to calculate correlation, more often than not, you will be computing correlations using software.
To calculate correlations, use the formula =CORREL(Array1, Array 2)
As an example, say you have five values of x in cells A2 through A6 and five values of y in cells B2 through B6. To find the correlation between x and y, you would enter the following into an empty cell =CORREL(A2:A6, B2:B6).
To calculate correlations, first, create a table with your and values, labeling the variable and the variable . Once you have your table, use the command corr(, ) to find the correlation between your variables.
To calculate correlations in R , first, create two variables with your and values. Give each variable a name such as and , or chocolatesales and icecreamsales. Once you've stored your variables, use the function cor() to compute the correlation. If you named your variables and , you would type cor(x, y). If you named your variables chocolatesales and icecreamsales, you would type cor(chocolatesales, icecreamsales).
There are a number of factors that can affect your correlation coefficient and throw off your results such as:
Restriction of range
Non-linear relationships
AnnMaria De Mars explains:
Here are some examples of how negative correlations are used in real life.
In economics, there is an established negative correlation between inflation (the rate at which prices rise) and the unemployment rate (the percentage of the workforce out of a job). In an ideal world, we want to keep BOTH inflation and the unemployment rate low, but due to the inverse correlation between these two measures, economists and politicians often face a trade-off and must try to strike a good balance between pursuing low inflation and low unemployment.
In finance, investors might use negative correlations to balance and diversify their investments. If the growth in two investments is negatively correlated, an investor can hedge her bets by investing in both investments. If the value of one of her investments goes down, she is likely to see a positive return on the other.
In education, researchers often look for variables that are either positively or negatively correlated with student achievement and educational performance. These correlations help researchers pinpoint characteristics and interventions that are associated with better or worse academic performance. Once these correlations are established, researchers can try to determine if the correlations are causal and whether any further interventions can help improve educational outcomes.
In medicine, doctors and medical researchers use correlations to improve their understanding of disease and medical conditions. Certain medical conditions can be correlated with specific risk factors, symptoms, behaviors, or other diseases. Establishing correlations can help doctors diagnose, advise, and treat patients.
In sports, correlations can be used to assess the performance of individual athletes or teams. People who bet on sports might also look for correlations to place smarter bets.
Outlier (from the co-founder of MasterClass) has brought together some of the world's best instructors, game designers, and filmmakers to create the future of online college.
Check out these related courses:


Statistics
This article gives a quick definition of what’s a residual equation, the best way to read it, and how to use it with proper statistical models.
Subject Matter Expert

Statistics
The article explains what variance means, how to calculate it, how to use the formula and the main differences between variance and standard deviation.
Subject Matter Expert

Statistics
This article explains what a test statistic is, how to complete one with formulas, and how to find the value for t-tests.
Subject Matter Expert