
Statistics
What Is the Coefficient of Variation?
Learn all about the coefficient of variation. Included are explanations of the standard deviation and the mean as well as examples and common applications.
Sarah Thomas
Subject Matter Expert

Statistics
04.11.2023 • 6 min read
Subject Matter Expert
In this article learn what Pearson Correlation Coefficient is and the strength of association. Also, read about when to use it, how it’s calculated, and faqs.
In This Article
Pearson's correlation coefficient is a statistical measure that helps us determine the relationship between two variables. It is widely used in fields including finance, the social sciences, and the natural sciences.
In this article, we’ll discuss the concept of Pearson's correlation coefficient, how to calculate it, and how to interpret it.
In statistics, correlation is a measure of the relationship between two variables. Correlations can be positive, negative, or zero.
If two variables in your dataset, X and Y, have a positive correlation, it means they tend to move together in the same direction. As one variable increases, so does the other.
A negative correlation tells you the two variables tend to move in opposite directions. There is a negative relationship between the two variables. If X increases, Y tends to decrease, and vice versa.
A zero correlation means no observable association between variables x and y.
Always remember that correlation is distinct from causation. When two variables are correlated, you cannot conclude that one of the variables causes the other to change. To establish causation, you need additional evidence and information.
If you want to learn more why correlation does not mean causation, here’s a short lesson:

The Pearson correlation coefficient is one of the most common methods for measuring correlation. You might also hear this term being called Pearson’s r, a bivariate correlation, the Pearson product-moment correlation coefficient (PPMCC), or just, the correlation coefficient for short.
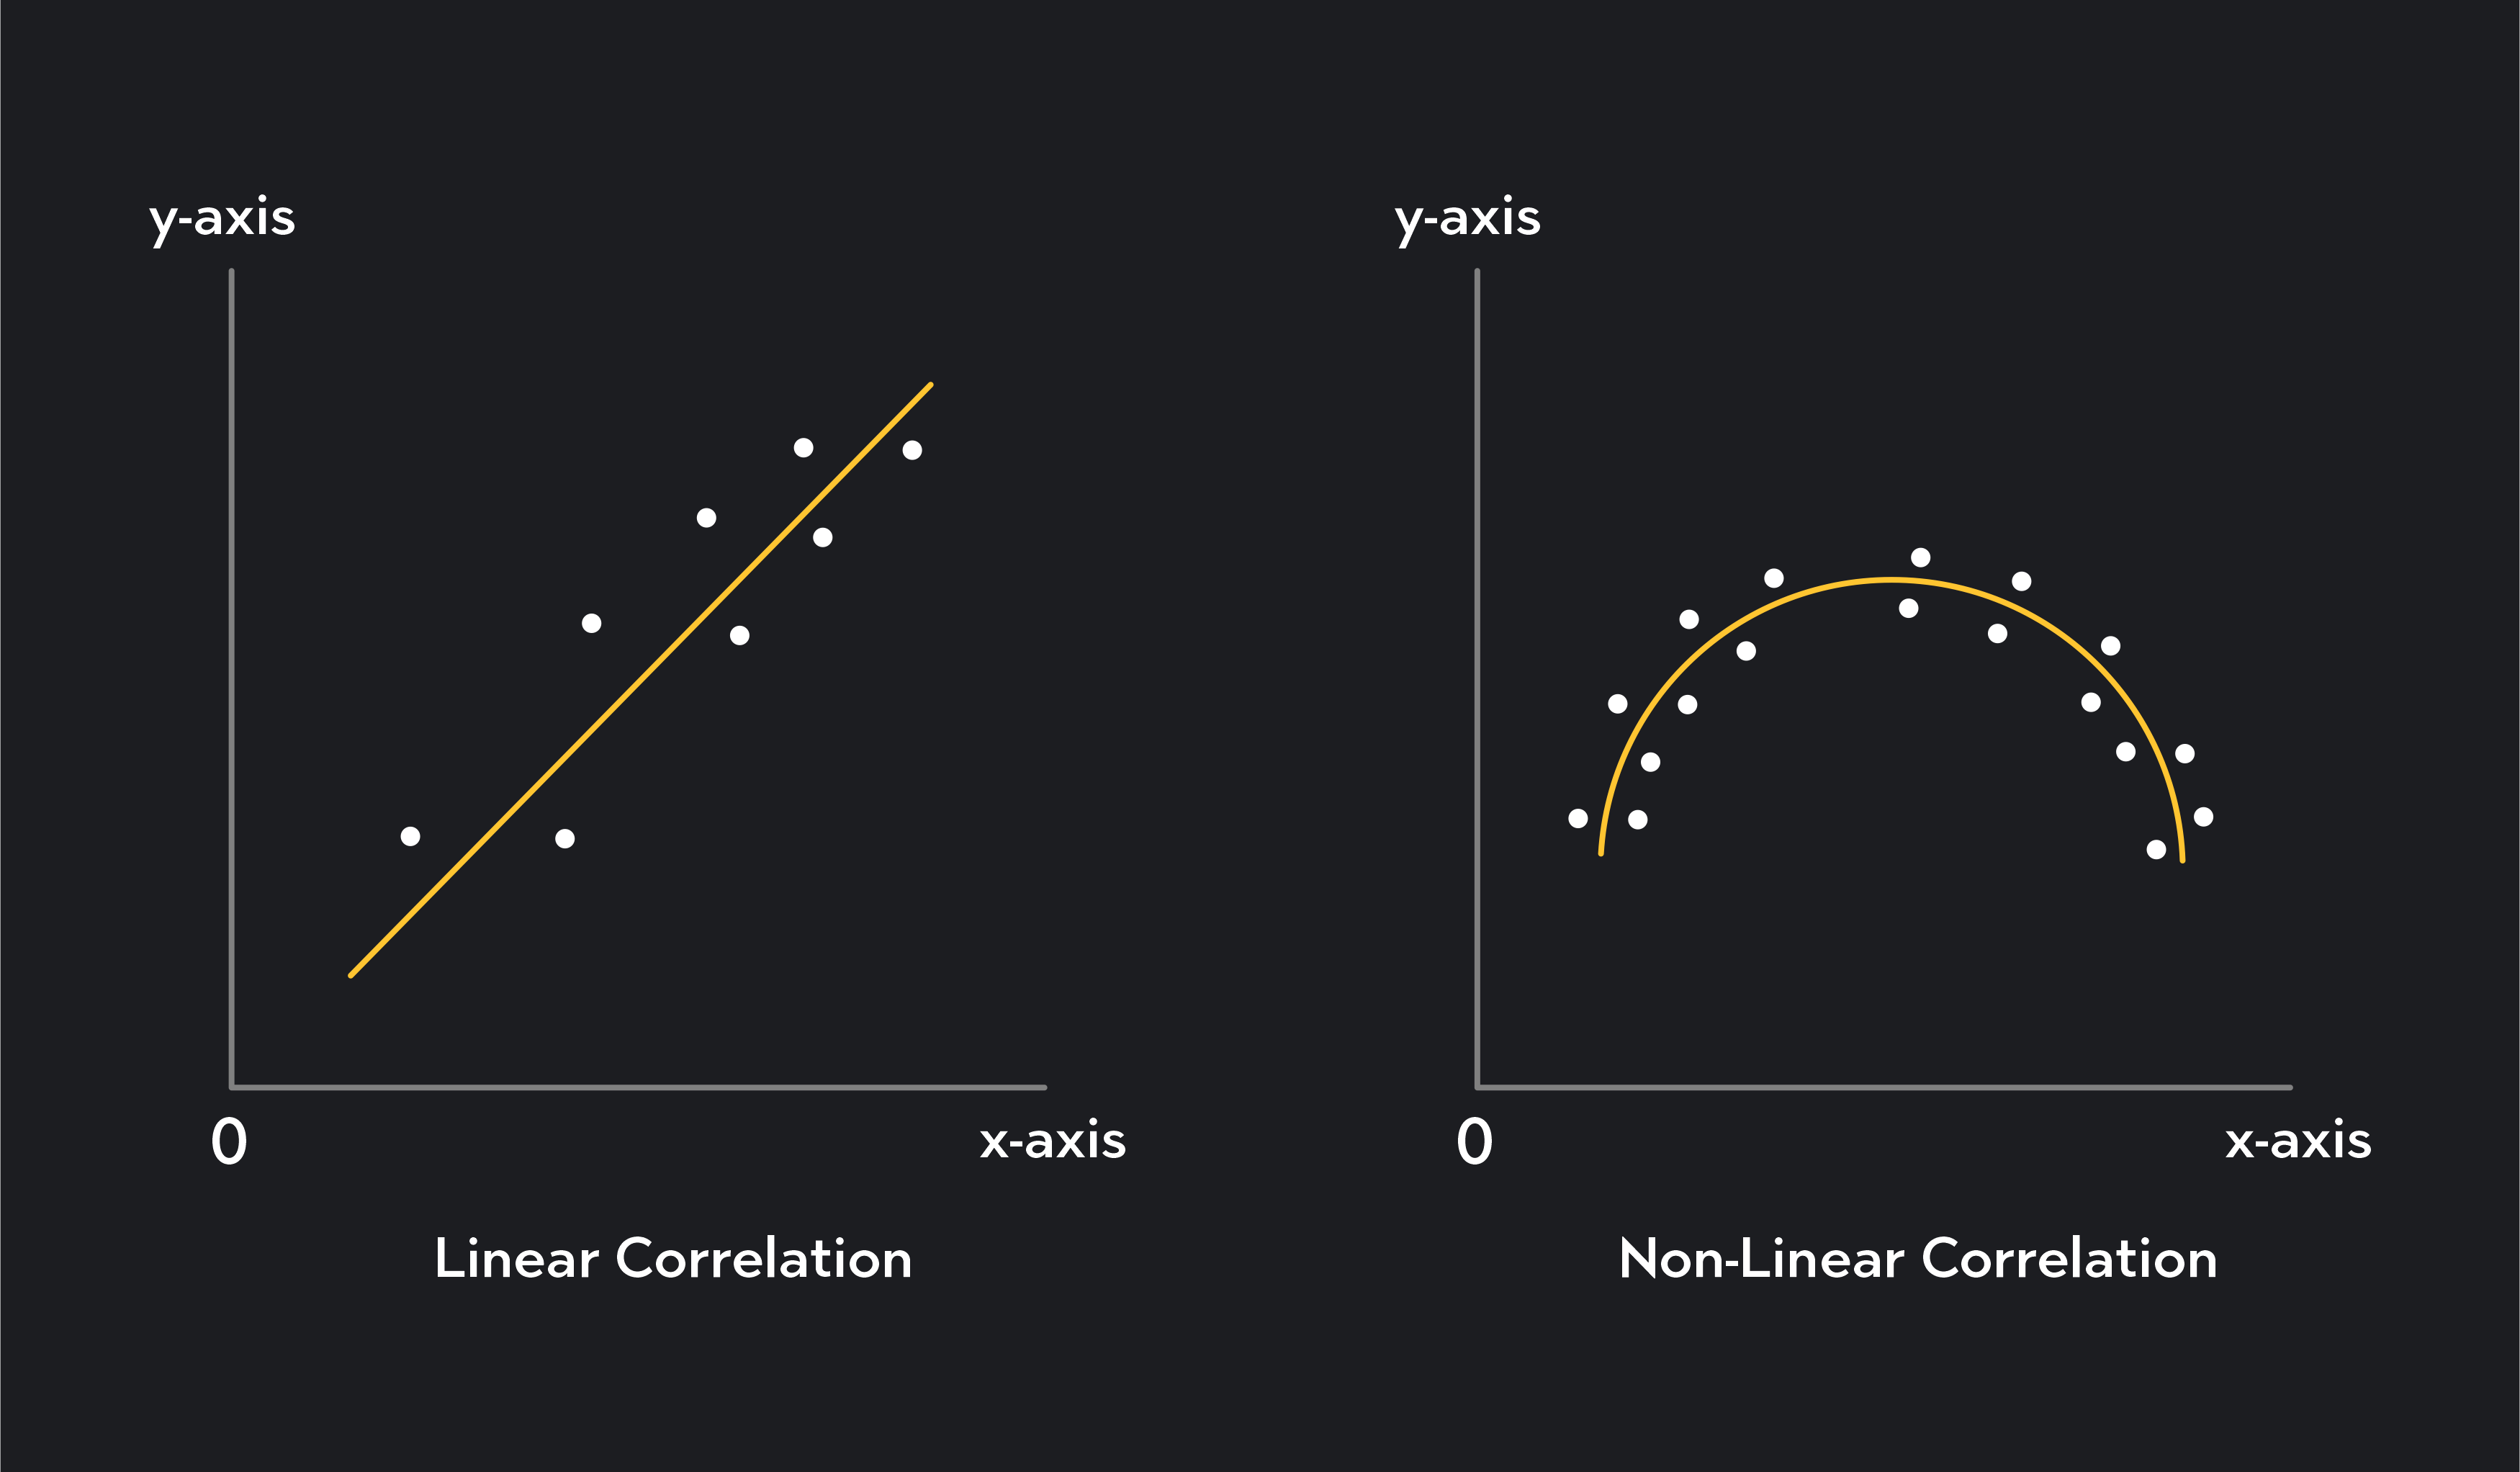
A Pearson correlation coefficient measures a linear correlation's direction and magnitude. A linear association—as opposed to a non-linear one—is a correlation approximated by a straight line, where the change in one variable is approximately proportional to the observed change in the second variable.
A linear correlation is strictly positive or negative, whereas a non-linear correlation can change with the values of x and y.
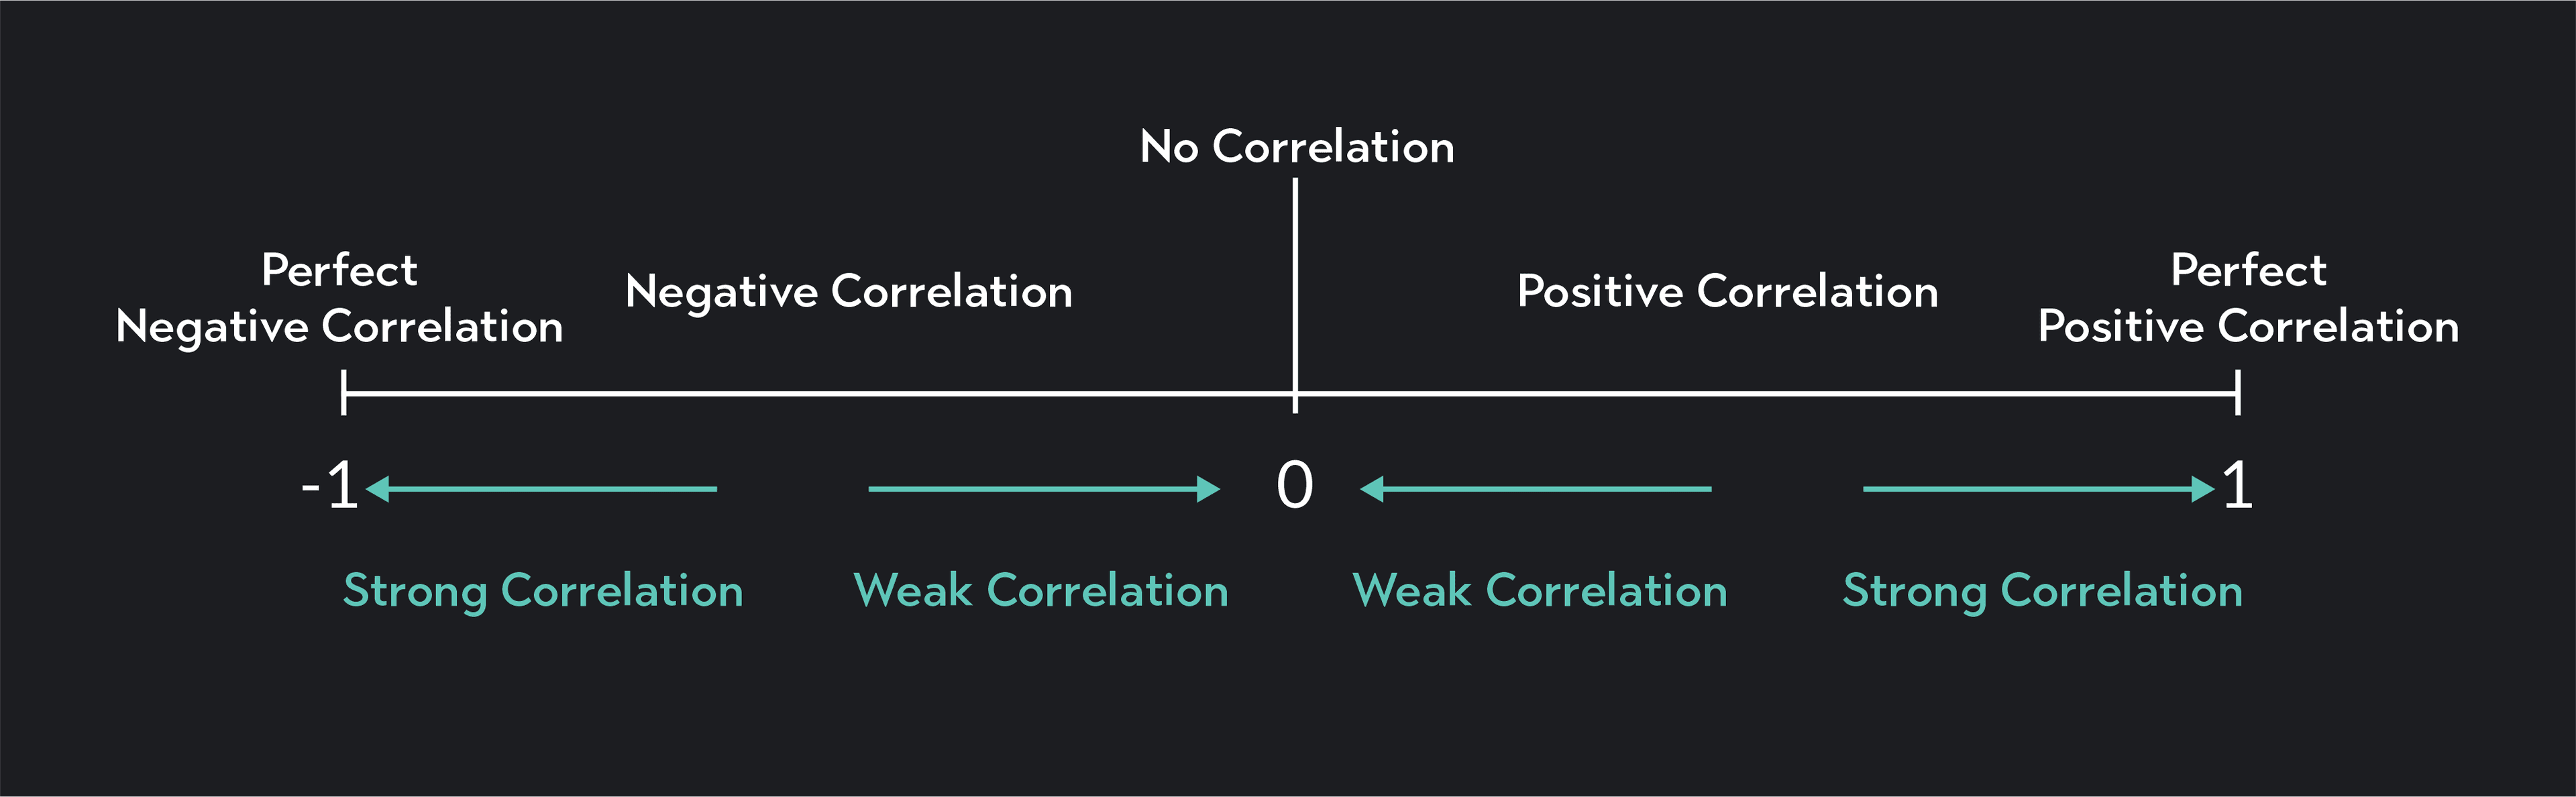
Pearson’s r ranges from -1 to 1, where -1 represents a perfect negative correlation, and 1 represents a perfect positive correlation. The closer the absolute value of r is to 1, the stronger the correlation, and the closer the absolute value is to 0, the weaker the correlation.
A strong correlation means a stronger association between the two variables. If X and Y are strongly correlated, knowing the value of X gives you more information about Y—and vice versa—compared to when the variables are weakly correlated.
A perfect negative correlation is an association between two variables where an increase in one is always associated with a perfectly proportional decrease in the other. In other words, the two variables have a perfectly proportional inverse relationship. The correlation coefficient for a perfectly negative correlation is -1.
A negative correlation is any inverse correlation where an increase in the value of X is associated with a decrease in the value of Y. For a negative correlation, Pearson’s r is less than 0 and greater than or equal to -1.
A zero correlation indicates there is no observable linear relationship between your two variables. Knowing the values of X will not tell you anything about the value of Y.
A positive correlation is any correlation where an increase in the value of X is associated with an increase in the value of Y, and a decrease in the value of X is associated with a decrease in the value of Y. For a positive correlation, Pearson’s r will be greater than 0 or less than or equal to 1.
A perfect positive correlation is an association between two variables where an increase in one is always associated with a perfectly proportional increase in the other. The correlation coefficient for a perfectly positive correlation is 1.
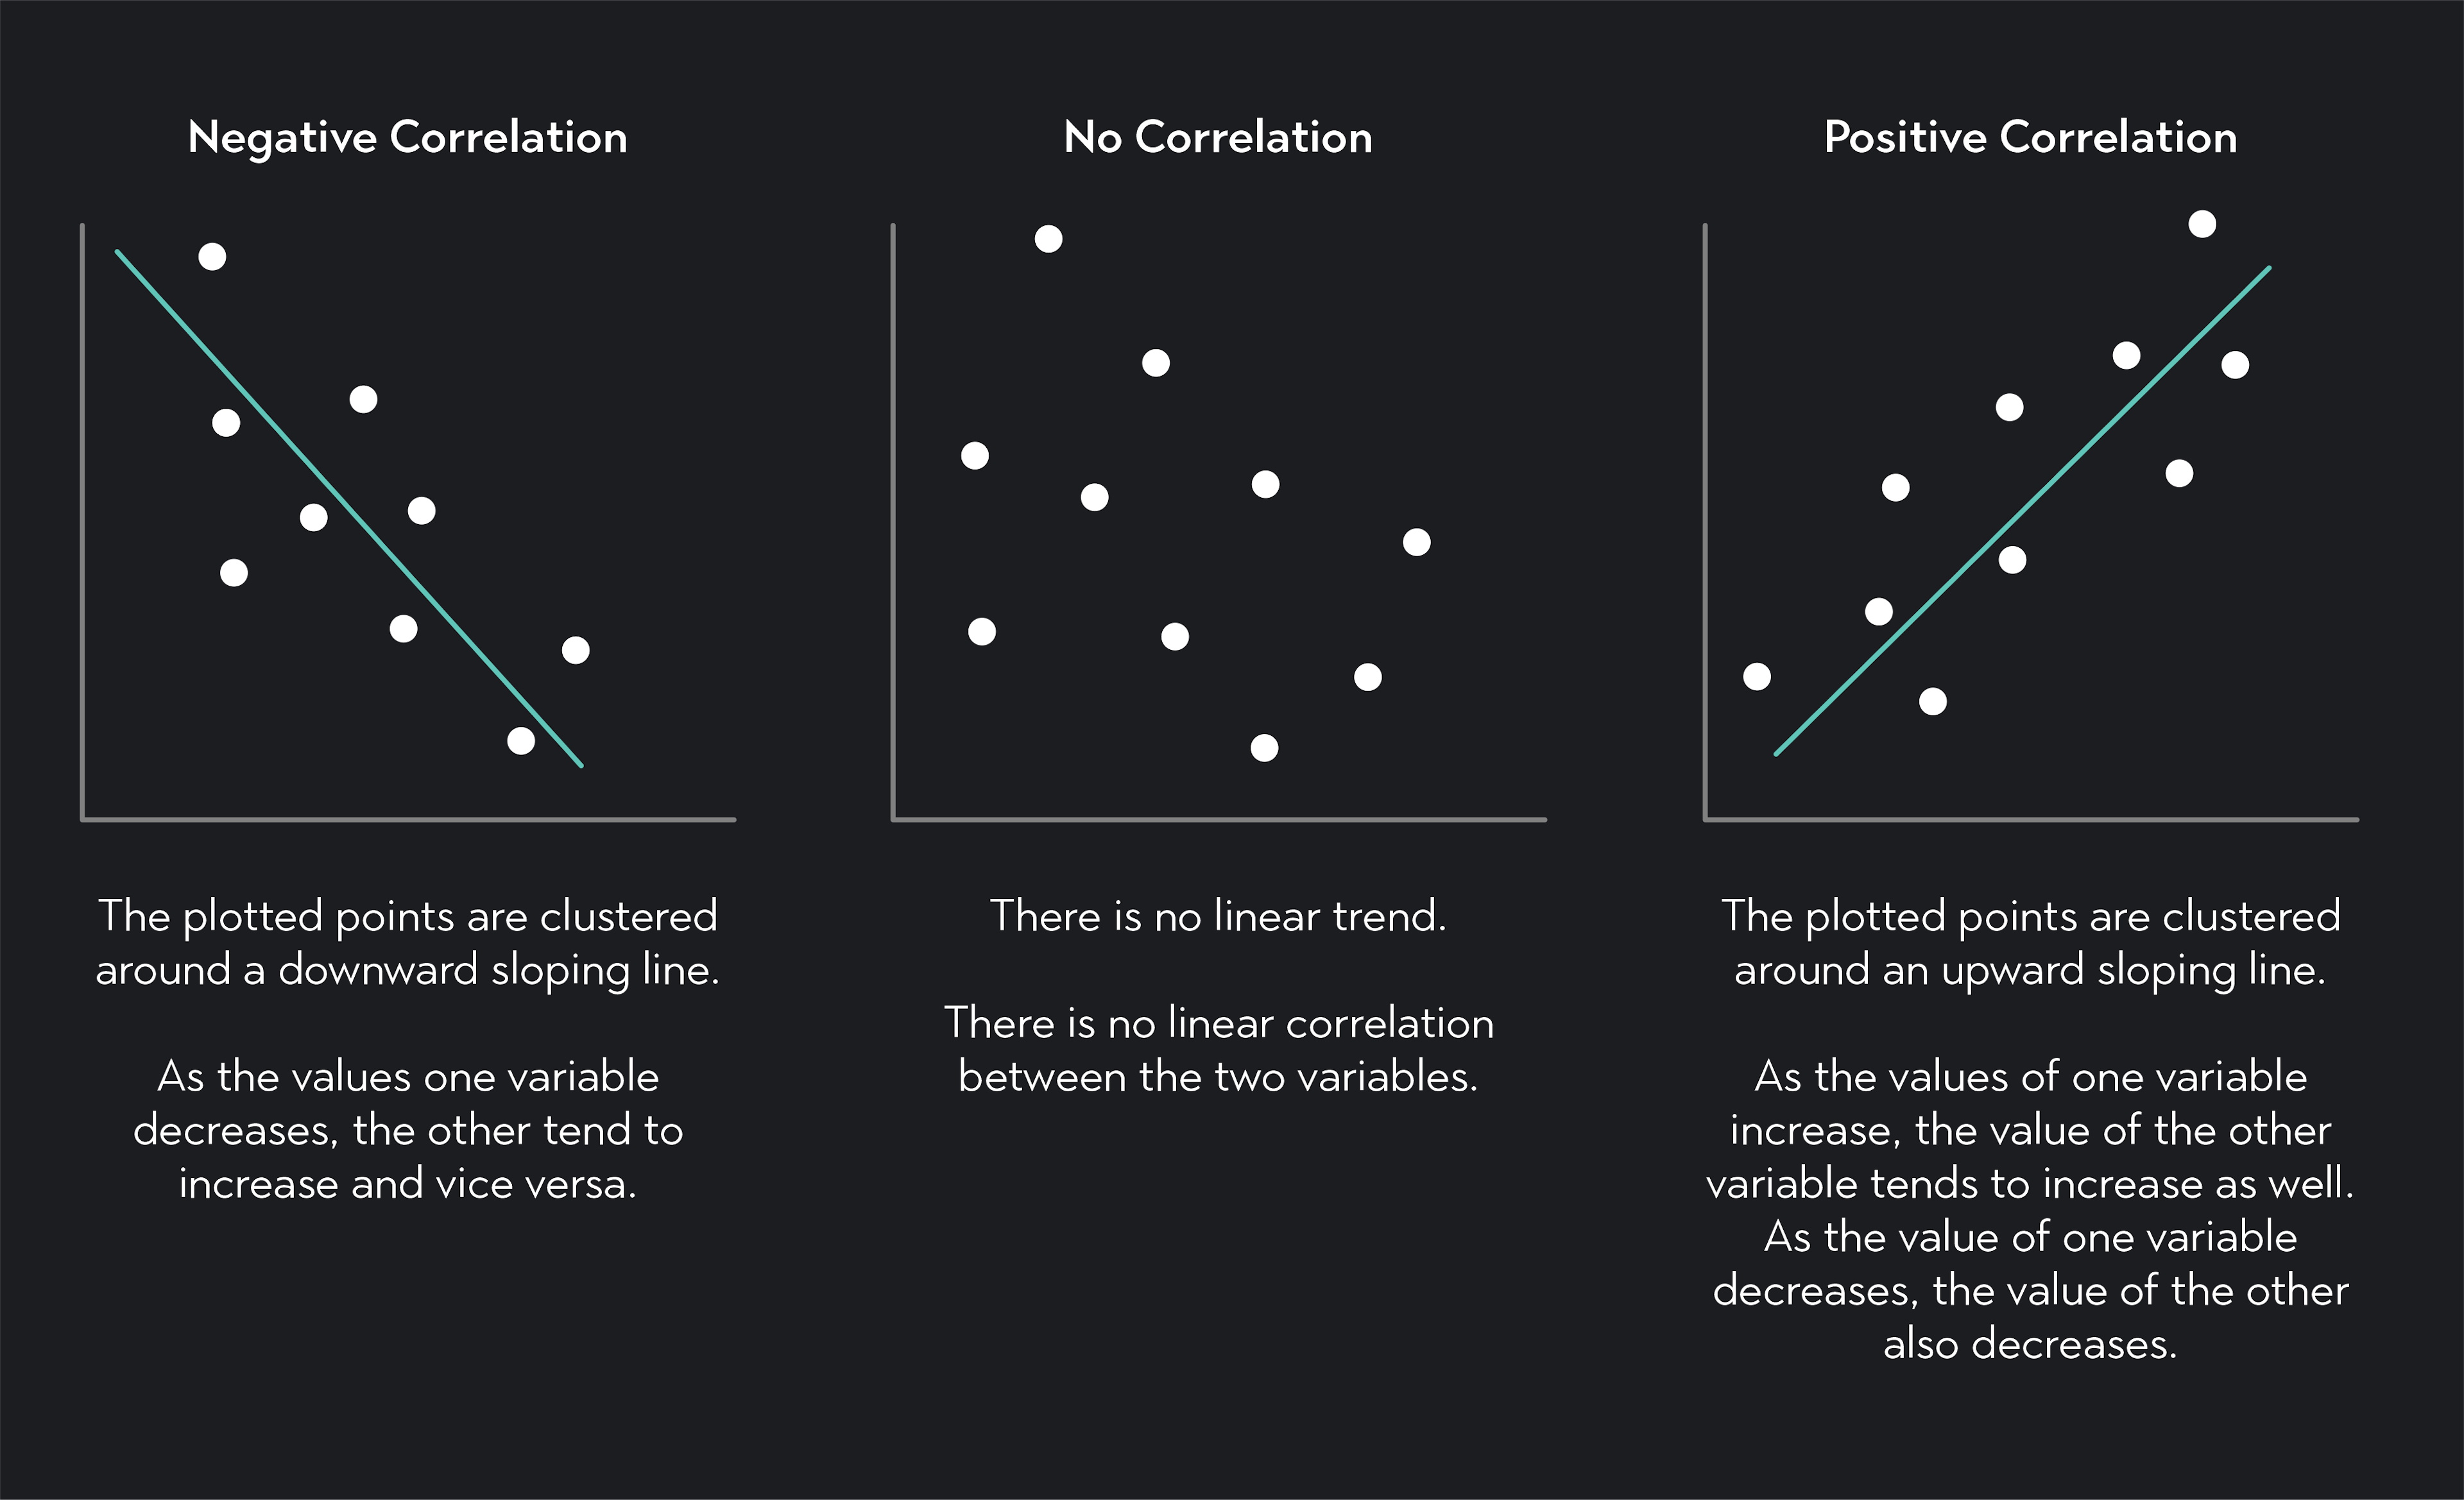
Scatter plots are a useful way of visualizing correlations. A scatter plot is a graph that maps the values of one variable—measured along the x-axis—to the values of the second variable—measured along the y-axis.
If there is a linear correlation between your two variables, you can draw an upward or downward-sloping straight trend line through your data to approximate the association.
By looking at a scatterplot, you should be able to determine both the direction and magnitude of a linear correlation.
Looking at a scatter plot, you can tell whether a correlation is positive or negative by the slope of the trend line.
A negative downward-sloping line indicates a negative correlation
A positive upward-sloping line indicates a positive correlation
If no linear trend line can be drawn through the data, there is no linear correlation.
You can approximate the strength of a correlation by looking at how close the data points are to the trend line.
The more closely clustered the data points are around the trend line, the stronger the correlation.
The further away the data points are from the trend line, the weaker the correlation.
You can use the Pearson coefficient under the following circumstances:
The variables you are comparing are both quantitative variables. If you are working with ordinal variables, you can use the Spearman rank correlation or Kendall’s tau, and If your variables are nominal, you can use a correlation measure called Cramér’s V.
Each variable is normally distributed.
You have no outliers in your data. Correlations are extremely sensitive to outliers. If you include even one outlier in your calculations, you will get misleading results.
The relationship between the two variables appears to be linear rather than non-linear
Pearson’s correlation coefficient is equal to the covariance of your two variables divided by the product of their standard deviations.
Where:
r is the Pearson correlation coefficient
x and y are the two variables
cov(x,y) is the covariance of x and y
sx is the standard deviation of x
sy is the standard deviation of y
xi is each individual observation of x
yi is each individual observation of y
x̄ is the mean of x
ȳ is the mean of y
You can also calculate Pearson’s r in Excel using the =PEARSON() function.
Suppose your data for variable x is stored in cells A1 through A20 and that your values for variable y are stored in cells B2:B20. You can calculate Pearson’s r with the following command:
=PEARSON(A1:A20, B2:B20)
Any correlation where the absolute value is between 0 and 0.4 is considered a weak correlation.
A Pearson correlation coefficient of 0.5 indicates a moderate positive correlation. More generally, a correlation coefficient between 0.4 and 0.7 is usually considered a moderate correlation.
A Pearson correlation coefficient of 0.7 and above is typically considered a strong positive correlation.
Correlations are important descriptive statistics because they establish an association between variables. Even when this association is not causal, a correlation tells you that you can garner some information about one of the variables based on the other.
For example, suppose you know that test scores are correlated with the number of hours a test taker studies for the test. If you know a test taker has a high score, you can predict that their study hours are also high, and the stronger the correlation, the more confident you can be in the prediction.
The Pearson correlation coefficient, r, does not represent the slope of the linear trend line. Instead, the value of the correlation coefficient tells you about the direction of the correlation and the strength of the relationship between your two variables.
For example, if you find that r equals 0.7, it does not mean that the slope of your trend line is 0.7. A correlation coefficient of 0.7, instead, tells you that there is a strong positive correlation between your two variables. This tells you that the slope of your trend line will be positive, but it does not tell you how flat or steep the trend line will be.
Yes. More often than not, you will be using statistical inference to infer a population correlation (a parameter) from sample data. In this case, you need to make sure you have independent observations.
If you are working with a small sample size, you’ll need to assume that your two variables are bivariately normally distributed in the population. You will also need to use hypothesis testing to determine the statistical significance of your estimate.
Outlier (from the co-founder of MasterClass) has brought together some of the world's best instructors, game designers, and filmmakers to create the future of online college.
Check out these related courses:


Statistics
Learn all about the coefficient of variation. Included are explanations of the standard deviation and the mean as well as examples and common applications.
Subject Matter Expert

Statistics
This overview is about negative correlation, its definition, its importance, how to determine it, and differences between positive and zero correlation.
Subject Matter Expert

College Success
Learn what statistics is and why it is important to society. We’ll list the types of statistics and data as well as the importance of the sampling methods.
Subject Matter Expert