
Statistics
What Do Subsets Mean in Statistics?
This article explains what subsets are in statistics and why they are important. You’ll learn about different types of subsets with formulas and examples for each.
Sarah Thomas
Subject Matter Expert

Statistics
12.15.2021 • 5 min read
Subject Matter Expert
This article is a guide on sample standard deviation, including concepts, a step-by-step process to calculate it, and a list of examples.
In This Article
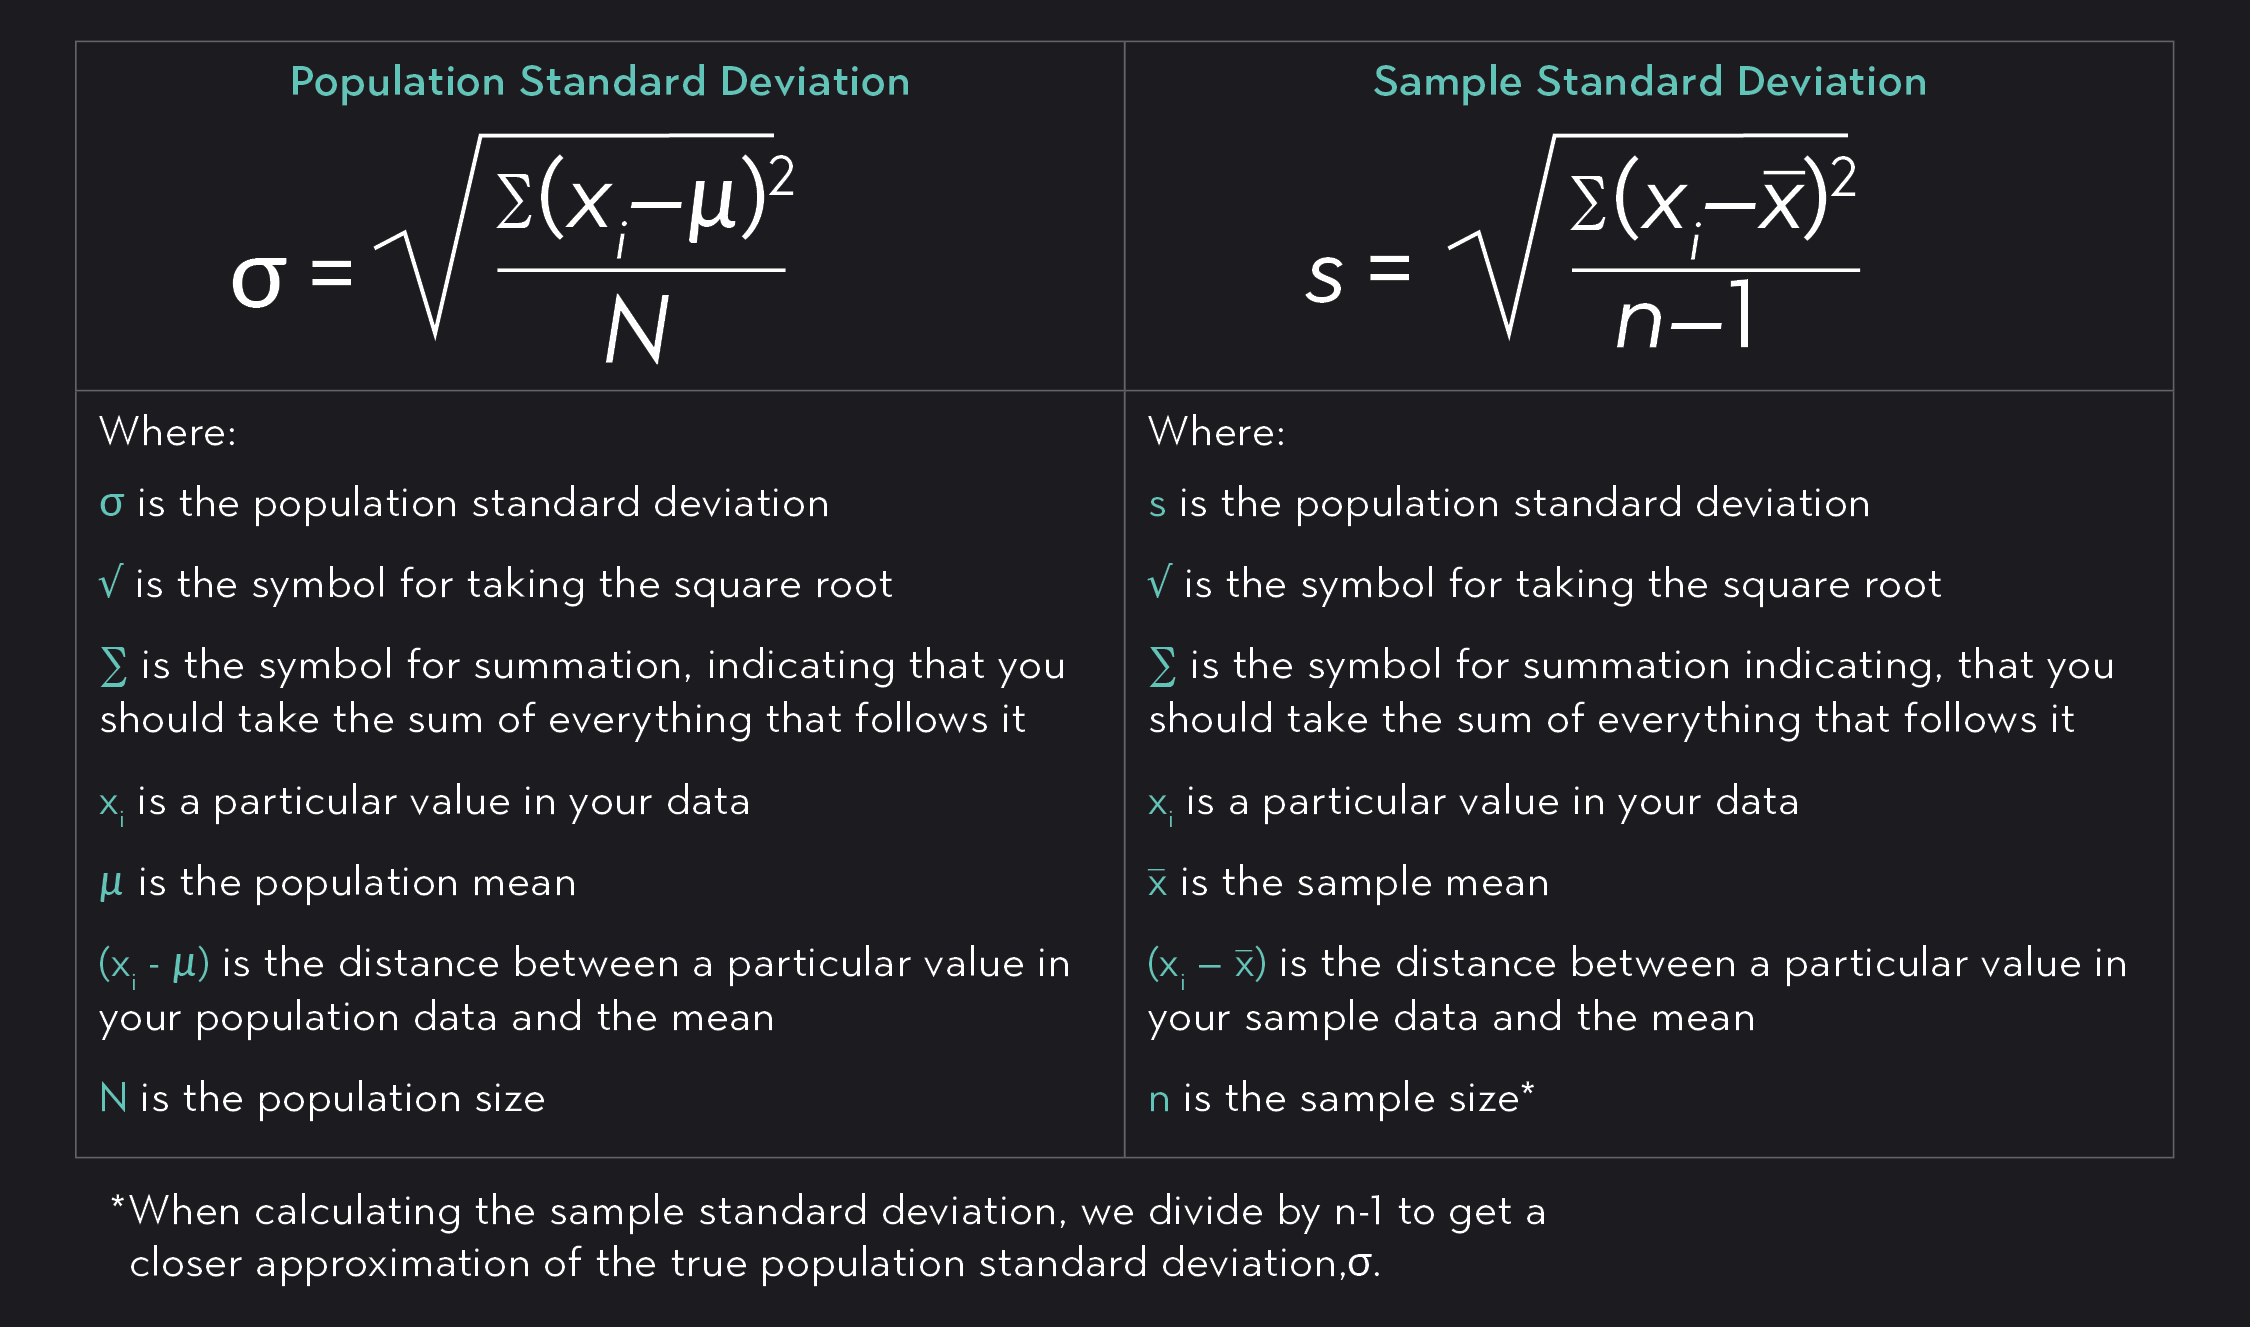
Standard deviation measures the spread of data relative to its mean. You can think of standard deviation as the average distance between a single data point and the mean. A large standard deviation shows that data is more widely dispersed about the mean, and a small standard deviation shows that data are tightly clustered around the mean. You can calculate standard deviation by taking the square root of the variance.
In statistics, a population refers to the entire set of objects or events being studied, and a sample is a subset of the population. As an example, imagine you are studying national elections in the United States. Your population of interest consists of every single eligible voter across the 50 states. Because you can’t collect data for the entire population, you draw random samples (subsets) of voters and make inferences about the population from these samples. Sometimes statisticians have data for an entire population. Most of the time, however, they have to work with samples.
When you are dealing with population data and want to calculate a standard deviation, use the population standard deviation formula given above. A population standard deviation is denoted by the lowercase Greek letter sigma, 𝞂.
When you are dealing with sample data and want to calculate a standard deviation, use the sample standard deviation formula given above. A sample standard deviation is denoted by the lowercase letter s.
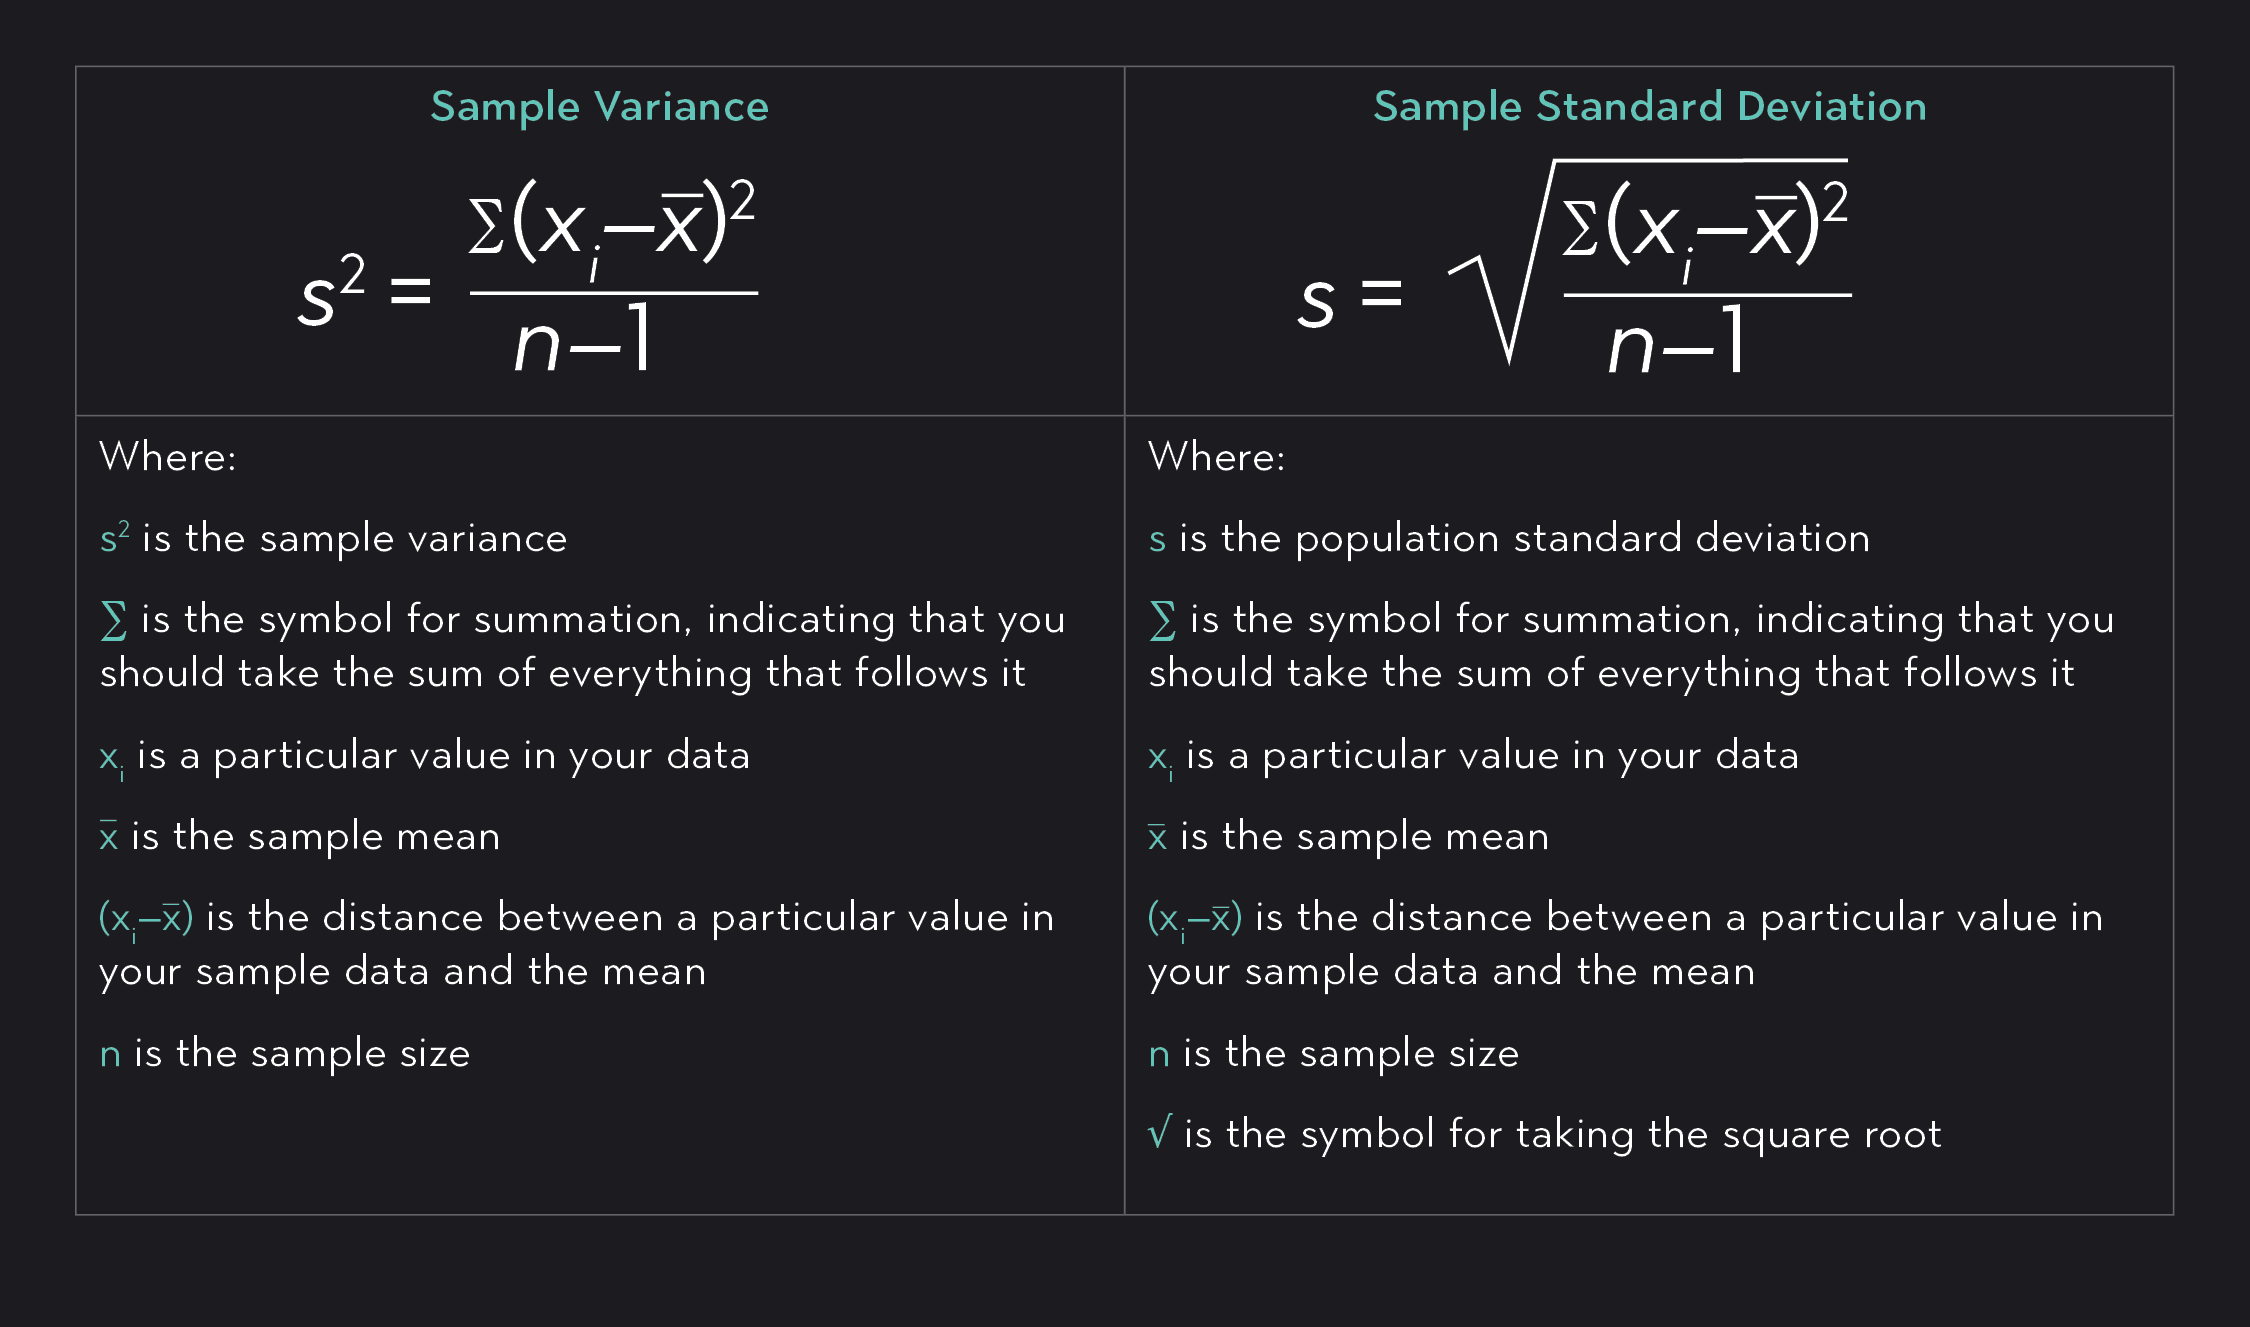
We calculate standard deviation as the square root of the variance. This may cause you to wonder: why do we use standard deviation when we already have variance? Great question!
To answer this question, first notice that in both the equation for variance and the equation for standard deviation, you take the squared deviation (the squared distances) between each data point and the sample mean . You do this so that the negative distances between the mean and the data points below the mean do not cancel out the positive distances between the mean and data points above it.
By squaring deviations, we convert each deviation into a positive number, and from there, you can measure average dispersion. There is a downside to doing this, though. By squaring the deviations, you square the units of the data as well. Imagine your data is measured in ounces. By taking squared deviations, you are now measuring the dispersion in your data in terms of ounces squared — a unit of measurement that is difficult to interpret.
Standard deviation is intended to be a standardized measure of dispersion. By taking the square root of the variance, we convert the statistic back into the same units as the data. Ounces, not ounces squared!
Say you have the following sample data for temperatures measured in degrees Fahrenheit. For simplicity, this sample just has four observations (n=4).
Using the formula for sample standard deviation, let’s go through a step-by-step example of how to find the standard deviation for this sample.
Calculate the sample mean x̅.
Calculate the deviation between each data point and the sample mean .
Notice that there are both positive and negative deviations.
Square the deviations, .
By squaring the deviations, we turn all of the deviations positive.
Sum the squared distances, .
Divide the sum of the squares by the number of data points minus one, .
Notice that this is the variance, , and it is measured in degrees Fahrenheit squared!
Take the square root of the variance.
And there is your sample standard deviation. 4.97 °F.
Outlier (from the co-founder of MasterClass) has brought together some of the world's best instructors, game designers, and filmmakers to create the future of online college.
Check out these related courses:


Statistics
This article explains what subsets are in statistics and why they are important. You’ll learn about different types of subsets with formulas and examples for each.
Subject Matter Expert

Statistics
Here is an overview of set operations, what they are, properties, examples, and exercises.
Subject Matter Expert

Calculus
Knowing how to find definite integrals is an essential skill in calculus. In this article, we’ll learn the definition of definite integrals, how to evaluate definite integrals, and practice with some examples.
Subject Matter Expert