In This Article
What Is Statistical Significance?
Examples of Statistical Significance
How Is Statistical Significance Calculated?
What Does the Significance Level Mean?
FAQ
A study claims people who practice intermittent fasting experience less severe complications from COVID-19, but how seriously should you take this claim? Statistical significance is a powerful tool that can help answer this question. It’s one of the main tools we have for assessing the validity of statistical findings.
In this article, we'll dive into what statistical significance is, how it's calculated, and why it's essential for making informed decisions based on data.
What Is Statistical Significance?
Statistical significance is a core concept in statistics. We use it in hypothesis testing to determine whether the results we obtain occurred by chance or whether they point to something relevant and true about the population we are studying.
Suppose you observe dogs whose owners spend more time with them at home live longer than those whose owners spend less time with them. The basic idea behind statistical significance is this: it helps you determine whether your observation is simply due to random variation in your samples or whether there’s strong enough evidence to support an underlying difference between dogs who spend more time with their owners and those who spend less.
If your results are “statistically significant,” your observation points to a meaningful difference rather than a difference observed by chance. If your results are not statistically significant, you do not have enough statistical evidence to rule out the possibility that what you observed is due to random variation in your samples. Maybe you observed longer life spans in one group of dogs simply because you happened to sample some healthy dogs in one group or some less healthy ones in the other.
Statistical significance is crucial to ensure our statistical findings are trustworthy and reliable, and we use it to avoid drawing false conclusions.
Examples of Statistical Significance
We use statistical analysis in many fields, so you’ll see mentions of statistical significance in many different contexts.
Here are some examples you might come across in the real world:
Finance
In finance, you may be interested in comparing the performance of different investment portfolios. If one portfolio performs better than another, you, as an investor, could use statistical tests to see if the higher returns are statistically significant. In other words, you could test to see whether the higher returns were likely the result of random variation or whether some other reason explains why one portfolio performed better.
Medicine
In medical research, you may be interested in comparing the outcomes of patients in a treatment group to those in a control group. The patients in the treatment group receive a newly developed drug to manage a disease, while patients in the treatment group do not receive the new treatment.
At the end of your study, you compare the health outcomes of each group. If you observe that the patients in the treatment group had better outcomes, you will want to conduct a hypothesis test to see if the difference in outcomes is statistically significant—i.e., due to the difference in treatment.
Agriculture
Agronomists use hypothesis tests to determine what soil conditions and management types lead to the best crop yields. Like a medical researcher who compares treatment and control groups, agronomists conduct hypothesis tests to see if there are statistically significant differences between crops grown under different conditions.
Business
In business, there are many applications of statistical testing. For example, if you hypothesize that a product tweak led to greater customer retention, you could use a statistical test to see if your results are statistically significant.
How Is Statistical Significance Calculated?
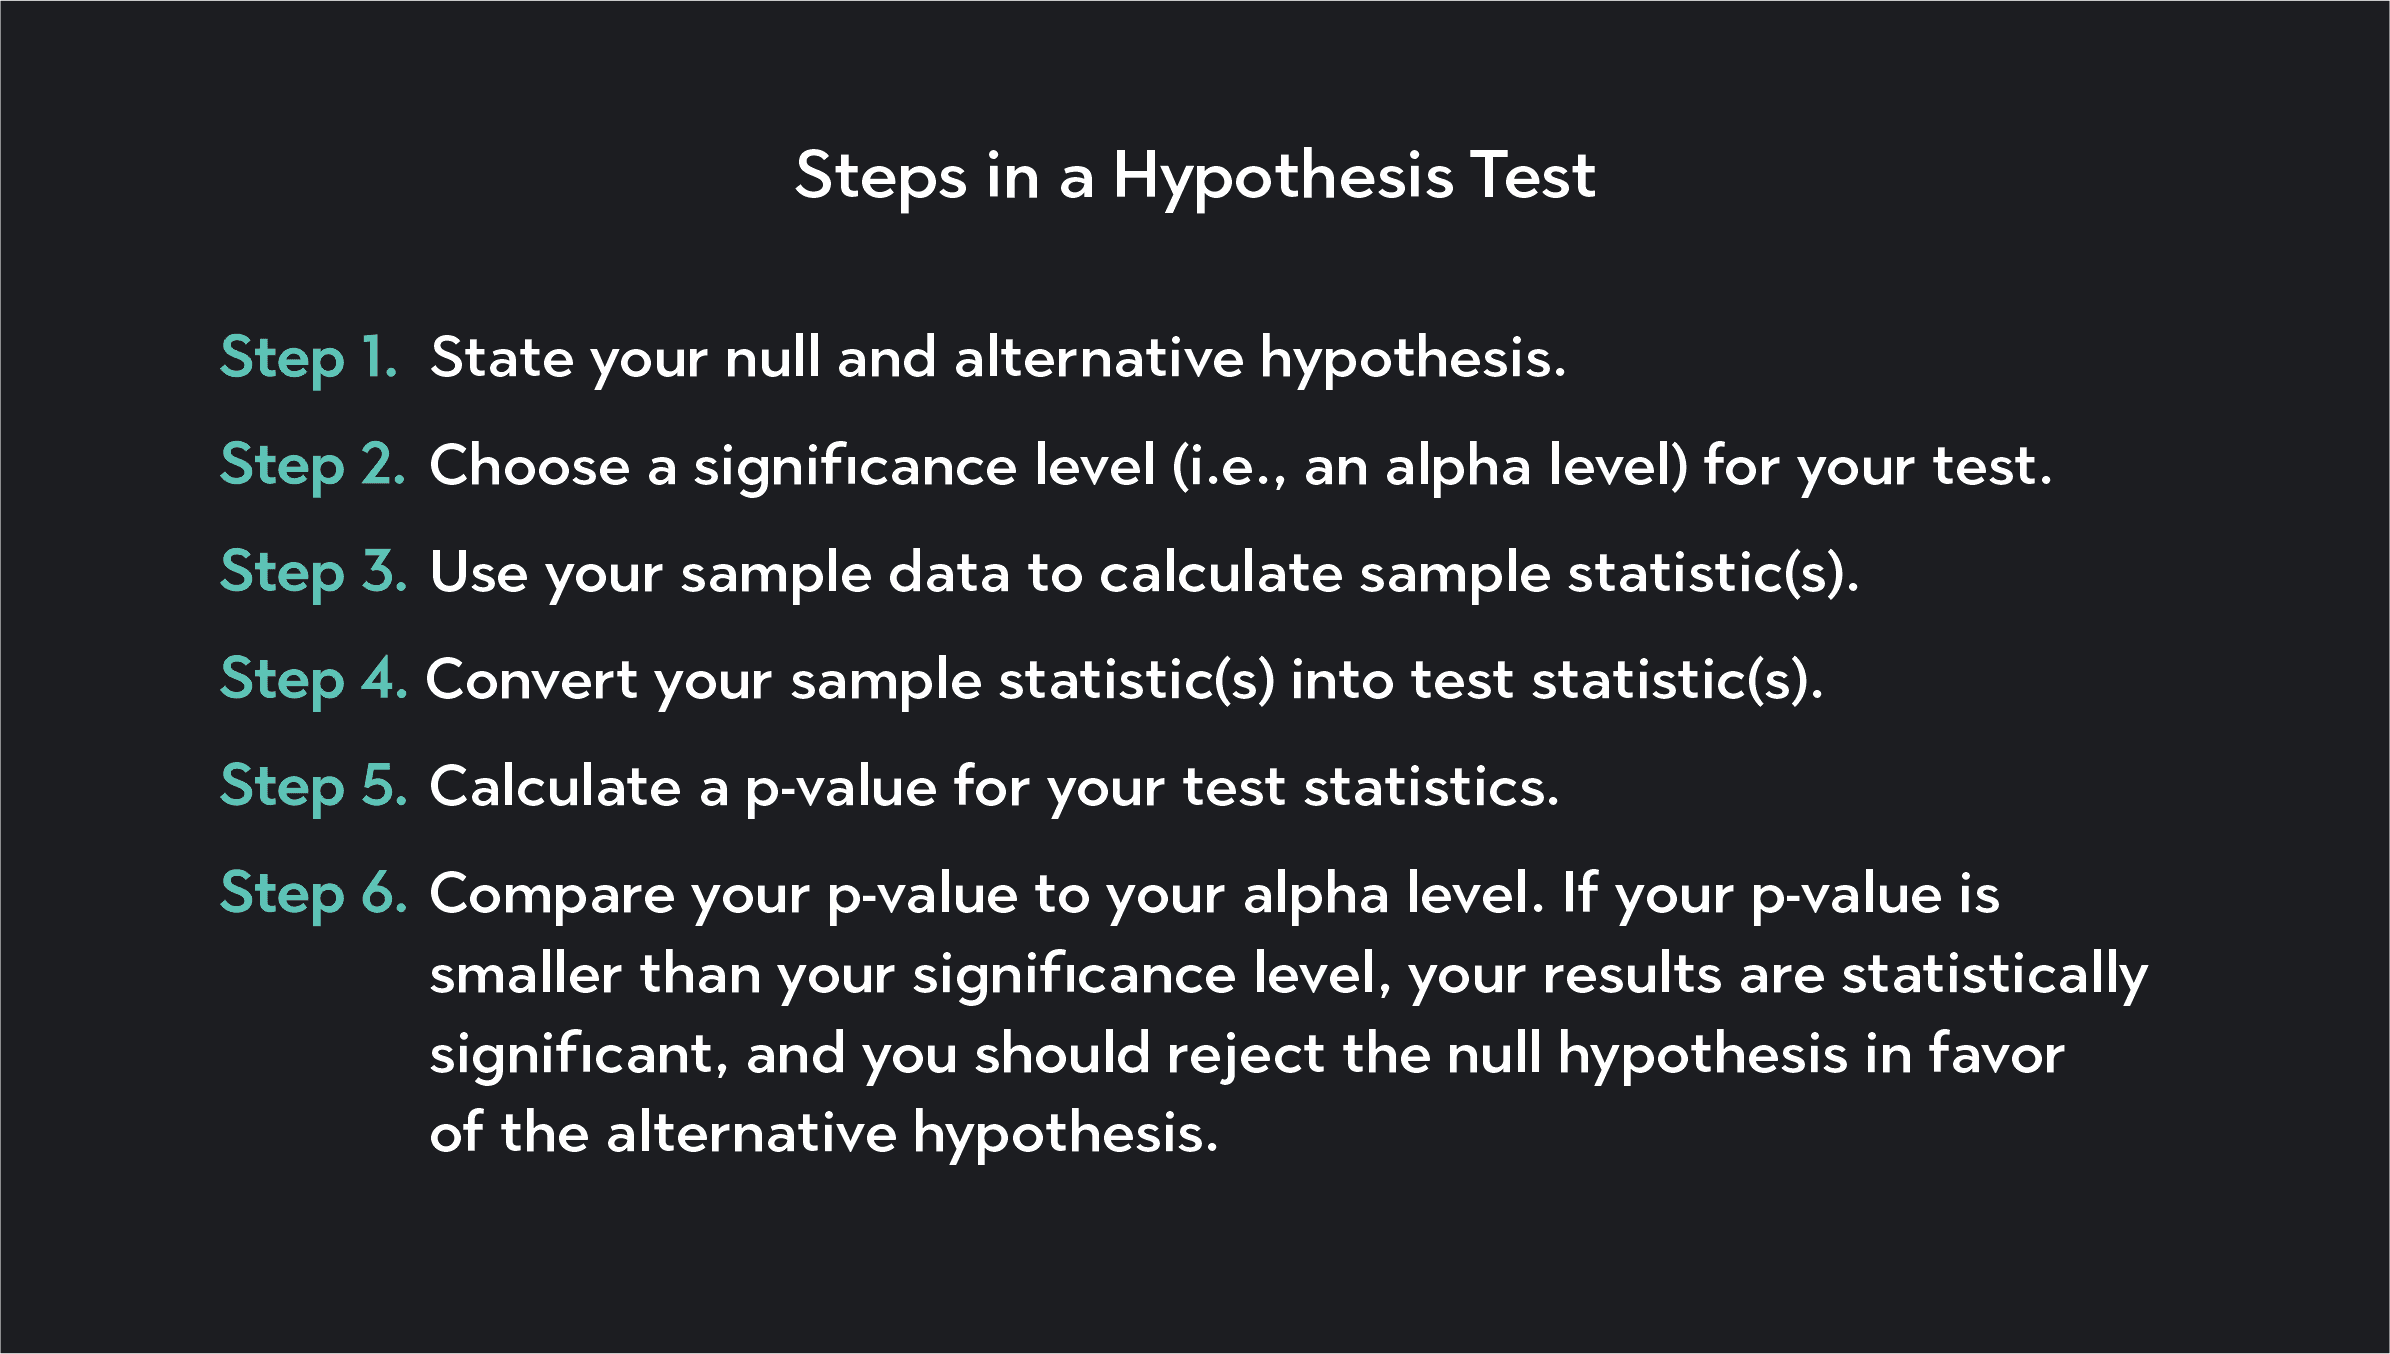
To determine statistical significance, you first need to articulate the main elements of your hypothesis test. You’ll need to articulate a null hypothesis and an alternative hypothesis, and you’ll need to choose a significance level for your test.
The null hypothesis represents the assumption that there's no significant difference between the variables you are studying. For example, a new drug has no effect on patient outcomes.
The alternative hypothesis represents what you suspect might be true. For example, a new drug improves patient outcomes. The null and alternative hypotheses must be mutually exclusive statements, meaning that the null hypothesis must be false for the alternative hypothesis to be true.
The significance level of a hypothesis test is the threshold you use to determine whether or not your results are statistically significant. The significance level is the probability of falsely rejecting the null hypothesis when it is actually true.
The most commonly used significance levels are:
0.10 (or 10%)
0.05 (or 5%)
0.01 (1%)
Once you’ve stated your hypotheses and significance level, you’ll collect data and calculate a test statistic from your data. You then need to calculate a p-value for your test statistic. A p-value represents the probability of observing a result as extreme or more extreme than the one you obtained, assuming that the null hypothesis is true.
If the p-value is smaller than your significance level, you reject the null hypothesis in favor of the alternative hypothesis. The smaller your p-value is, the more conviction you can have in rejecting the null hypothesis. If the p-value exceeds the significance level, you fail to reject the null hypothesis.
What Does the Significance Level Mean?
The significance level—or alpha level (α)—is a benchmark we use in statistical hypothesis testing. It is the probability threshold below which you reject the null hypothesis.
The most commonly used significance level is 0.05 (or 5%), but you can choose a lower or higher significance level in your testing depending on your priorities. With a smaller alpha, you have a smaller chance of making a Type I error in your analysis.
A Type I error is when you accidentally reject the null hypothesis when, in fact, the null hypothesis is true. On the other hand, the smaller your significance level is, the more likely you are to make a Type II error. A Type II error is when you fail to reject a false null hypothesis.
A significance level of 0.05 means if you calculate a p-value less than 0.05, you will reject the null hypothesis in favor of the alternative hypothesis. It also means you will have a 5% chance of rejecting the null hypothesis when it is actually true (i.e., you will have a 5% chance of making a Type I error).
FAQ
Is statistical significance the only way to assess the validity of a statistical study?
Statistical significance is one of many things you should check for when assessing a statistical study. A statistically significant result is not enough to guarantee the validity of a statistical result. Several other factors affect the reliability of research findings, such as sample size, the type of data used, study design, and the presence of confounding variables.
You always need to use statistical significance as a tool in combination with other methods to ensure the quality of your research.
Is statistical significance the same thing as effect size?
Statistical significance and effect size are not the same thing. Statistical significance assesses whether our findings are due to random chance. Effect size measures the magnitude of the difference between two groups or the strength of the relationship between two variables.
Just because your data analysis returns statistically significant results, it does mean that you have found a large effect size. For example, you may find a statistically significant result that dogs who spend more time with their owners live longer, but you might only find a small effect.
Effect size is sometimes called practical significance because statistically significant results are only “practically significant” when the results are large enough for us to care about.
What is the difference between statistical significance and statistical power?
Statistical power is the power of a statistical test to correctly reject the null hypothesis when a given alternative hypothesis is true. It is the ability to detect an effect in a sample data set when the effect is, in fact, present in the population. Statistical significance is one of the factors that impacts power.
A higher significance level, having a larger sample, a larger effect size, and lower variability within the population, are all elements that increase statistical power.
What is the relationship between significance levels and confidence levels?
The significance (or alpha) level is the threshold we use to decide whether or not to reject the null hypothesis. Confidence intervals, on the other hand, are a range of values that contain the true population parameter. For example, a 95% confidence interval means 95% of the intervals would contain the true population parameter if a study were repeated many times.
Statistical significance and confidence levels are both related to the probability of making a Type I error. A Type I error—sometimes called a false-positive—is an error that occurs when a statistician rejects the null hypothesis when it is actually true. The probability of making a Type I error is equal to the significance level and is also the complement of the confidence level.
Explore Outlier's Award-Winning For-Credit Courses
Outlier (from the co-founder of MasterClass) has brought together some of the world's best instructors, game designers, and filmmakers to create the future of online college.
Check out these related courses: