
Statistics
Degrees of Freedom In Statistics
Explore degrees of freedom. Learn about their importance, calculation methods, and two test types. Plus dive into solved examples for better understanding.
Sarah Thomas
Subject Matter Expert

Statistics
04.28.2023 • 5 min read
Subject Matter Expert
Learn about a null versus alternative hypothesis and what they show with examples for each. Also go over the main differences and similarities between them.
In This Article
In statistics, you’ll draw insights or “inferences” about population parameters using data from a sample. This process is called inferential statistics.
To make statistical inferences, you need to determine if you have enough evidence to support a certain hypothesis about the population. This is where null and alternative hypotheses come into play!
In this article, we’ll explain the differences between these two types of hypotheses, and we’ll explain the role they play in hypothesis testing.
Imagine you want to know what percent of Americans are vegetarians. You find a Gallup poll claiming 5% of the population was vegetarian in 2018, but your intuition tells you vegetarianism is on the rise and that far more than 5% of Americans are vegetarian today.
To investigate further, you collect your own sample data by surveying 1,000 randomly selected Americans. You’ll use this random sample to determine whether it’s likely the true population proportion of vegetarians is, in fact, 5% (as the Gallup data suggests) or whether it could be the case that the percentage of vegetarians is now higher.
Notice that your investigation involves two rival hypotheses about the population. One hypothesis is that the proportion of vegetarians is 5%. The other hypothesis is that the proportion of vegetarians is greater than 5%. In statistics, we would call the first hypothesis the null hypothesis, and the second hypothesis the alternative hypothesis. The null hypothesis () represents the status quo or what is assumed to be true about the population at the start of your investigation.
Null Hypothesis
In hypothesis testing, the null hypothesis () is the default hypothesis.
It's what the status quo assumes to be true about the population.
The alternative hypothesis ( or ) is the hypothesis that stands contrary to the null hypothesis. The alternative hypothesis represents the research hypothesis—what you as the statistician are trying to prove with your data.
In medical studies, where scientists are trying to demonstrate whether a treatment has a significant effect on patient outcomes, the alternative hypothesis represents the hypothesis that the treatment does have an effect, while the null hypothesis represents the assumption that the treatment has no effect.
Alternative Hypothesis
The alternative hypothesis ( or ) is the hypothesis being proposed in opposition to the null hypothesis.
In a hypothesis test, the null and alternative hypotheses must be mutually exclusive statements, meaning both hypotheses cannot be true at the same time. For example, if the null hypothesis includes an equal sign, the alternative hypothesis must state that the values being mentioned are “not equal” in some way.
Your hypotheses will also depend on the formulation of your test—are you running a one-sample T-test, a two-sample T-test, F-test for ANOVA, or a Chi-squared test? It also matters whether you are conducting a directional one-tailed test or a nondirectional two-tailed test.
Null Hypothesis: The population mean is equal to some number, x. 𝝁 = x
Alternative Hypothesis: The population mean is not equal to x. 𝝁 ≠ x
Null Hypothesis: The population mean is less than or equal to some number, x. 𝝁 ≤ x Alternative Hypothesis: The population mean is greater than x. 𝝁 > x
Null Hypothesis: The population mean is greater than or equal to some number, x. 𝝁 ≥ x
Alternative Hypothesis: The population mean is less than x. 𝝁 < x
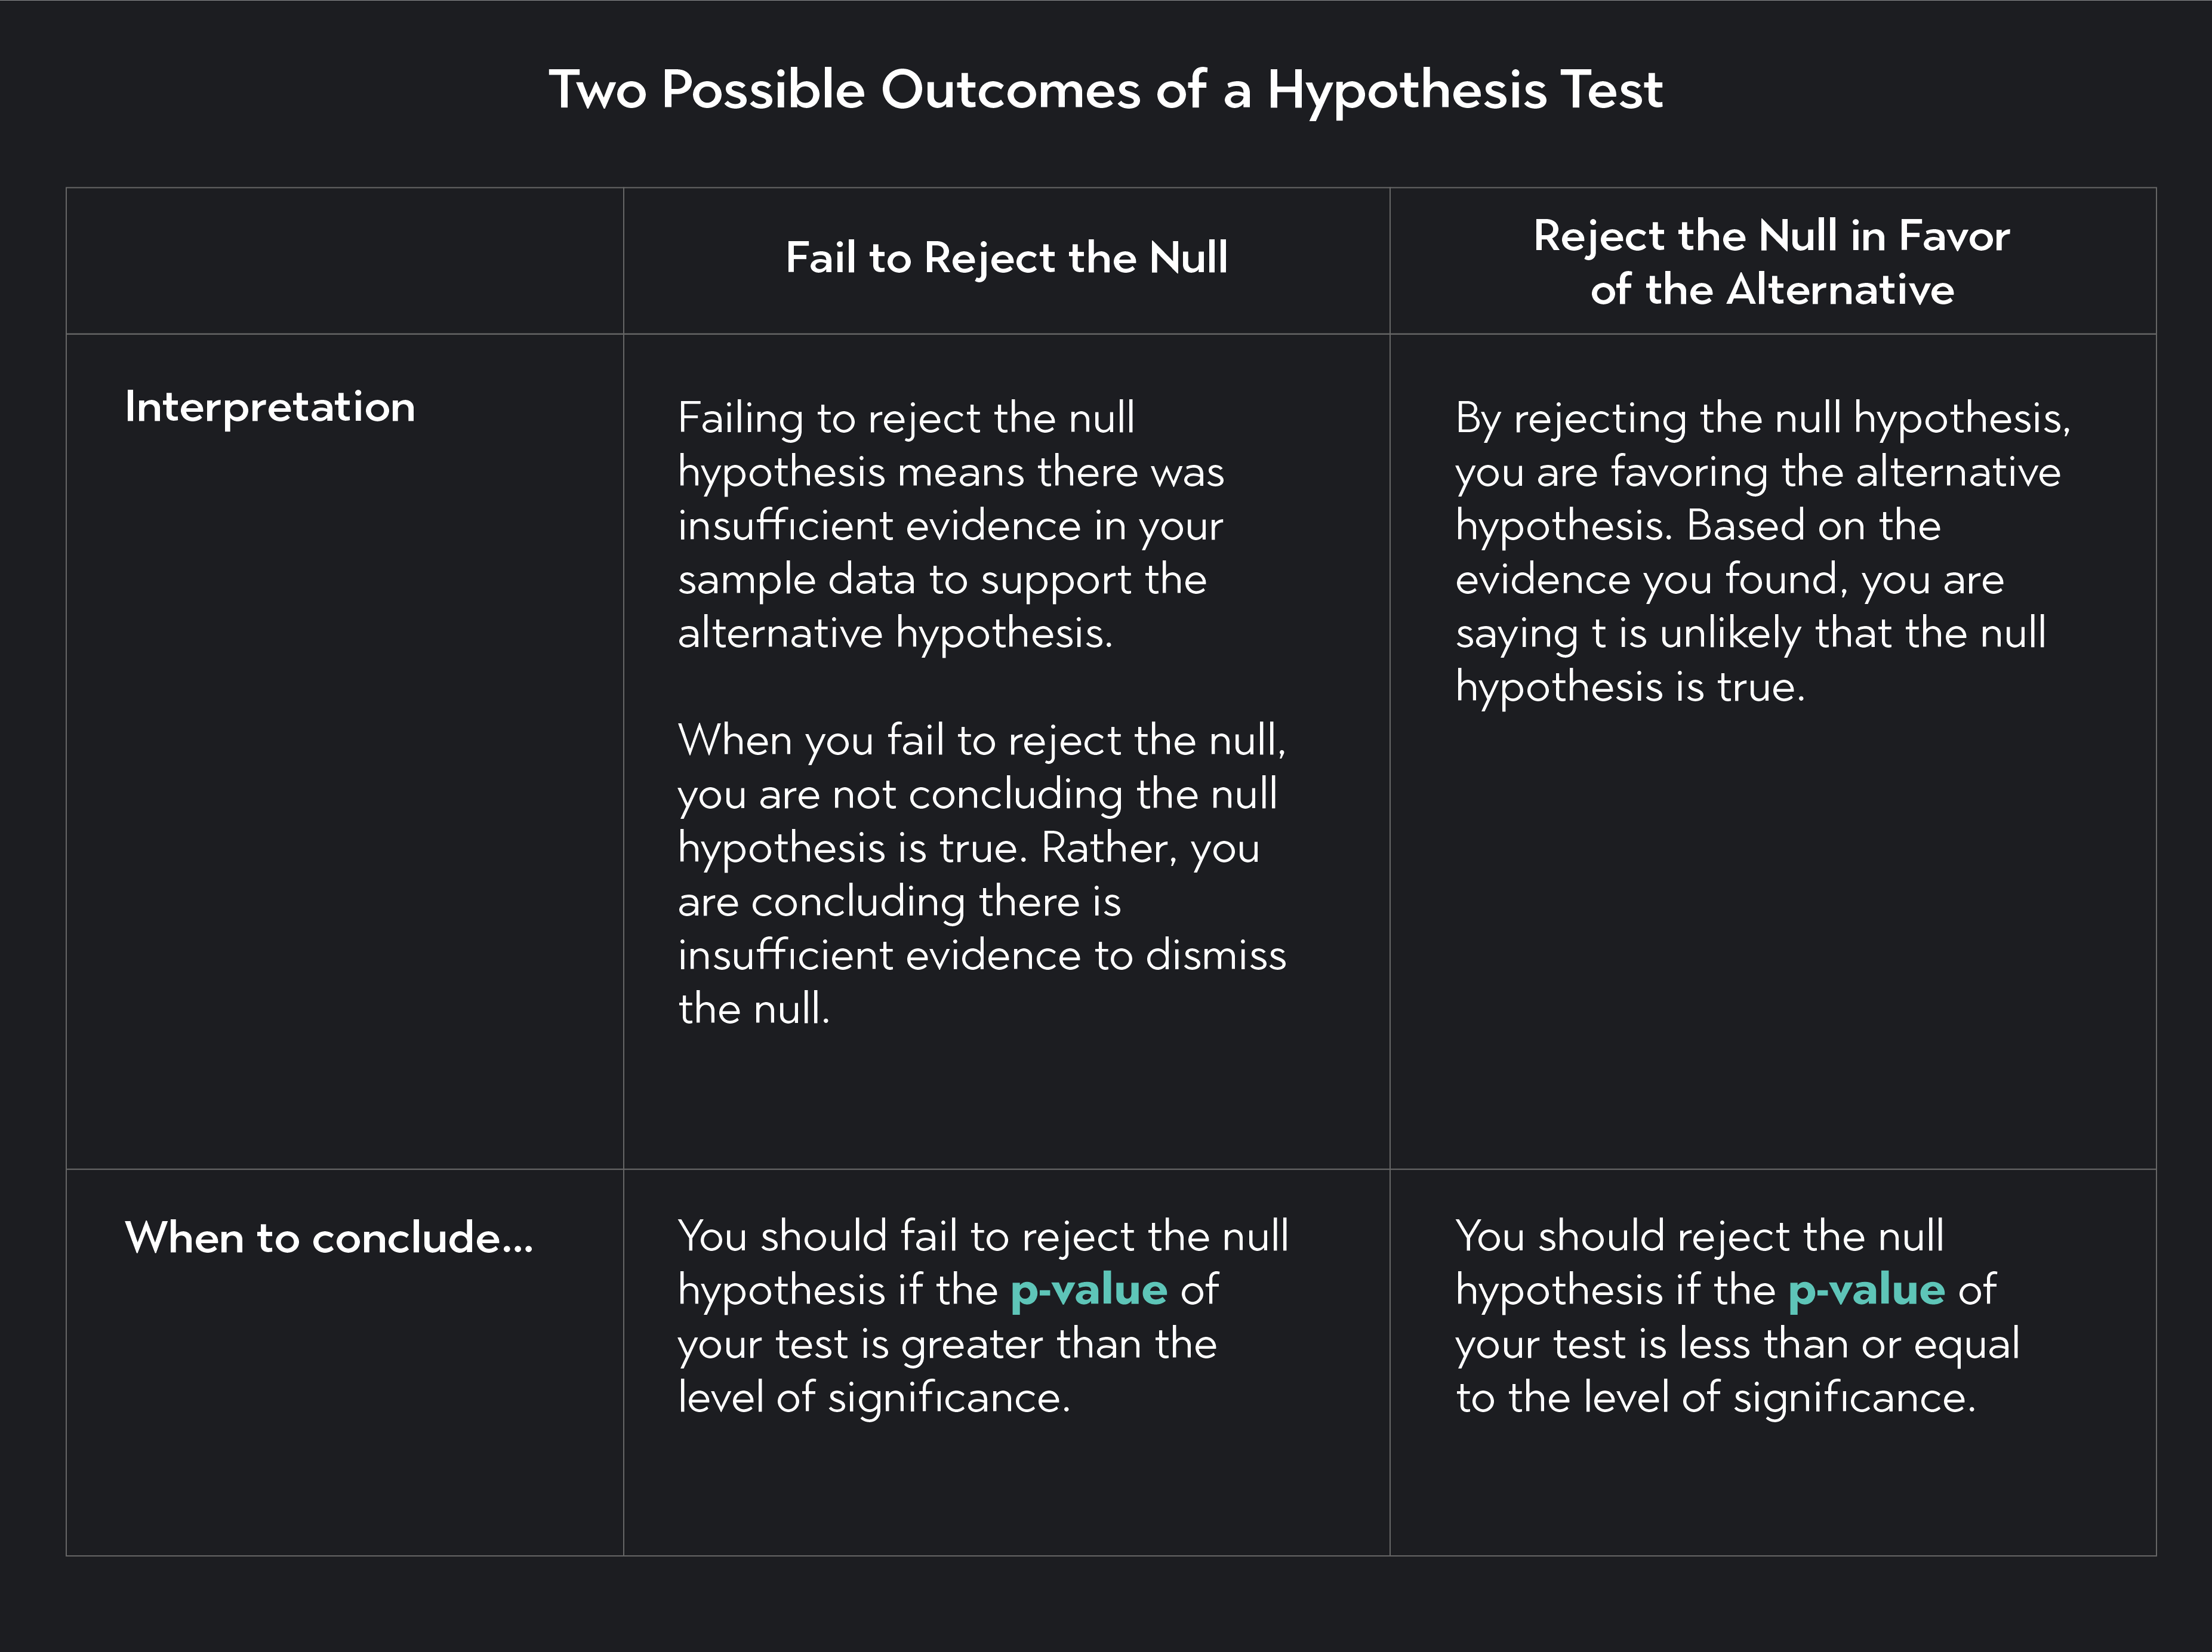
By the end of a hypothesis test, you will have reached one of two conclusions.
You will run into either 2 outcomes:
Fail to reject the null hypothesis on the grounds that there's insufficient evidence to move away from the null hypothesis
Reject the null hypothesis in favor of the alternative.
If you’re confused about the outcomes of a hypothesis test, a good analogy is a jury trial. In a jury trial, the defendant is innocent until proven guilty. To reach a verdict of guilt, the jury must find strong evidence (beyond a reasonable doubt) that the defendant committed the crime.
This is analogous to a statistician who must assume the null hypothesis is true unless they can uncover strong evidence (a p-value less than or equal to the significance level) in support of the alternative hypothesis.
Notice also, that a jury never concludes a defendant is innocent—only that the defendant is guilty or not guilty. This is similar to how we never conclude that the null hypothesis is true. In a hypothesis test, we never conclude that the null hypothesis is true. We can only “reject” the null hypothesis or “fail to reject” it.
In this video, let’s look at the jury example again, the reasoning behind hypothesis testing, and how to form a test. It starts by stating your null and alternative hypotheses.
Here is a summary of the key differences between the null and the alternative hypothesis test.
The null hypothesis represents the status quo; the alternative hypothesis represents an alternative statement about the population.
The null and the alternative are mutually exclusive statements, meaning both statements cannot be true at the same time.
In a medical study, the null hypothesis represents the assumption that a treatment has no statistically significant effect on the outcome being studied. The alternative hypothesis represents the belief that the treatment does have an effect.
The null hypothesis is denoted by
You “fail to reject” the null hypothesis when the p-value is larger than the significance level. You “reject” the null hypothesis in favor of the alternative hypothesis when the p-value is less than or equal to your test’s significance level.
The similarities between the null and alternative hypotheses are as follows.
Both the null and the alternative are statements about the same underlying data.
Both statements provide a possible answer to a statistician’s research question.
The same hypothesis test will provide evidence for or against the null and alternative hypotheses.
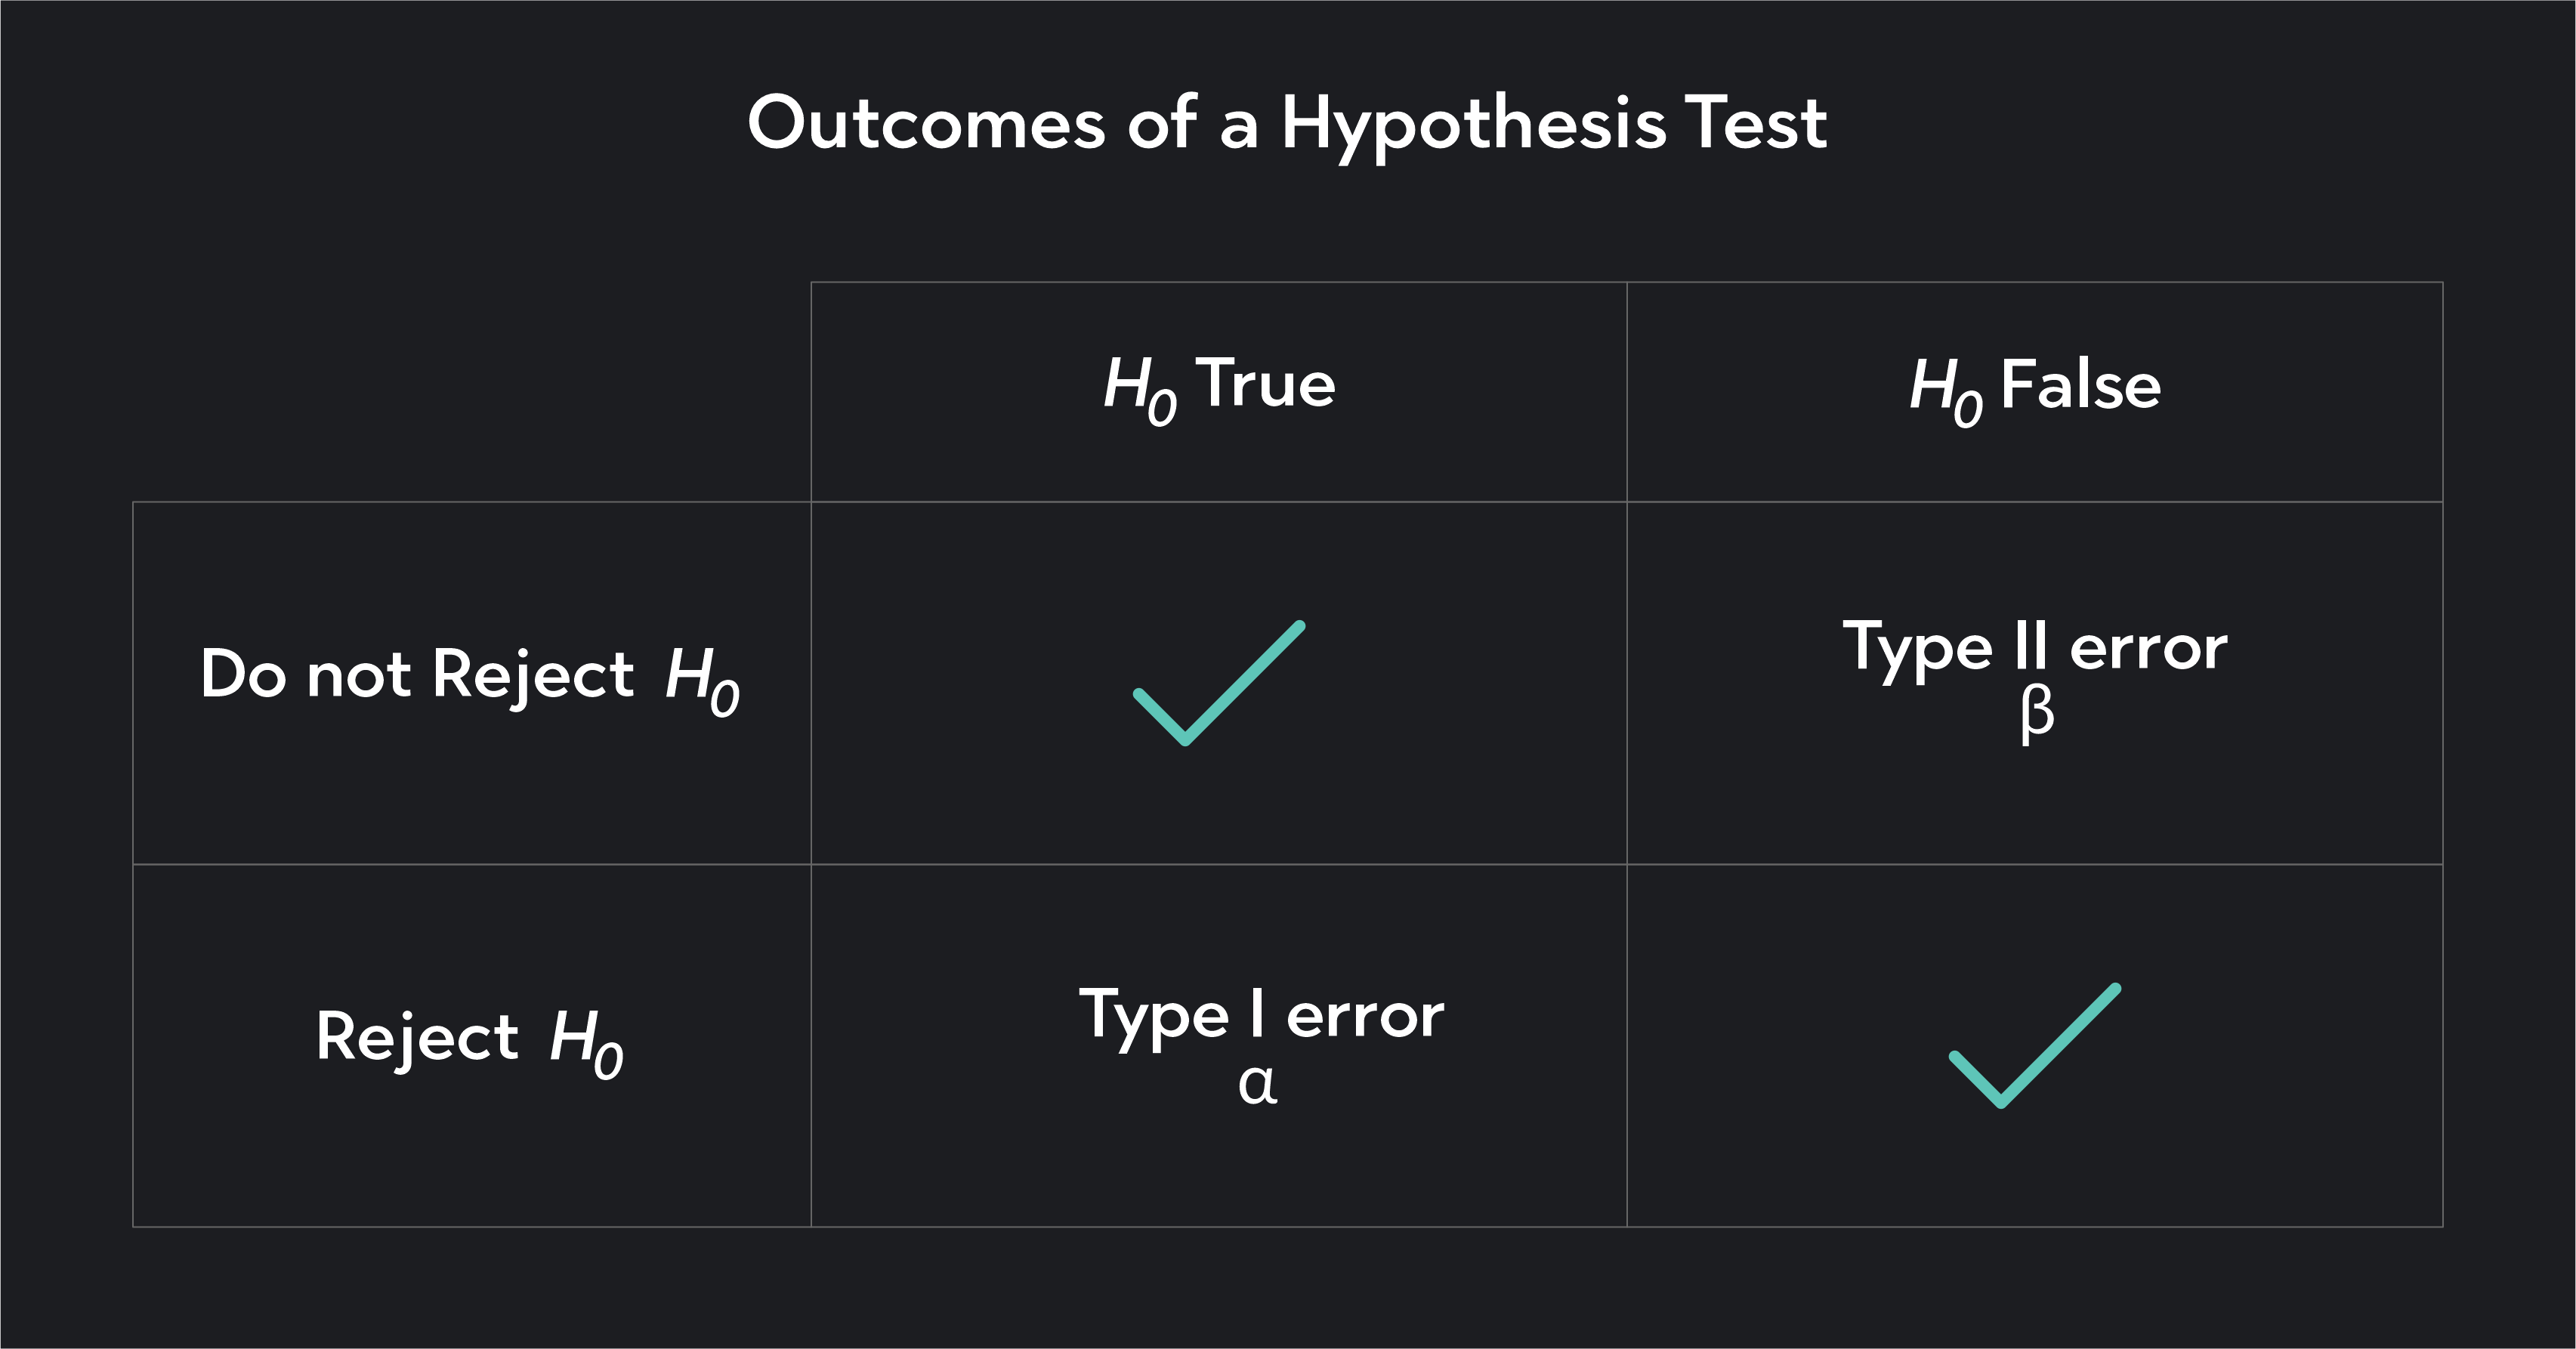
Always remember that statistical inference provides you with inferences based on probability rather than hard truths. Anytime you conduct a hypothesis test, there is a chance that you’ll reach the wrong conclusion about your data.
In statistics, we categorize these wrong conclusions into two types of errors:
Type I Errors
Type II Errors
A Type I error occurs when you reject the null hypothesis when, in fact, the null hypothesis is true. This is sometimes called a false positive and is analogous to a jury that falsely convicts an innocent defendant. The probability of making this type of error is represented by alpha, ɑ.
A Type II error occurs when you fail to reject the null hypothesis when, in fact, the null hypothesis is false. This is sometimes called a false negative and is analogous to a jury that reaches a verdict of “not guilty,” when, in fact, the defendant has committed the crime. The probability of making this type of error is represented by beta, ꞵ.
Outlier (from the co-founder of MasterClass) has brought together some of the world's best instructors, game designers, and filmmakers to create the future of online college.
Check out these related courses:


Statistics
Explore degrees of freedom. Learn about their importance, calculation methods, and two test types. Plus dive into solved examples for better understanding.
Subject Matter Expert

Statistics
Learn what is standard error in statistics. This overview explains the definition, the process, the difference with standard deviation, and includes examples.
Subject Matter Expert

Statistics
Learn what quartiles are and how they work in statistics. Understand how to calculate them and why even learn them.
Subject Matter Expert