
Economics
Understanding the Supply Curve & How It Works
Learn about what a supply curve is, how a supply curve works, examples, and a quick overview of the law of demand and supply.
Alejandro Diaz Herrera
Subject Matter Expert

Economics
04.04.2023 • 4 min read
Subject Matter Expert
Find out the difference between demand and quantity demanded. Plus learn how the quantity demanded affects society in everyday life and the economy.
In This Article
Demand and quantity demanded may sound the same, but in economics, they are distinct terms. In this article, we’ll explore the difference.
In economics and business, demand refers to the behavior of buyers in a market. More specifically, demand describes the relationship between prices of a good or service and the quantities that consumers are willing to purchase at those different prices.
The relationship between price and quantity is usually an inverse relationship, meaning that at higher prices, consumers demand fewer goods. At lower prices, they tend to demand more goods. In economics, we call this inverse relationship the Law of Demand.
Demand can be expressed as a table, as an equation, or as a graph.
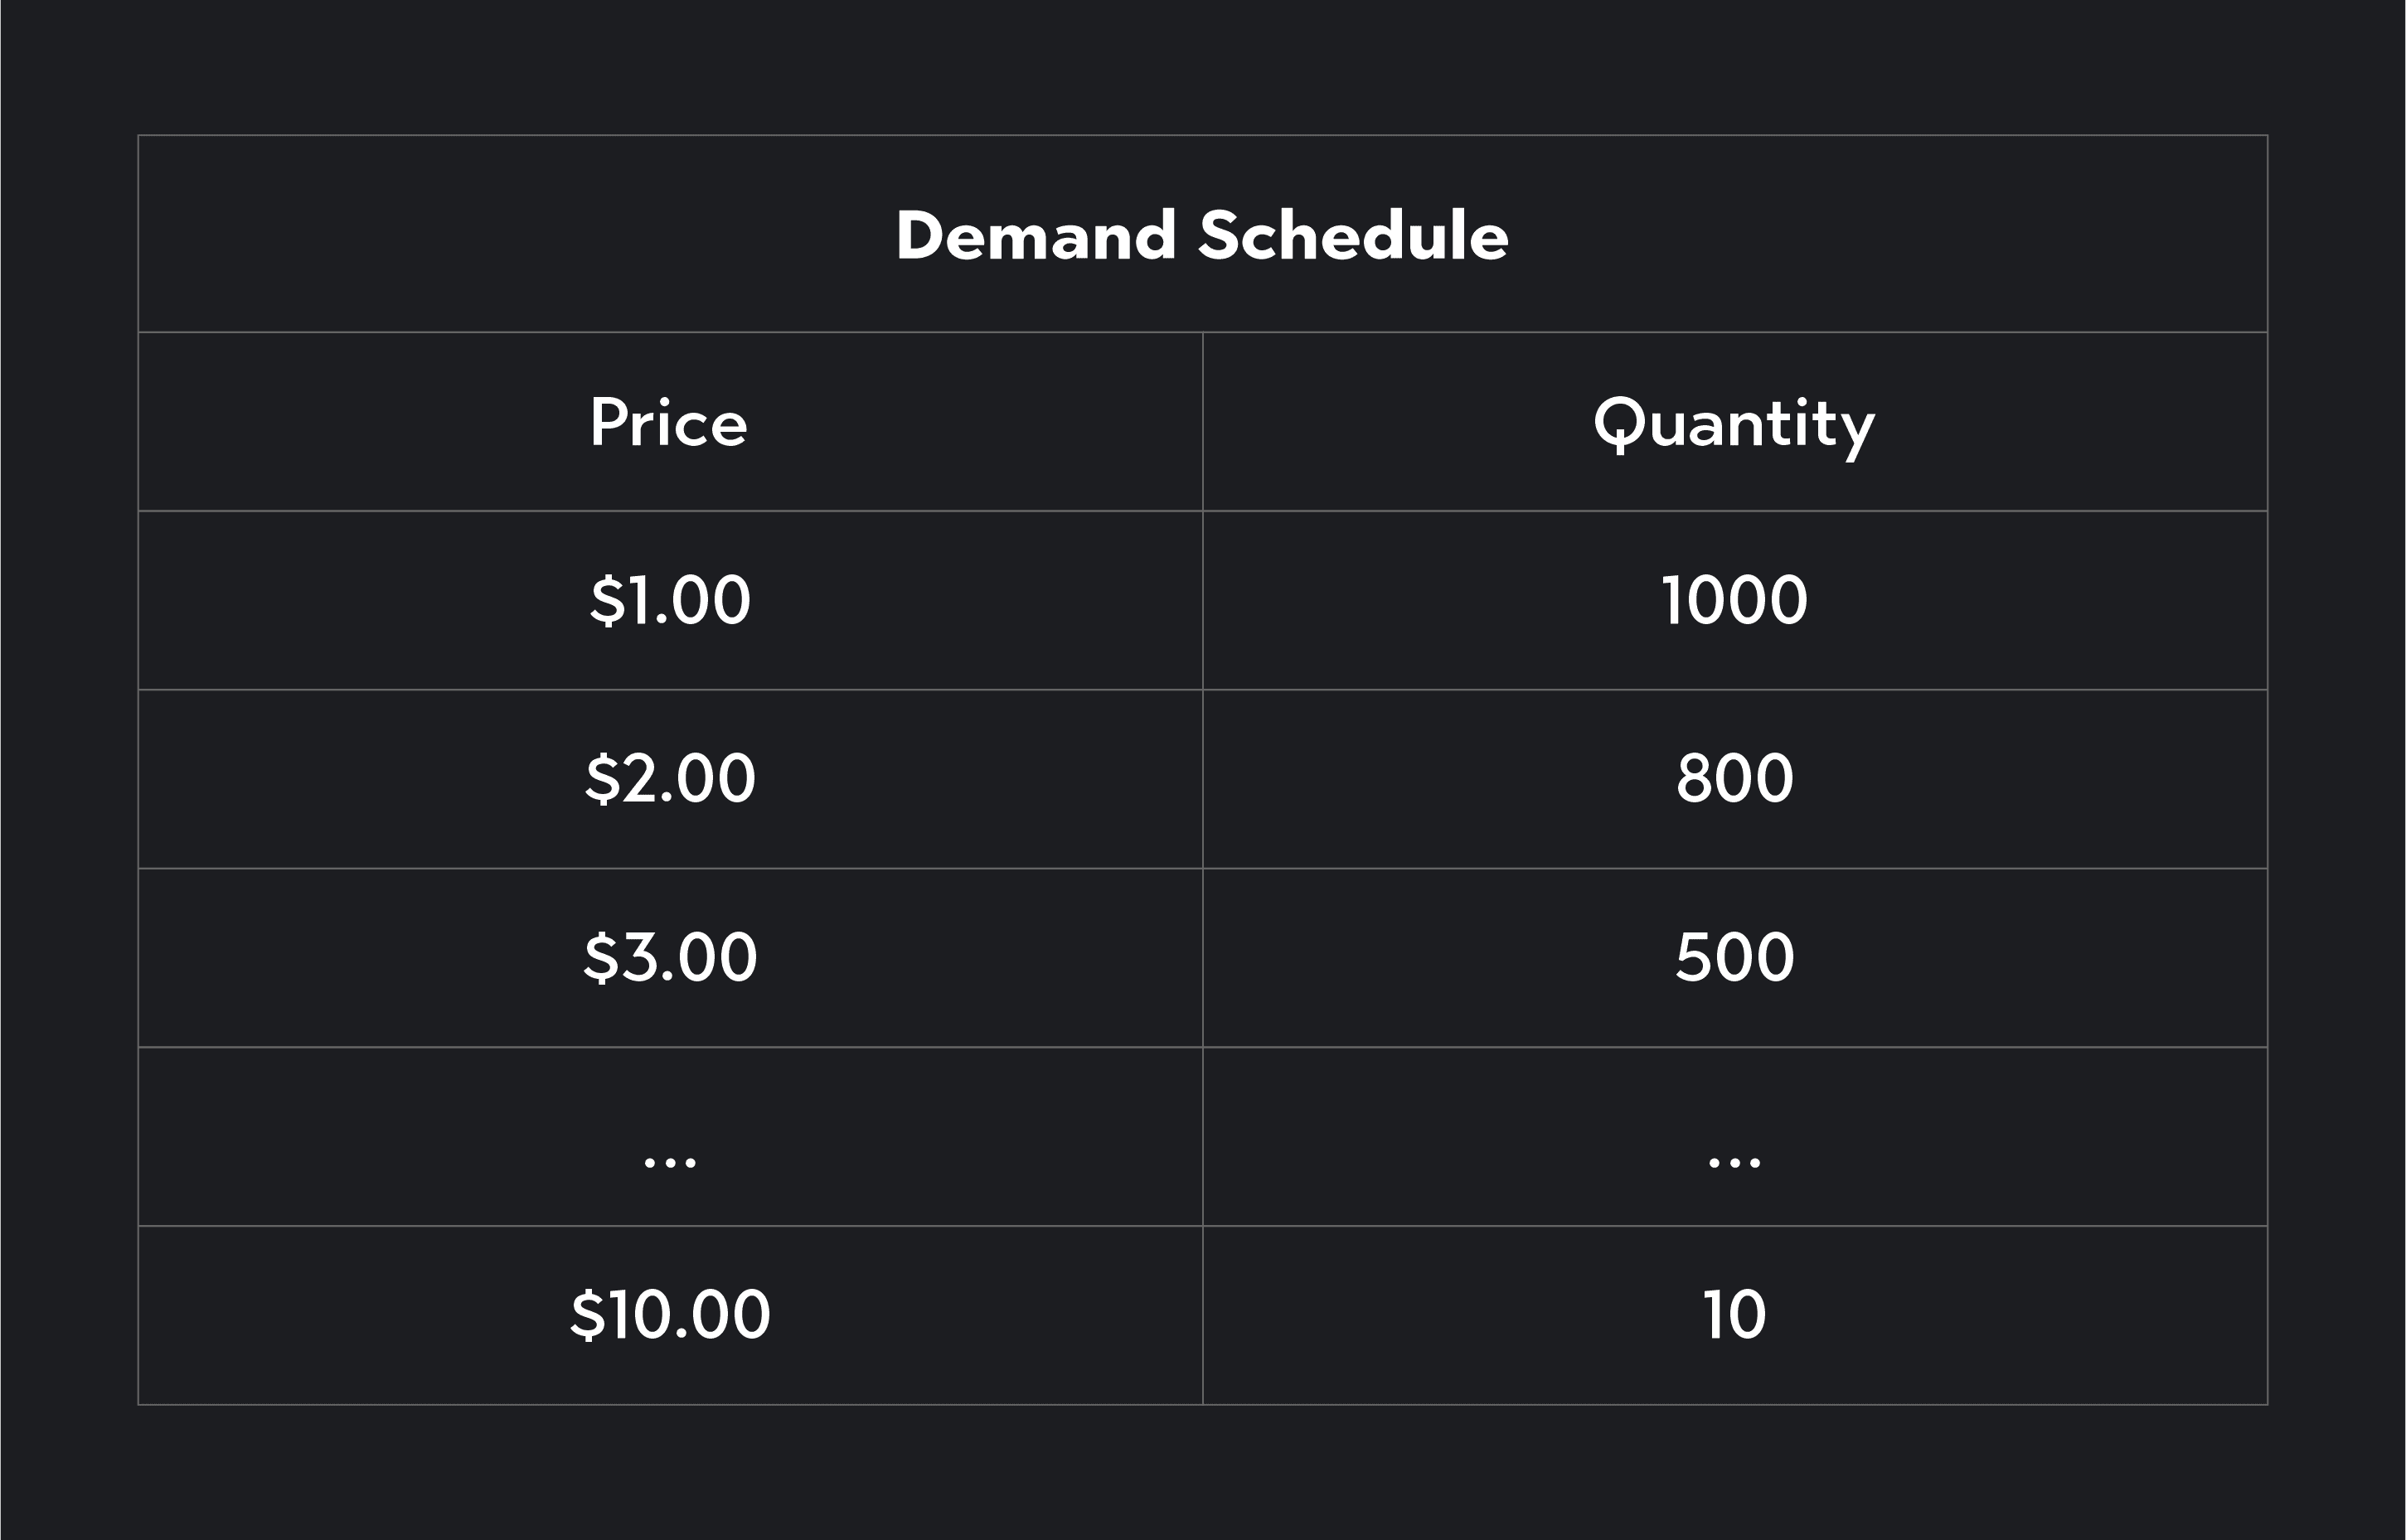
A demand schedule is a table showing demand, where one column shows prices and another column shows quantities.
A demand function is an equation that shows demand. It expresses quantity as a function of price.
Where:
Q = Quantity demanded
P = price
b = the slope of the demand curve
a = non-price determinants of demand
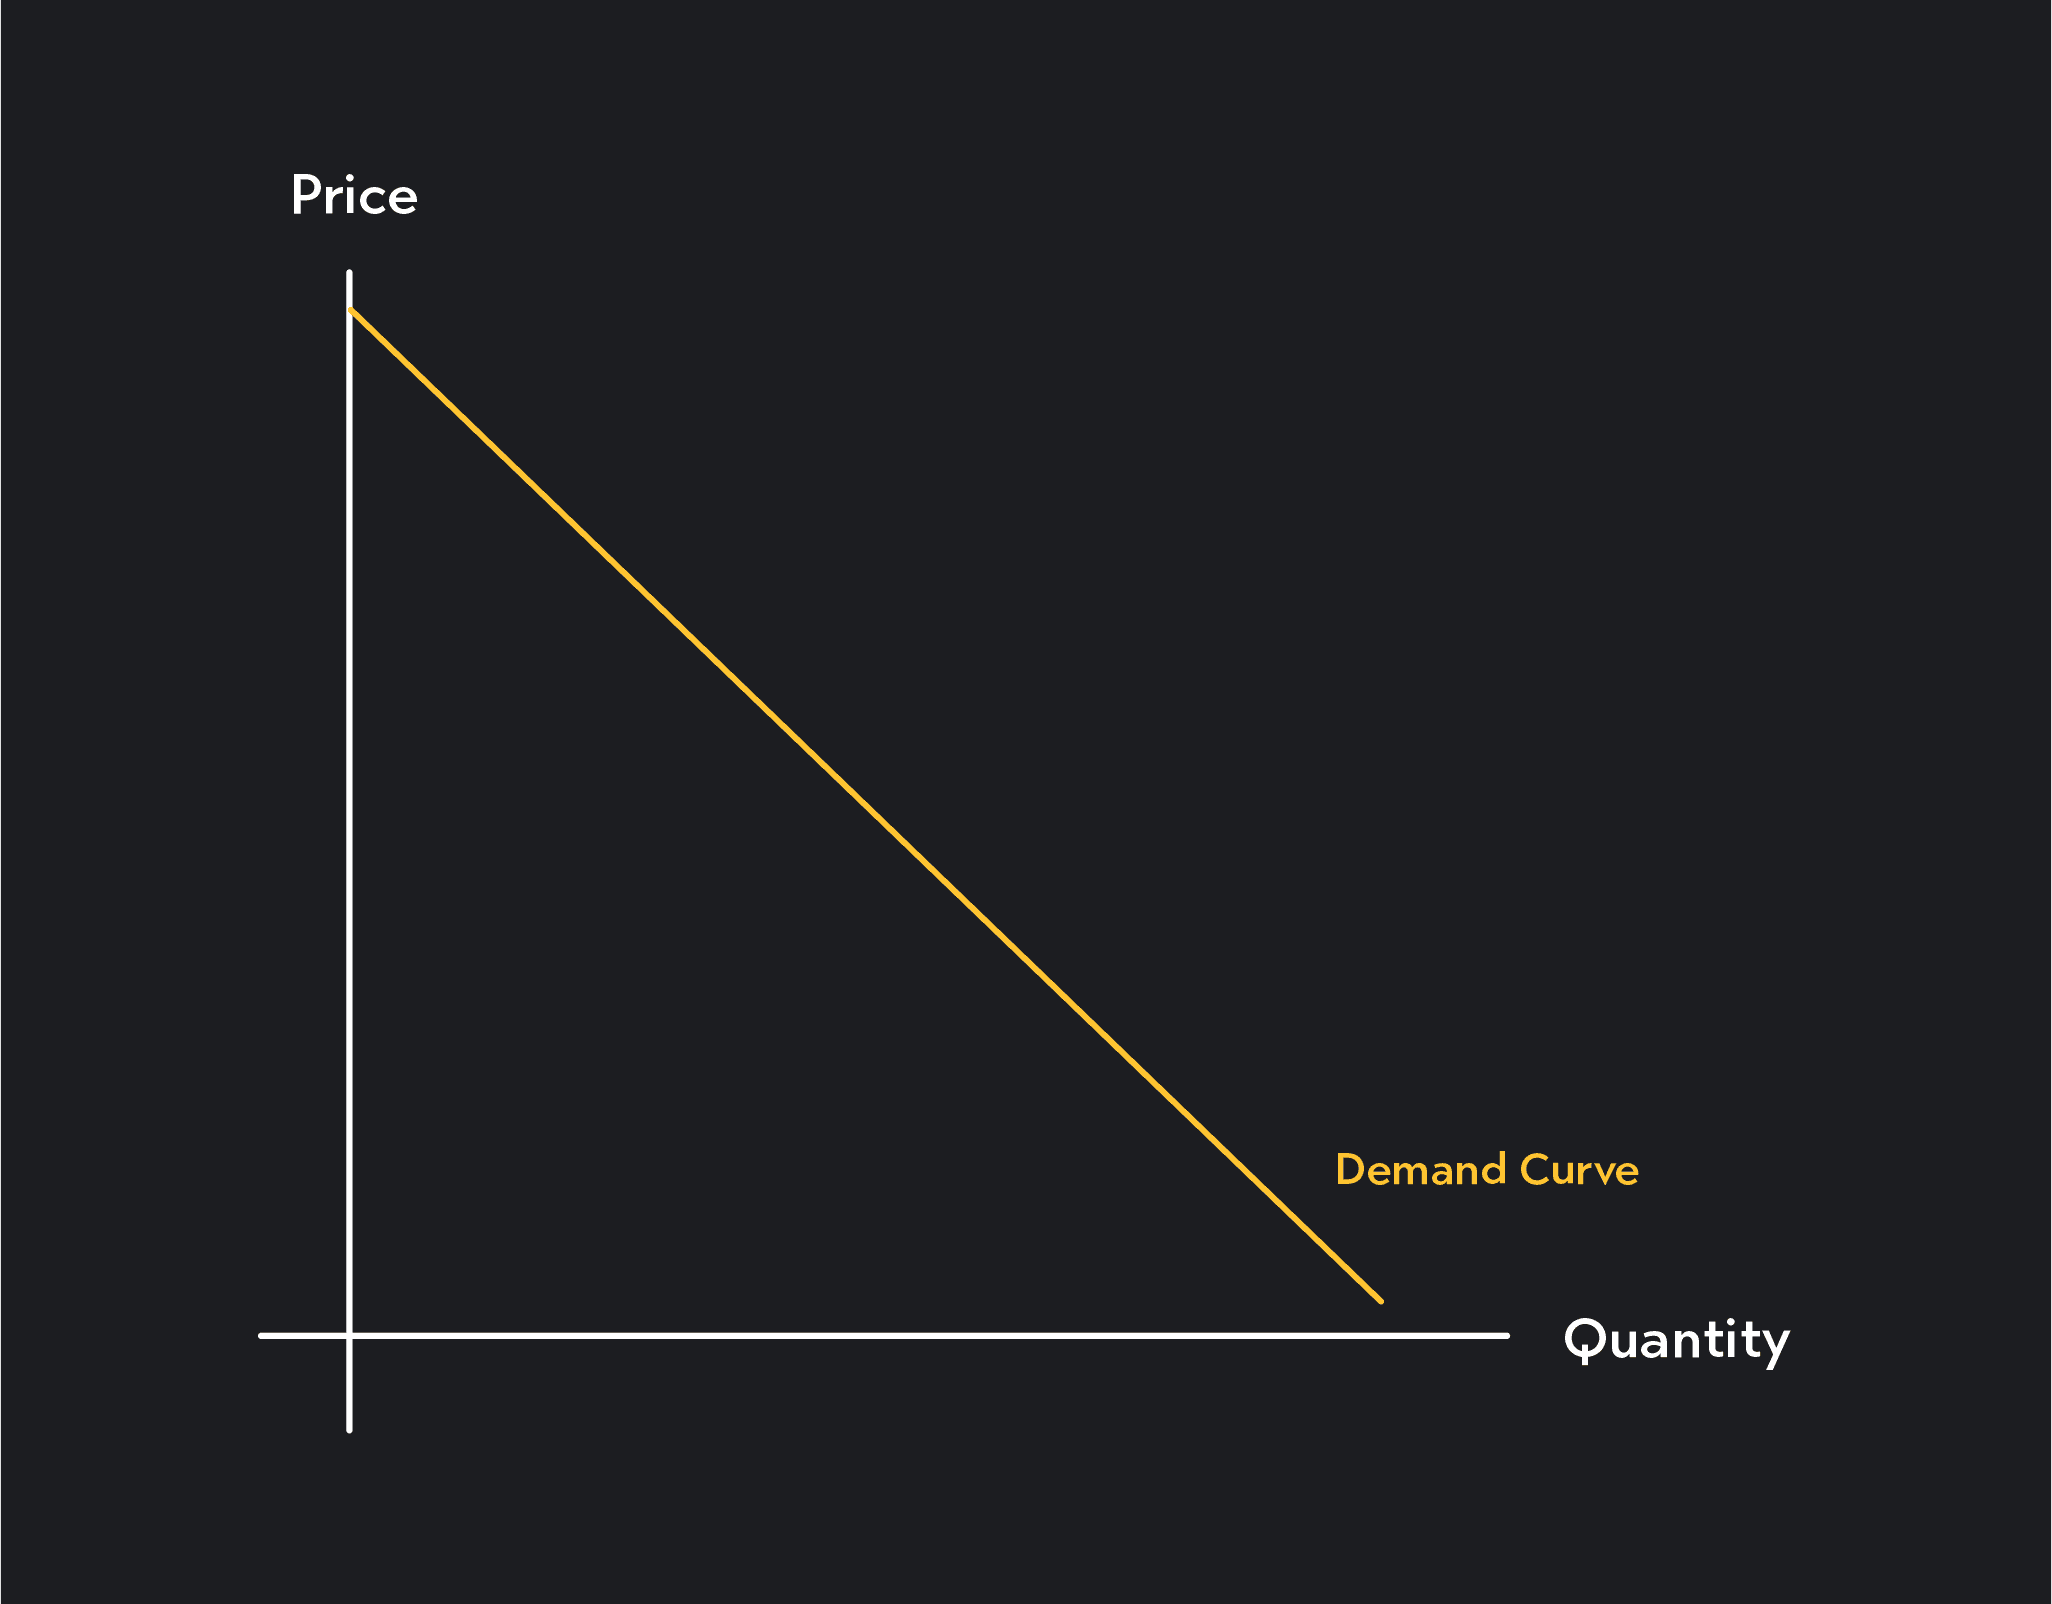
A demand curve is a graph of demand, where price is plotted along the vertical axis (y-axis), and quantity is plotted on the horizontal axis (x-axis). Demand curves tend to slope downward, showing how as price decreases, the quantity consumers demand increases.
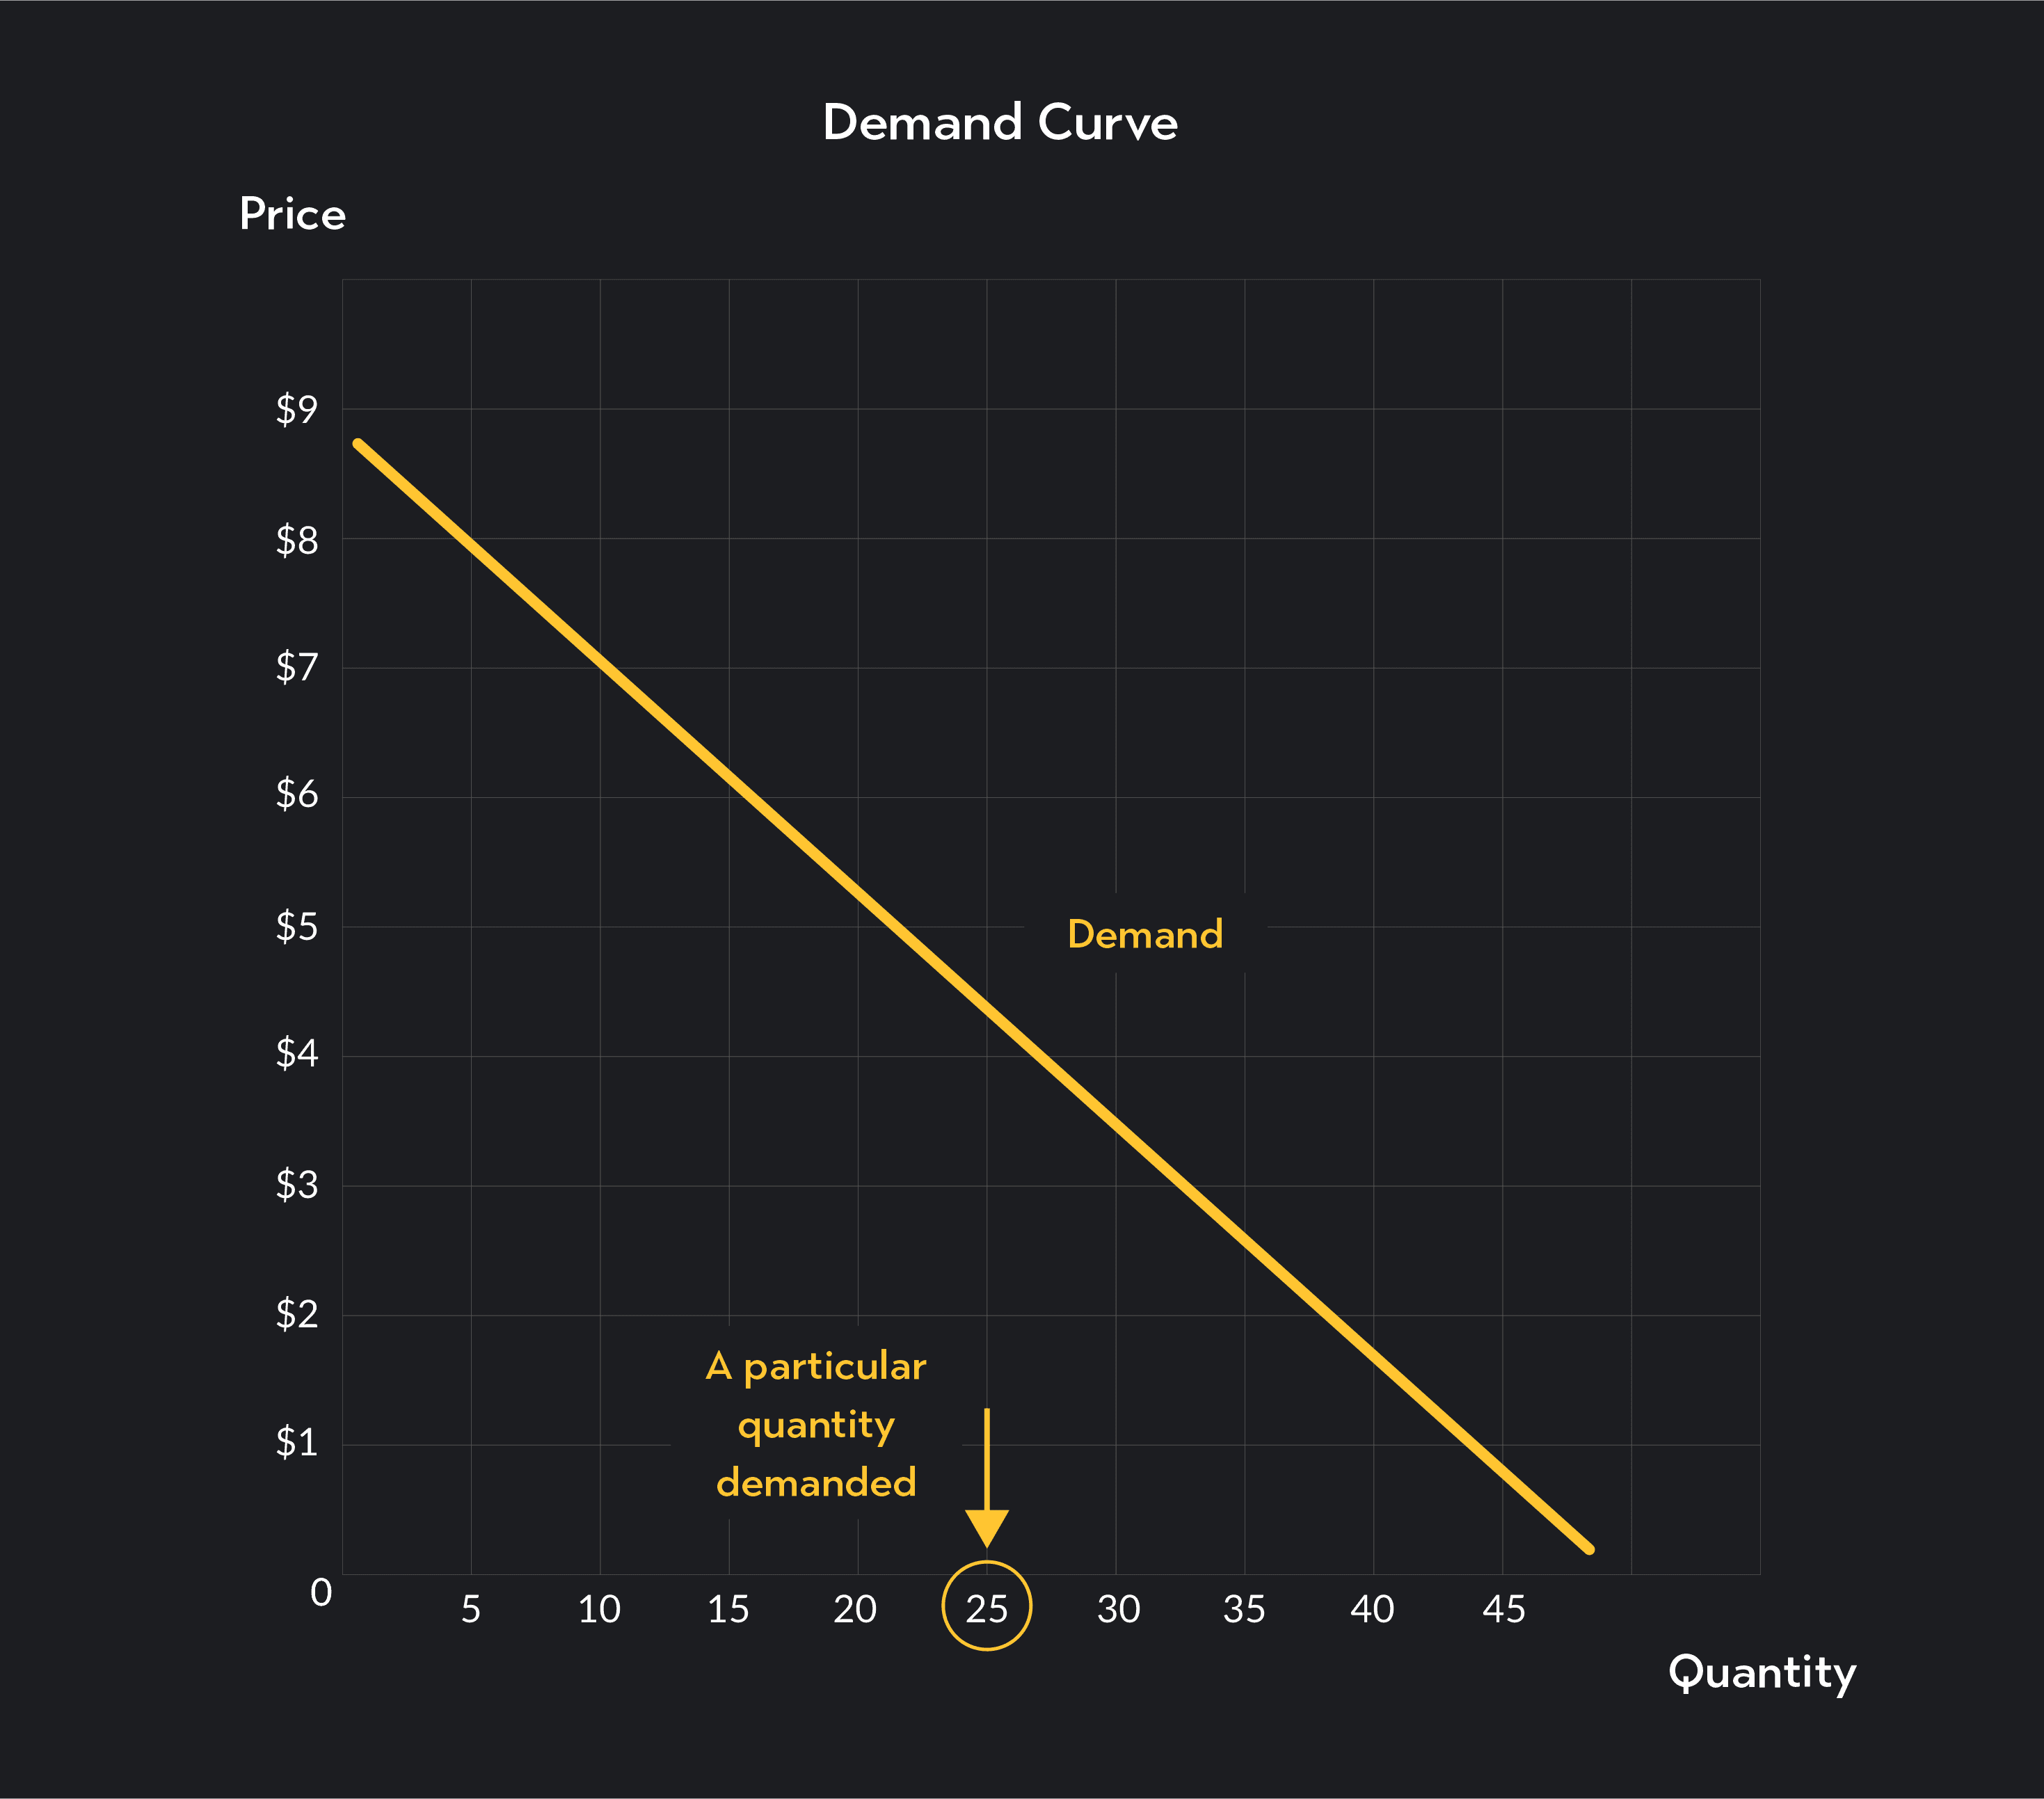
Quantity demanded refers to the quantity consumers demand at a specific price. For example, in a demand schedule, each cell in the quantity column of the table represents a different quantity demanded. Similarly, in a demand function, each price is associated with a different quantity demanded, and in a demand curve, each point along the demand curve is associated with a particular quantity demanded.
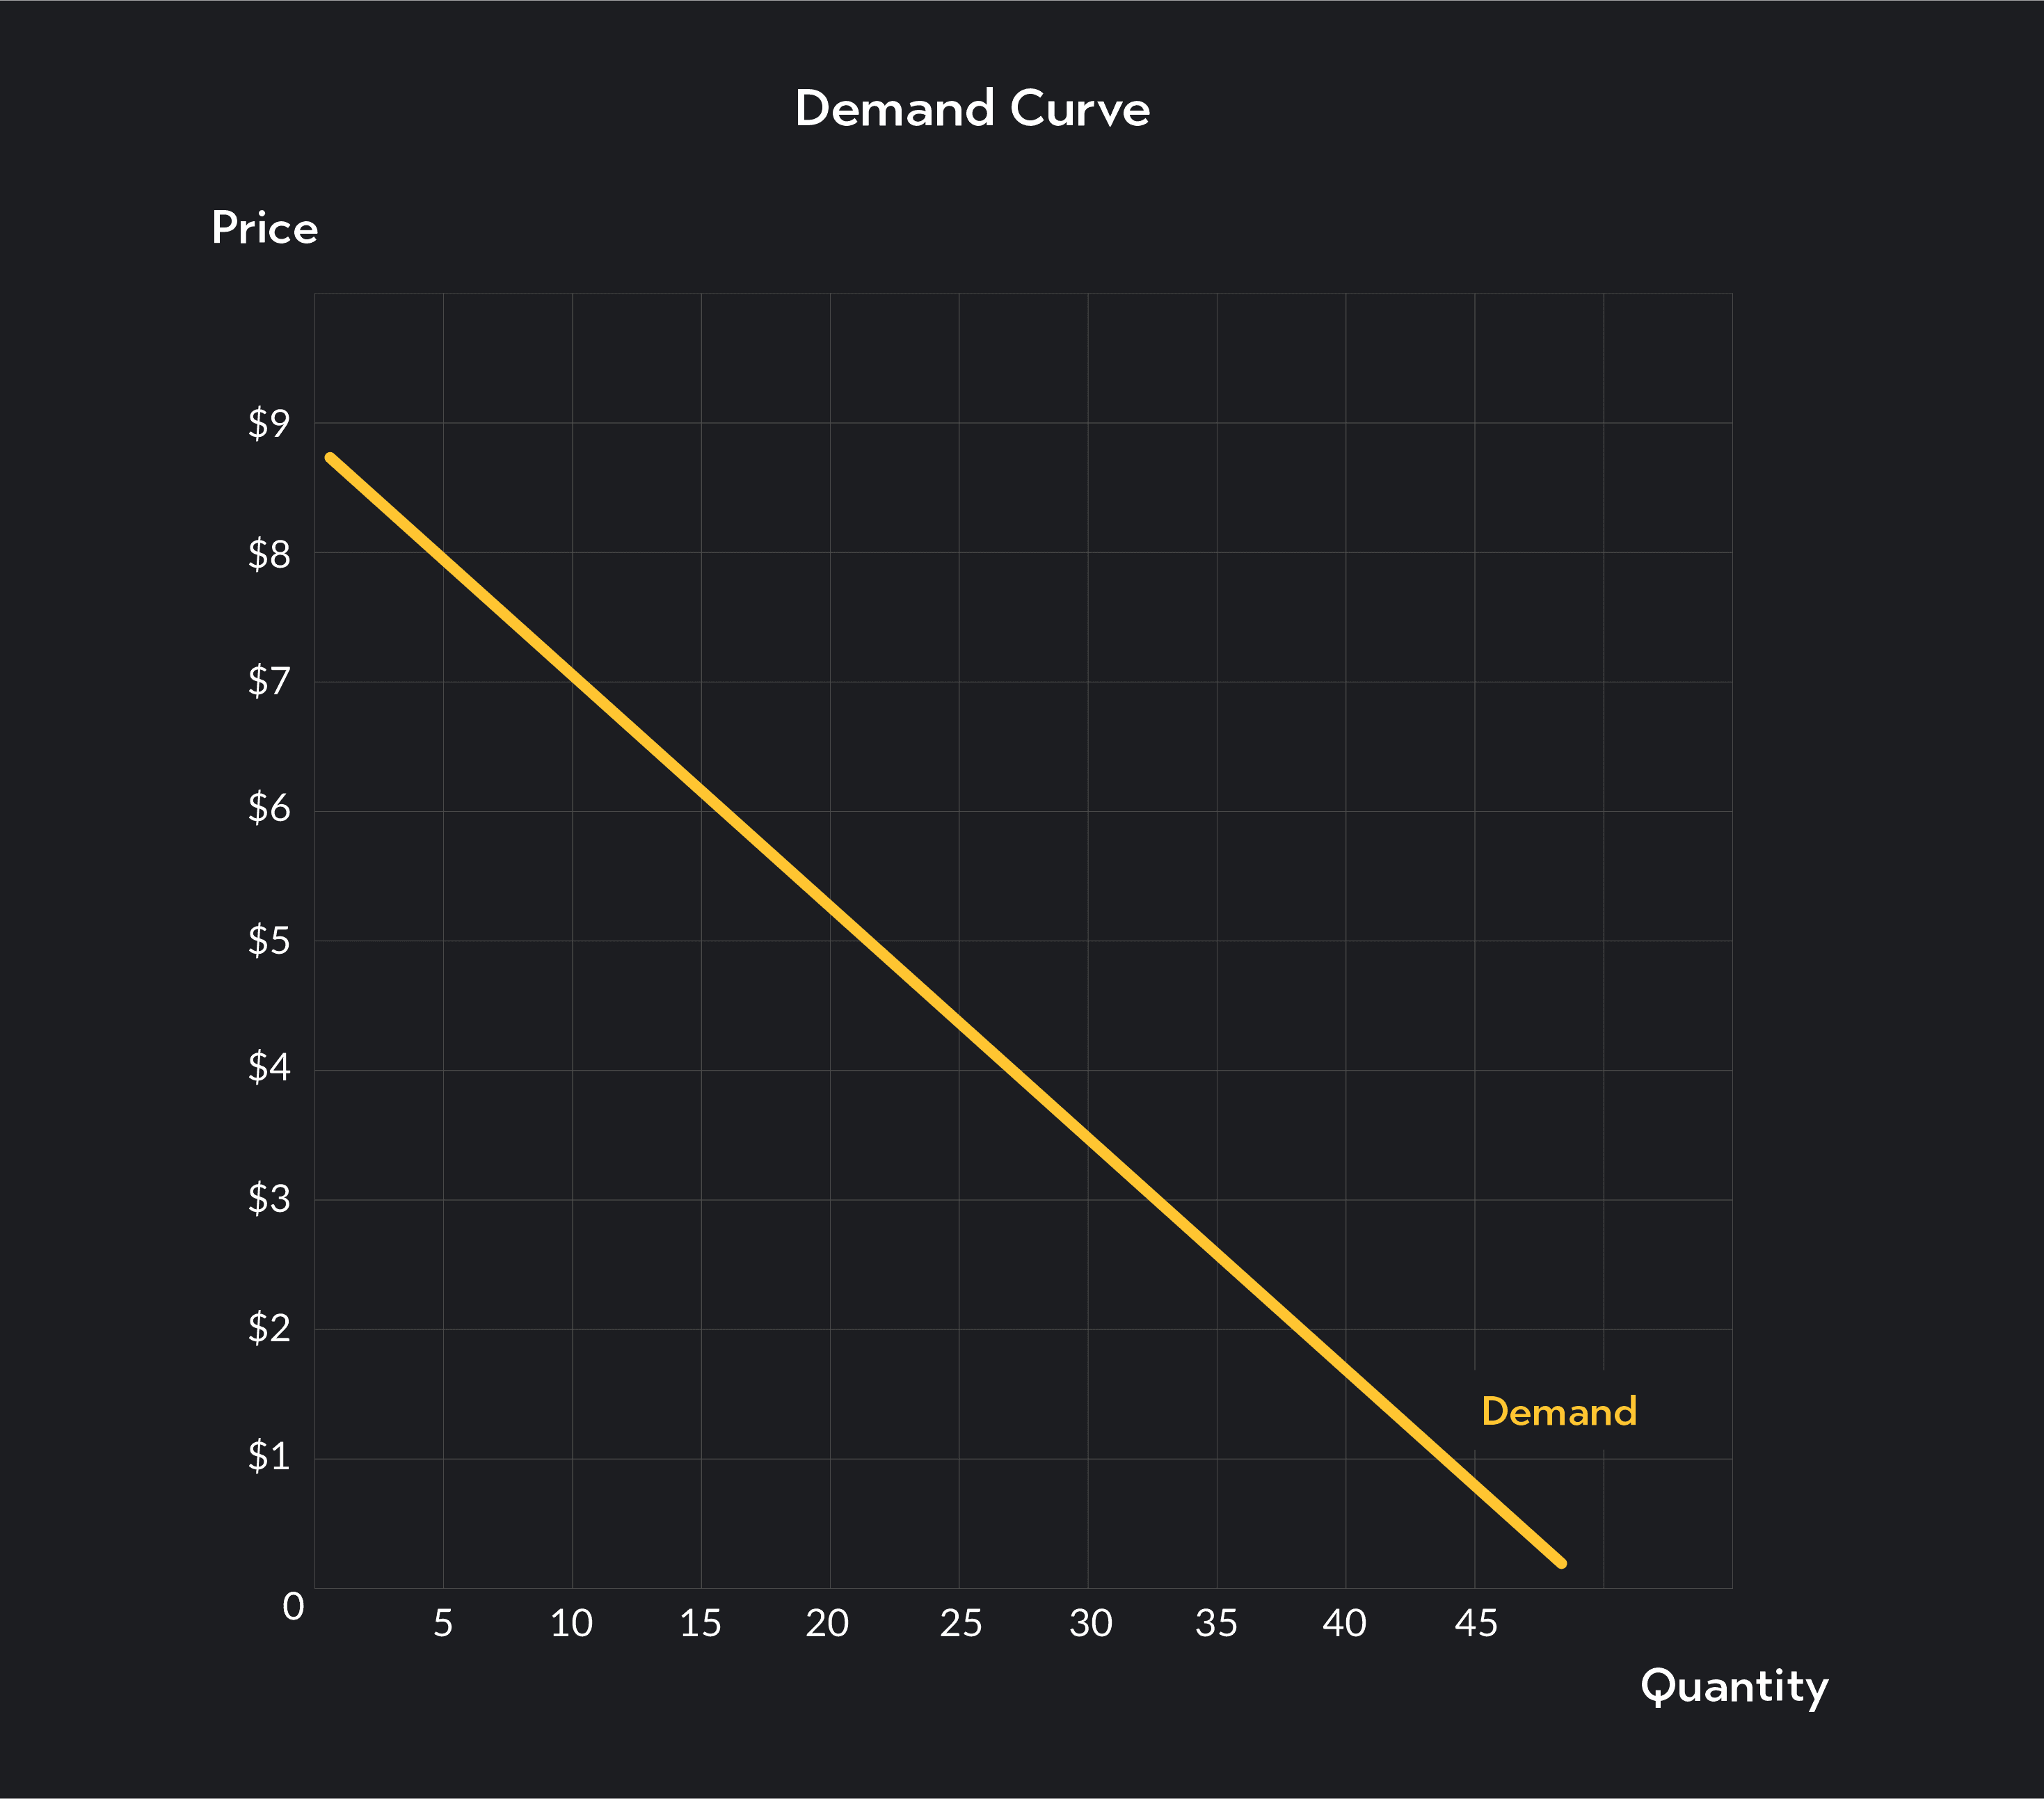
Let’s look at some examples. In the demand graph below:
Quantity demanded is 10 units at a price of $7
Quantity demanded is 20 units at price of $5.30
Quantity demanded is about 38 units at price of $2
The key difference between demand and quantity demanded is:
Demand refers to an entire demand curve or the general relationship between price and the quantities consumers are willing to buy.
Quantity demanded refers to a quantity associated with a particular price. On a demand curve, the quantity demanded is the quantity associated with a given point along the curve.
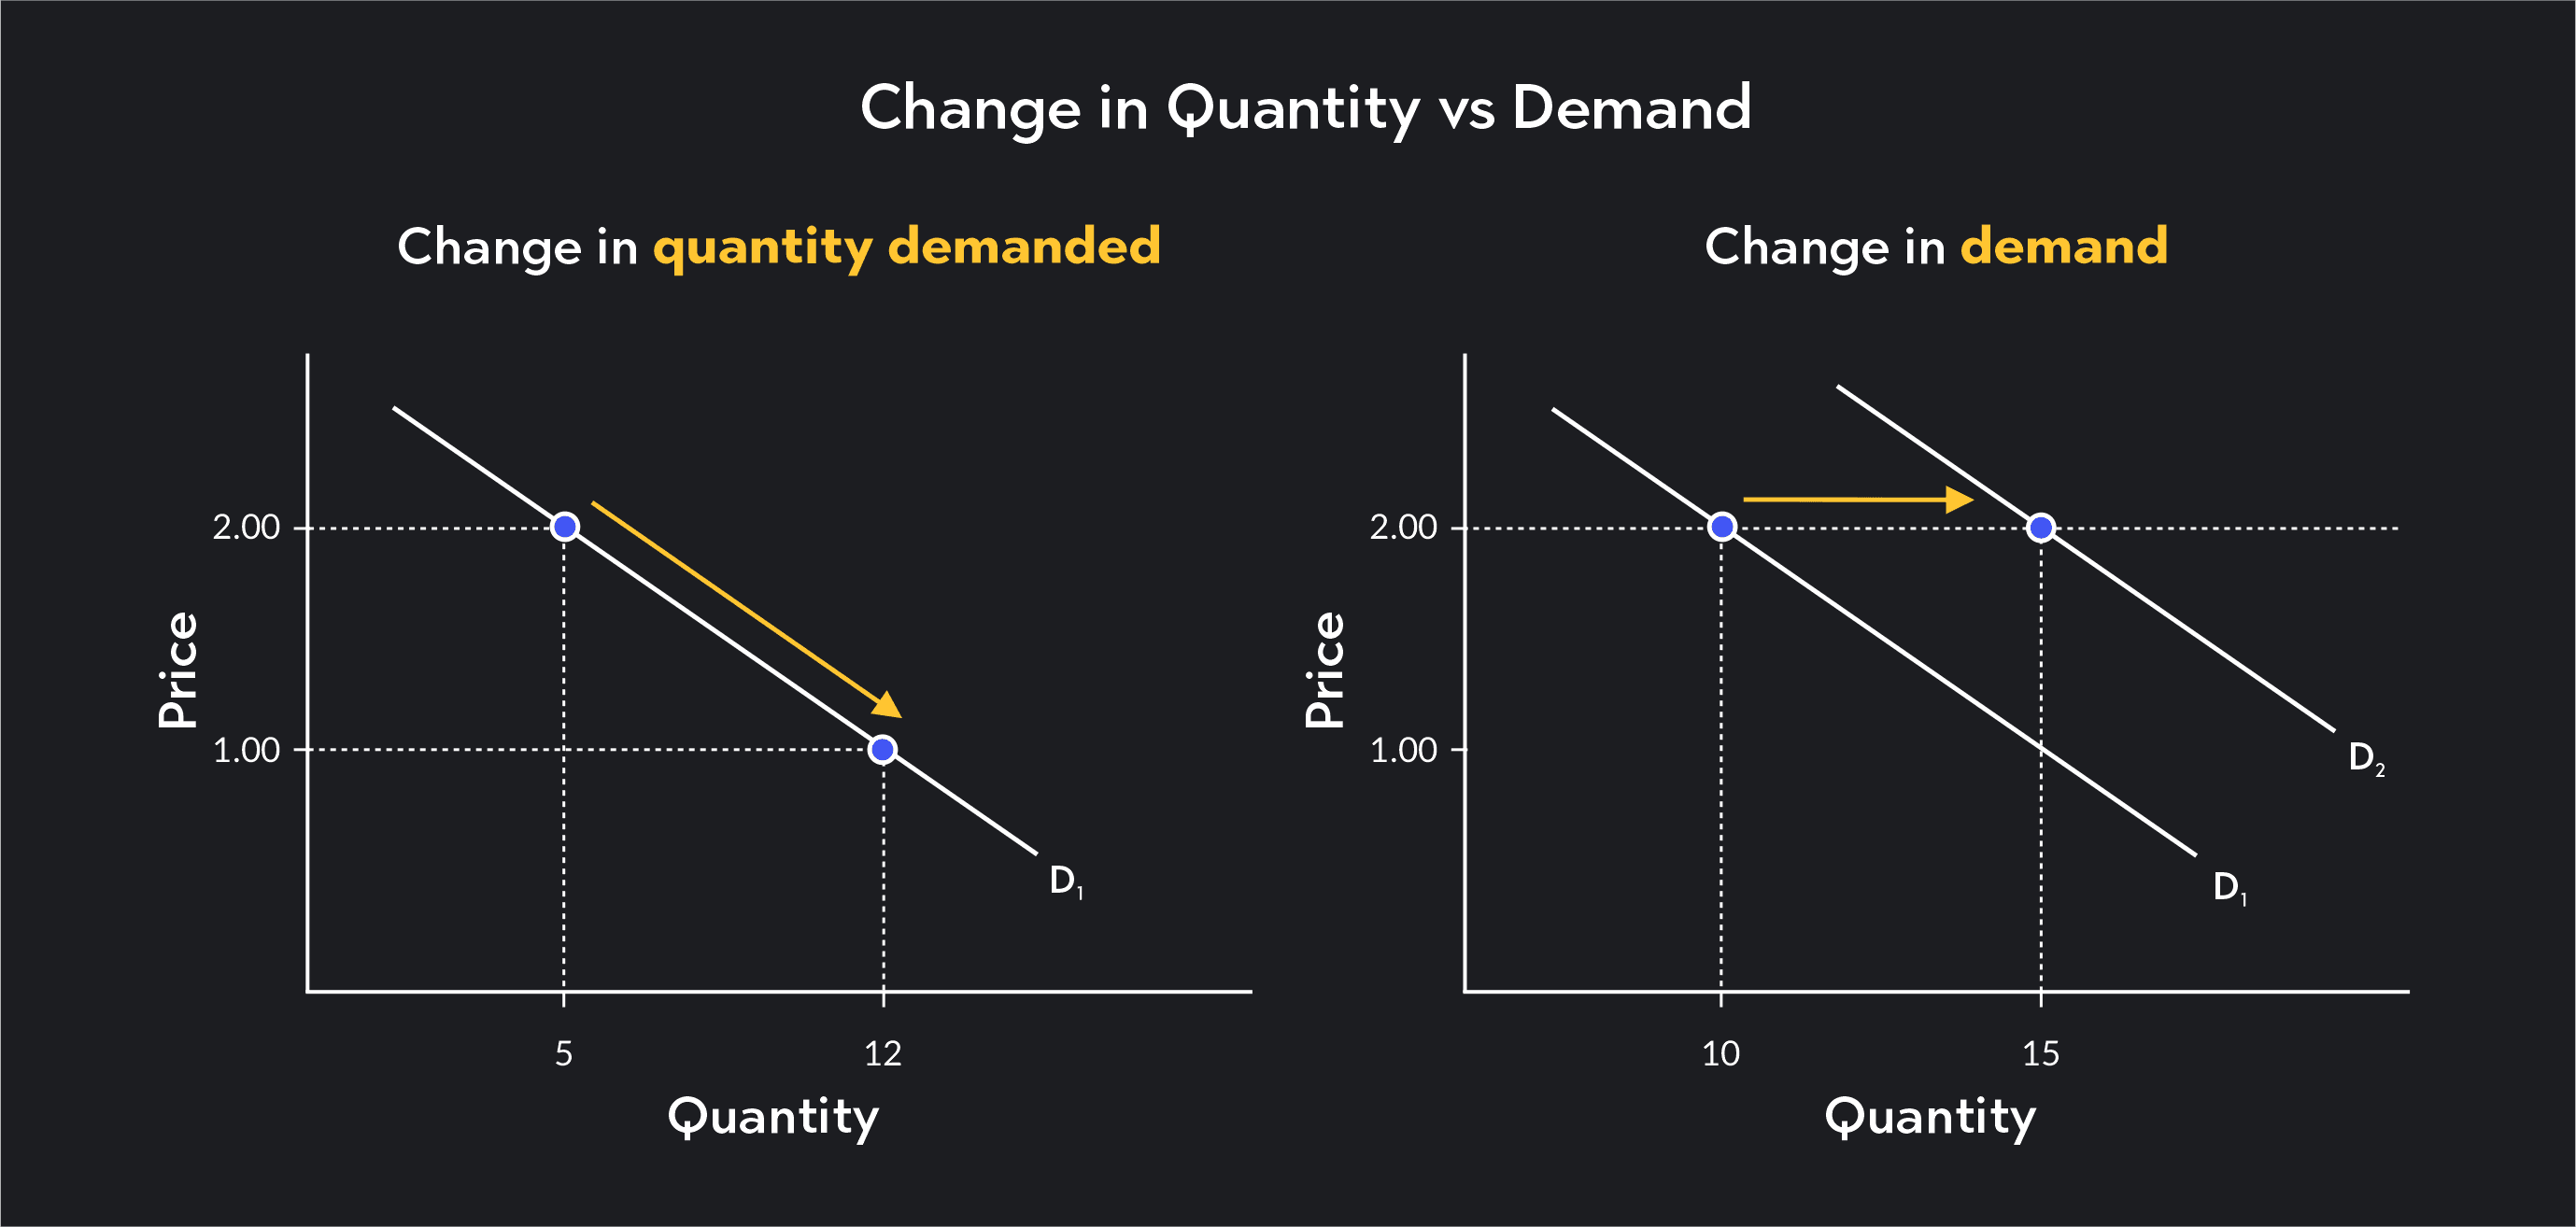
In addition to knowing the difference between demand and quantity demanded, you also need to understand the difference between a change in demand versus a change in quantity demanded.
A change in demand means that quantity demand has shifted at every given price. Demand changes for several reasons, including changes in consumer preferences or expectations, changes in the price of complements or substitutes, changes in the number of buyers in the market, and changes in consumer incomes.
On a demand curve, a change in demand is associated with a shift of the entire demand curve. When demand increases, the demand curve shifts to the right. And when demand decreases, the demand curve shifts to the left.
If demand increases, consumers will demand more goods at every price point.
If demand decreases, consumers will demand fewer goods at every price point.
A change in quantity demanded refers to a change in quantity demanded that results from a price change—this change assumes that all other factors influencing consumer behavior are held constant.
Following the law of demand, quantity demanded increases when the price of a product falls and decreases when price rises. The degree to which quantity rises or falls depends on the price elasticity of demand.
On a demand curve, a movement along the demand curve represents a change in the quantity demanded.
All else being equal, if the price of a good increases, the quantity demanded will decrease. We can show this as a movement up and to the left along the demand curve.
If the price of a good decreases, the quantity demanded will increase. We can show this as a movement down and to the right along the demand curve.
To learn more about the difference between movements along the demand curve and shifts of the demand curve, check out this guide on movements vs. shifts of demand. Plus here’s a full guide on elasticity of demand.
Demand and quantity demanded are core concepts in economics and help explain many changes we observe in real-world markets.
Here are two examples of changes in quantity demanded:
From December 2021 to December 2022, the market price of eggs in the U.S. increased by roughly 60% due to inflation and an outbreak of avian flu. As a result, consumers reduced the number of eggs they purchased by buying alternative sources of protein.
During sale events like Black Friday and President's Day sales, the quantity demanded explodes for many goods. Customers rush to make purchases during sale events to take advantage of lower prices.
Here are two examples of changes in demand:
In a period in the early 1600s known as the Tulip Mania, tulips grew immensely fashionable in Europe. Their sudden and appreciable increase in popularity led to an explosion in demand and a spike in the price of tulips.
Demand for meals at restaurants plummeted during the COVID-19 pandemic. The decrease in demand was so great it forced many restaurants to close.
For more examples of how changes in supply and demand affect prices and quantities sold, check out this article on supply and demand.
Outlier (from the co-founder of MasterClass) has brought together some of the world's best instructors, game designers, and filmmakers to create the future of online college.
Check out these related courses:
Economics
Learn about what a supply curve is, how a supply curve works, examples, and a quick overview of the law of demand and supply.
Subject Matter Expert

Economics
Here’s a simple explanation of how changes in demand and supply affect the equilibrium point with graphs and practice questions.
Subject Matter Expert
Economics
This article explains what equilibrium means in microeconomics. Learn what equilibrium looks like in the economic model of supply and demand under perfect competition.
Subject Matter Expert