Economics
Understanding the Demand Curve and How It Works
Learn what the demand curve is, how to calculate it, how it works, and the different types. Plus learn what causes it to shift and movements along it.
Sarah Thomas
Subject Matter Expert

Economics
03.27.2023 • 4 min read
Subject Matter Expert
Learn what changes quantity demanded, the difference between a change in demand and a change in quantity demand. And more!
In This Article
In economics, quantity demanded refers to a quantity of a good or service consumers are willing to buy at a given price. For example, if consumers are willing to purchase 500 oranges at a price of $1.00, we say the quantity demanded is 500 at a price of $1.00.
Quantity demanded is not the same as demand, so be careful not to confuse the two terms. For any good or service, demand represents the full set of quantities consumers are willing to purchase at various per-unit prices. Quantity demanded, meanwhile, refers to a particular quantity linked to a specific price.

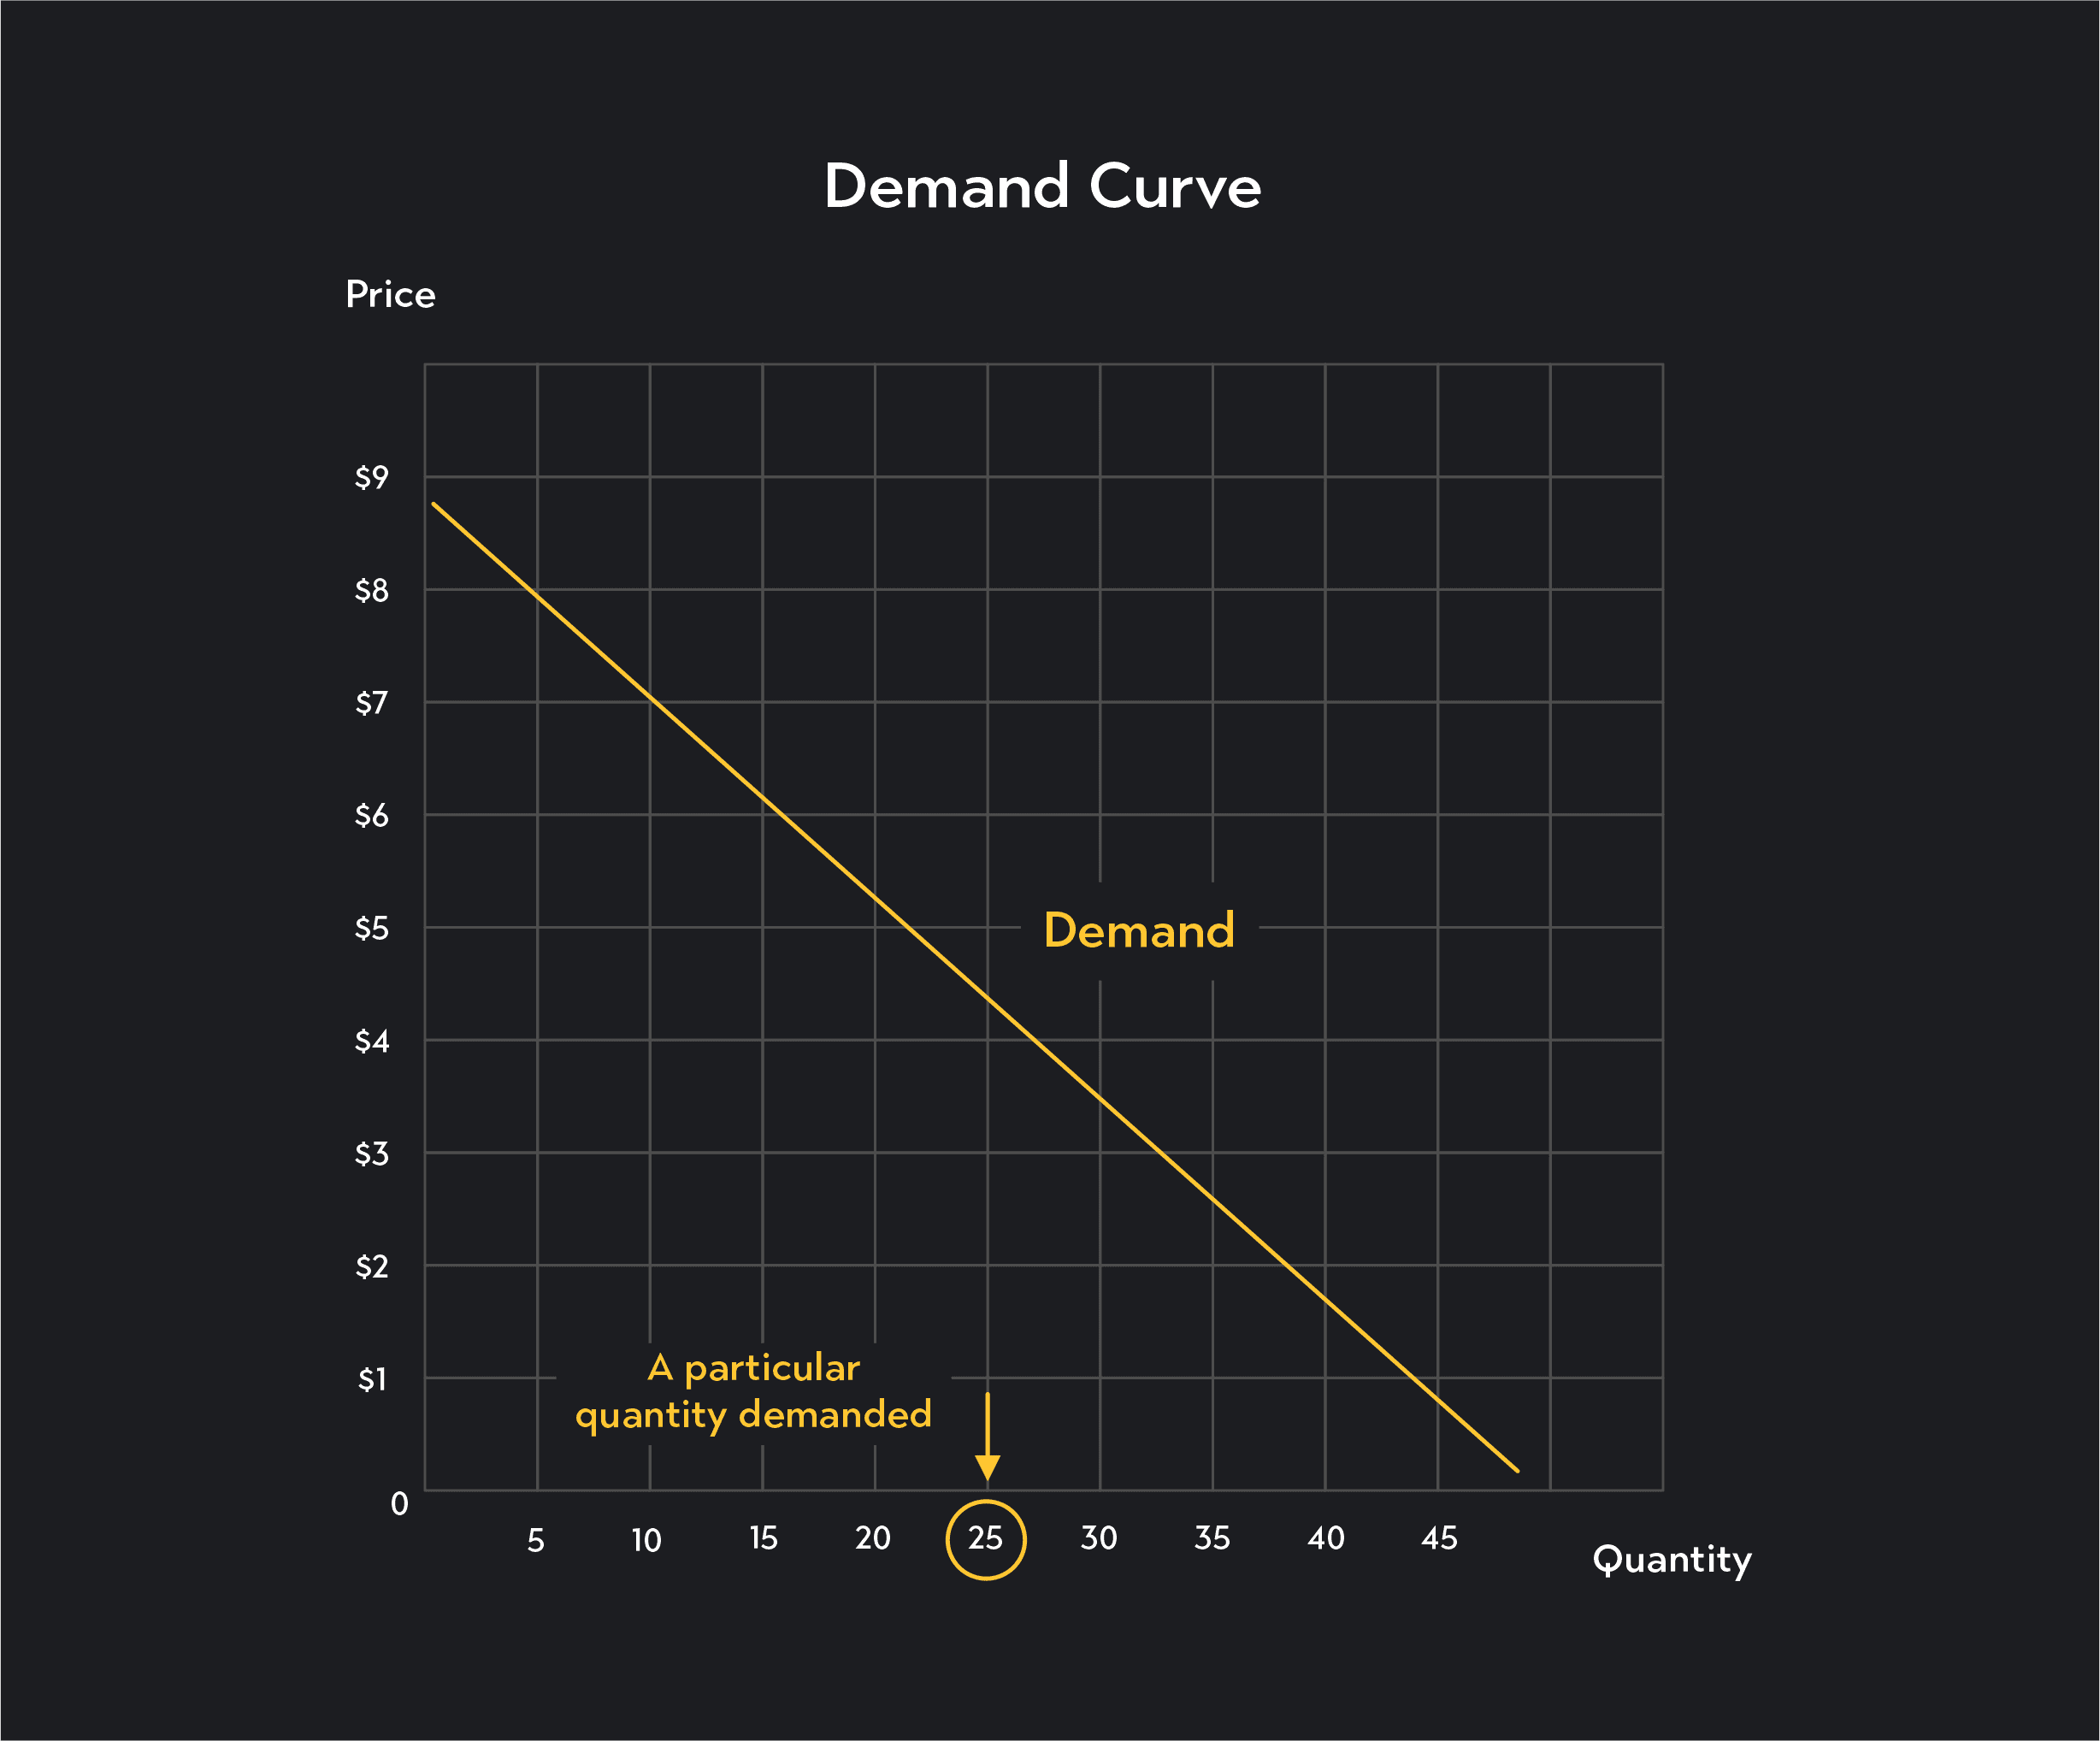
On a graph, demand refers to the entire demand curve, while quantity demanded refers to a quantity associated with a given point along the demand curve.
Here’s an overview of the demand curve and quantity demanded:
Quantity demanded changes in response to a ceteris paribus change in price. Ceteris paribus is a Latin phrase meaning all else being equal. If everything else that could affect consumer behavior is held constant—and the price of a good or service increases—consumers typically respond by reducing the quantity they demand. Conversely, if there’s a ceteris paribus decrease in price, consumers tend to increase the quantity demanded.
All else being equal, if the market price increases, quantity demanded decreases
All else being equal, if the market price decreases, quantity demanded decreases
Economists call the inverse relationship between price and quantity demanded the Law of Demand. The Law of Demand is the reason most demand curves slope downward. The law of demand doesn’t hold for every product, but it describes the behavior of buyers in most markets.
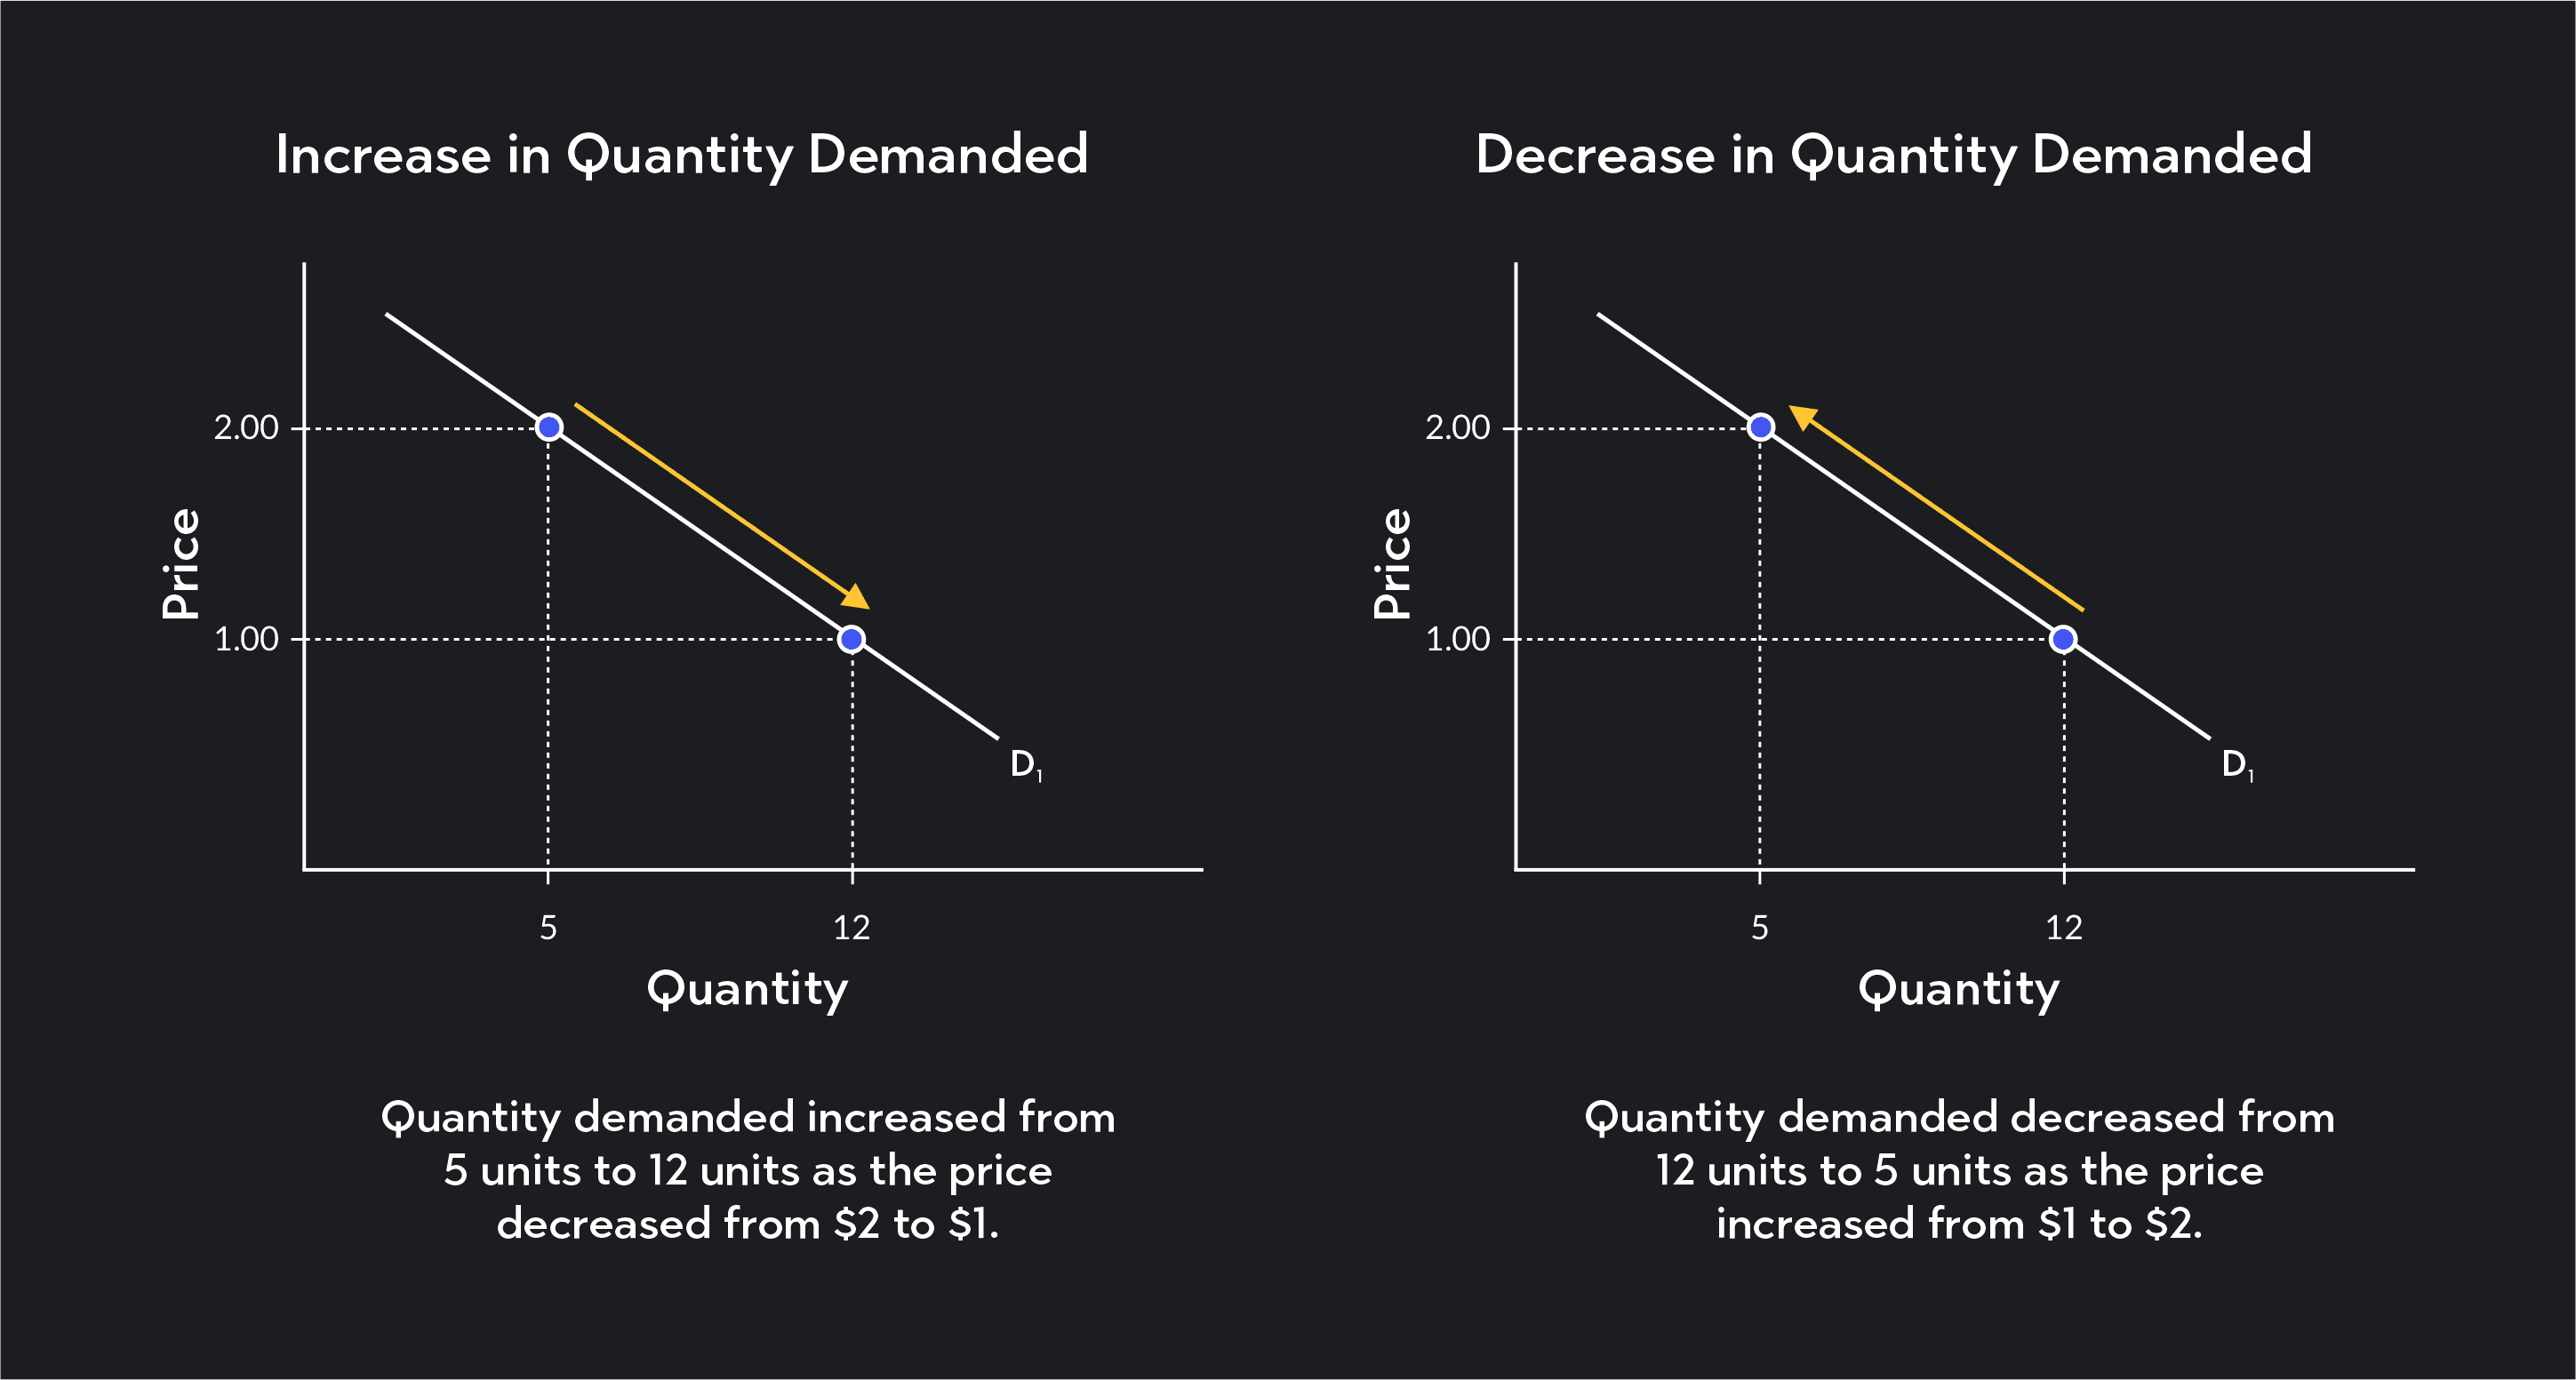
On a demand curve, you can show changes in quantity demanded as a movement along the demand curve.
An increase in the quantity demanded is equivalent to a movement down and to the right along the demand curve.
A decrease in quantity demanded is equivalent to a movement up and to the left along the demand curve.

Changes in quantity demanded are not the same as a change in demand. While quantity demanded changes in response to a ceteris paribus change in price, non-price determinants of demand cause changes in demand.
On a graph, a change in quantity demanded is equivalent to a movement along the demand curve. While a change in demand is equivalent to a shift of the entire demand curve. The demand curve shifts to the right if demand increases and shifts to the left when demand decreases.
When a product becomes more popular, demand shifts to the right. As it becomes less popular, demand shifts to the left.
When the price of a complement decreases/increases, demand shifts to the right/left. When the price of a substitute decreases/increases, demand shifts to the left/right.
If consumers believe future prices will decrease, demand temporarily shifts to the left. If consumers believe future prices will increase, demand temporarily shifts to the right.
If the number of potential buyers in a market increases, demand shifts to the right. If the number of potential buyers in a market decreases, demand shifts to the left.
For a normal good, an increase in consumer income will shift demand to the right, and a decrease in income will shift demand to the left. For an inferior good, the income effect works in the opposite direction. An increase in consumer income will shift demand to the left, and a decrease in income will shift demand to the right.
Earlier, we said a ceteris paribus change in price causes a change in quantity demanded, but what causes a ceteris paribus change in price?
From the perspective of buyers, a ceteris paribus change in price can occur as the result of a change in supply. Supply represents the seller side of the market. It is through the interaction of supply and demand that we determine the equilibrium price and the equilibrium quantity sold in a market.
Unlike demand, a positive relationship between price and quantity known as the Law of Supply governs supply. Graphically, an upward-sloping supply curve represents supply. The supply curve shows how ceteris paribus and higher prices are linked to a higher quantity supplied. It also shows how lower prices are linked to a lower quantity supplied.
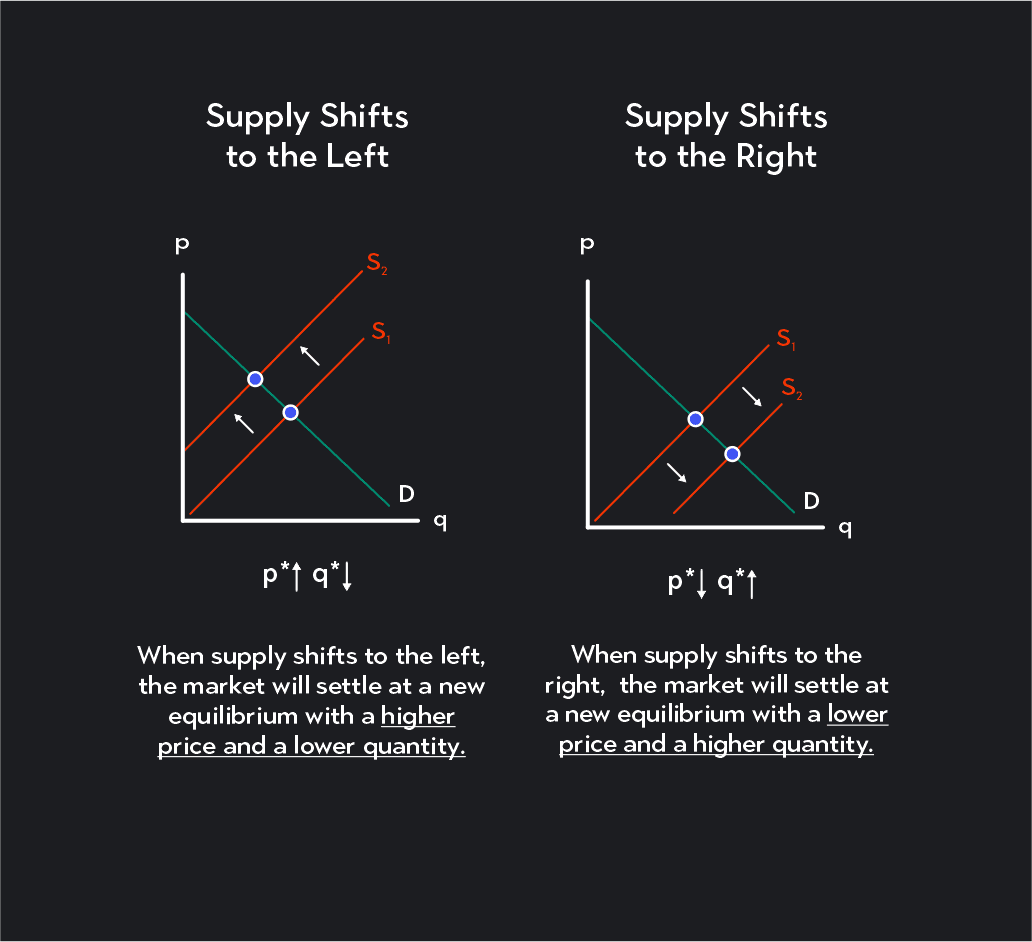
When supply increases, the entire supply curve shifts to the right and puts downward pressure on prices in the market. Because of a rightward shift in supply, you will see a decrease in the market price and an increase in quantity demanded.
Conversely, when supply decreases, the entire supply curve shifts to the left and puts upward pressure on prices in the market. As a result of a leftward shift in supply, you will see an increase in the market price and a decrease in quantity demanded.

Outlier (from the co-founder of MasterClass) has brought together some of the world's best instructors, game designers, and filmmakers to create the future of online college.
Check out these related courses:

Economics
Learn what the demand curve is, how to calculate it, how it works, and the different types. Plus learn what causes it to shift and movements along it.
Subject Matter Expert

Economics
This article is a comprehensive guide on the causes for a demand curve to change. Included are five common demand shifter examples.
Subject Matter Expert

Economics
Learn the key differences with a movement and shift in the demand curve. We’ll give a complete overview with real-world examples.
Subject Matter Expert