Economics
Understanding the Demand Curve and How It Works
Learn what the demand curve is, how to calculate it, how it works, and the different types. Plus learn what causes it to shift and movements along it.
Sarah Thomas
Subject Matter Expert

Economics
03.30.2023 • 4 min read
Subject Matter Expert
Learn what causes movement along the demand curve, the key differences between shift and movement, and what demand is and what affects it.
In This Article
In economics, you learn to model markets using supply and demand. An important distinction to remember when working with the supply and demand model is the difference between a movement along a demand curve and a shift of the demand of the entire demand curve. In this article, we’ll explain the difference.
In economics, demand refers to the quantities of a good or a service consumers are willing and able to purchase at various prices.
Graphically, economists represent demand using a demand curve, which is a downward-sloping line or curve showing the inverse relationship between price on the vertical axis and quantity demanded on the horizontal axis. Each point along a demand curve links a given price to a particular quantity demanded. In the graph below, consumers demand Q1 units of the good at price P1, Q2 units of the good at price P2, and so on.

Over time, quantity demanded, and demand more generally, can change. A change in quantity demanded is represented by a movement along a fixed demand curve.
Changes in quantity demanded—i.e., movements along the demand curve—are caused by a ceteris paribus change in the price of the good or service being sold. By ceteris paribus, we mean that all other factors affecting demand are held constant. Such a change in the market price can result from a shift in the supply curve or from market interventions such as price controls.
The degree to which the quantity demanded changes in response to a price change depends on the price elasticity of demand. For elastic goods and services, even a small percentage change in price can lead to a relatively large percentage change in quantity demanded. For inelastic goods, on the other hand, quantity demanded changes by a smaller percentage relative to the percentage change in price.
Factors other than the market price cause shifts in the demand curve. These other factors influence the behavior of buyers in the market and cause quantity demanded to change at every price point. When overall demand increases, the demand curve shifts out and to the right. When overall demand decreases, the demand curve shifts in and to the left.
Determinants of demand that can shift the demand curve include changes in:
Consumer tastes and preferences
Consumer incomes
The demographics of buyers
Consumer expectations about the future
The price of related goods
Two types of movements happen along a demand curve.
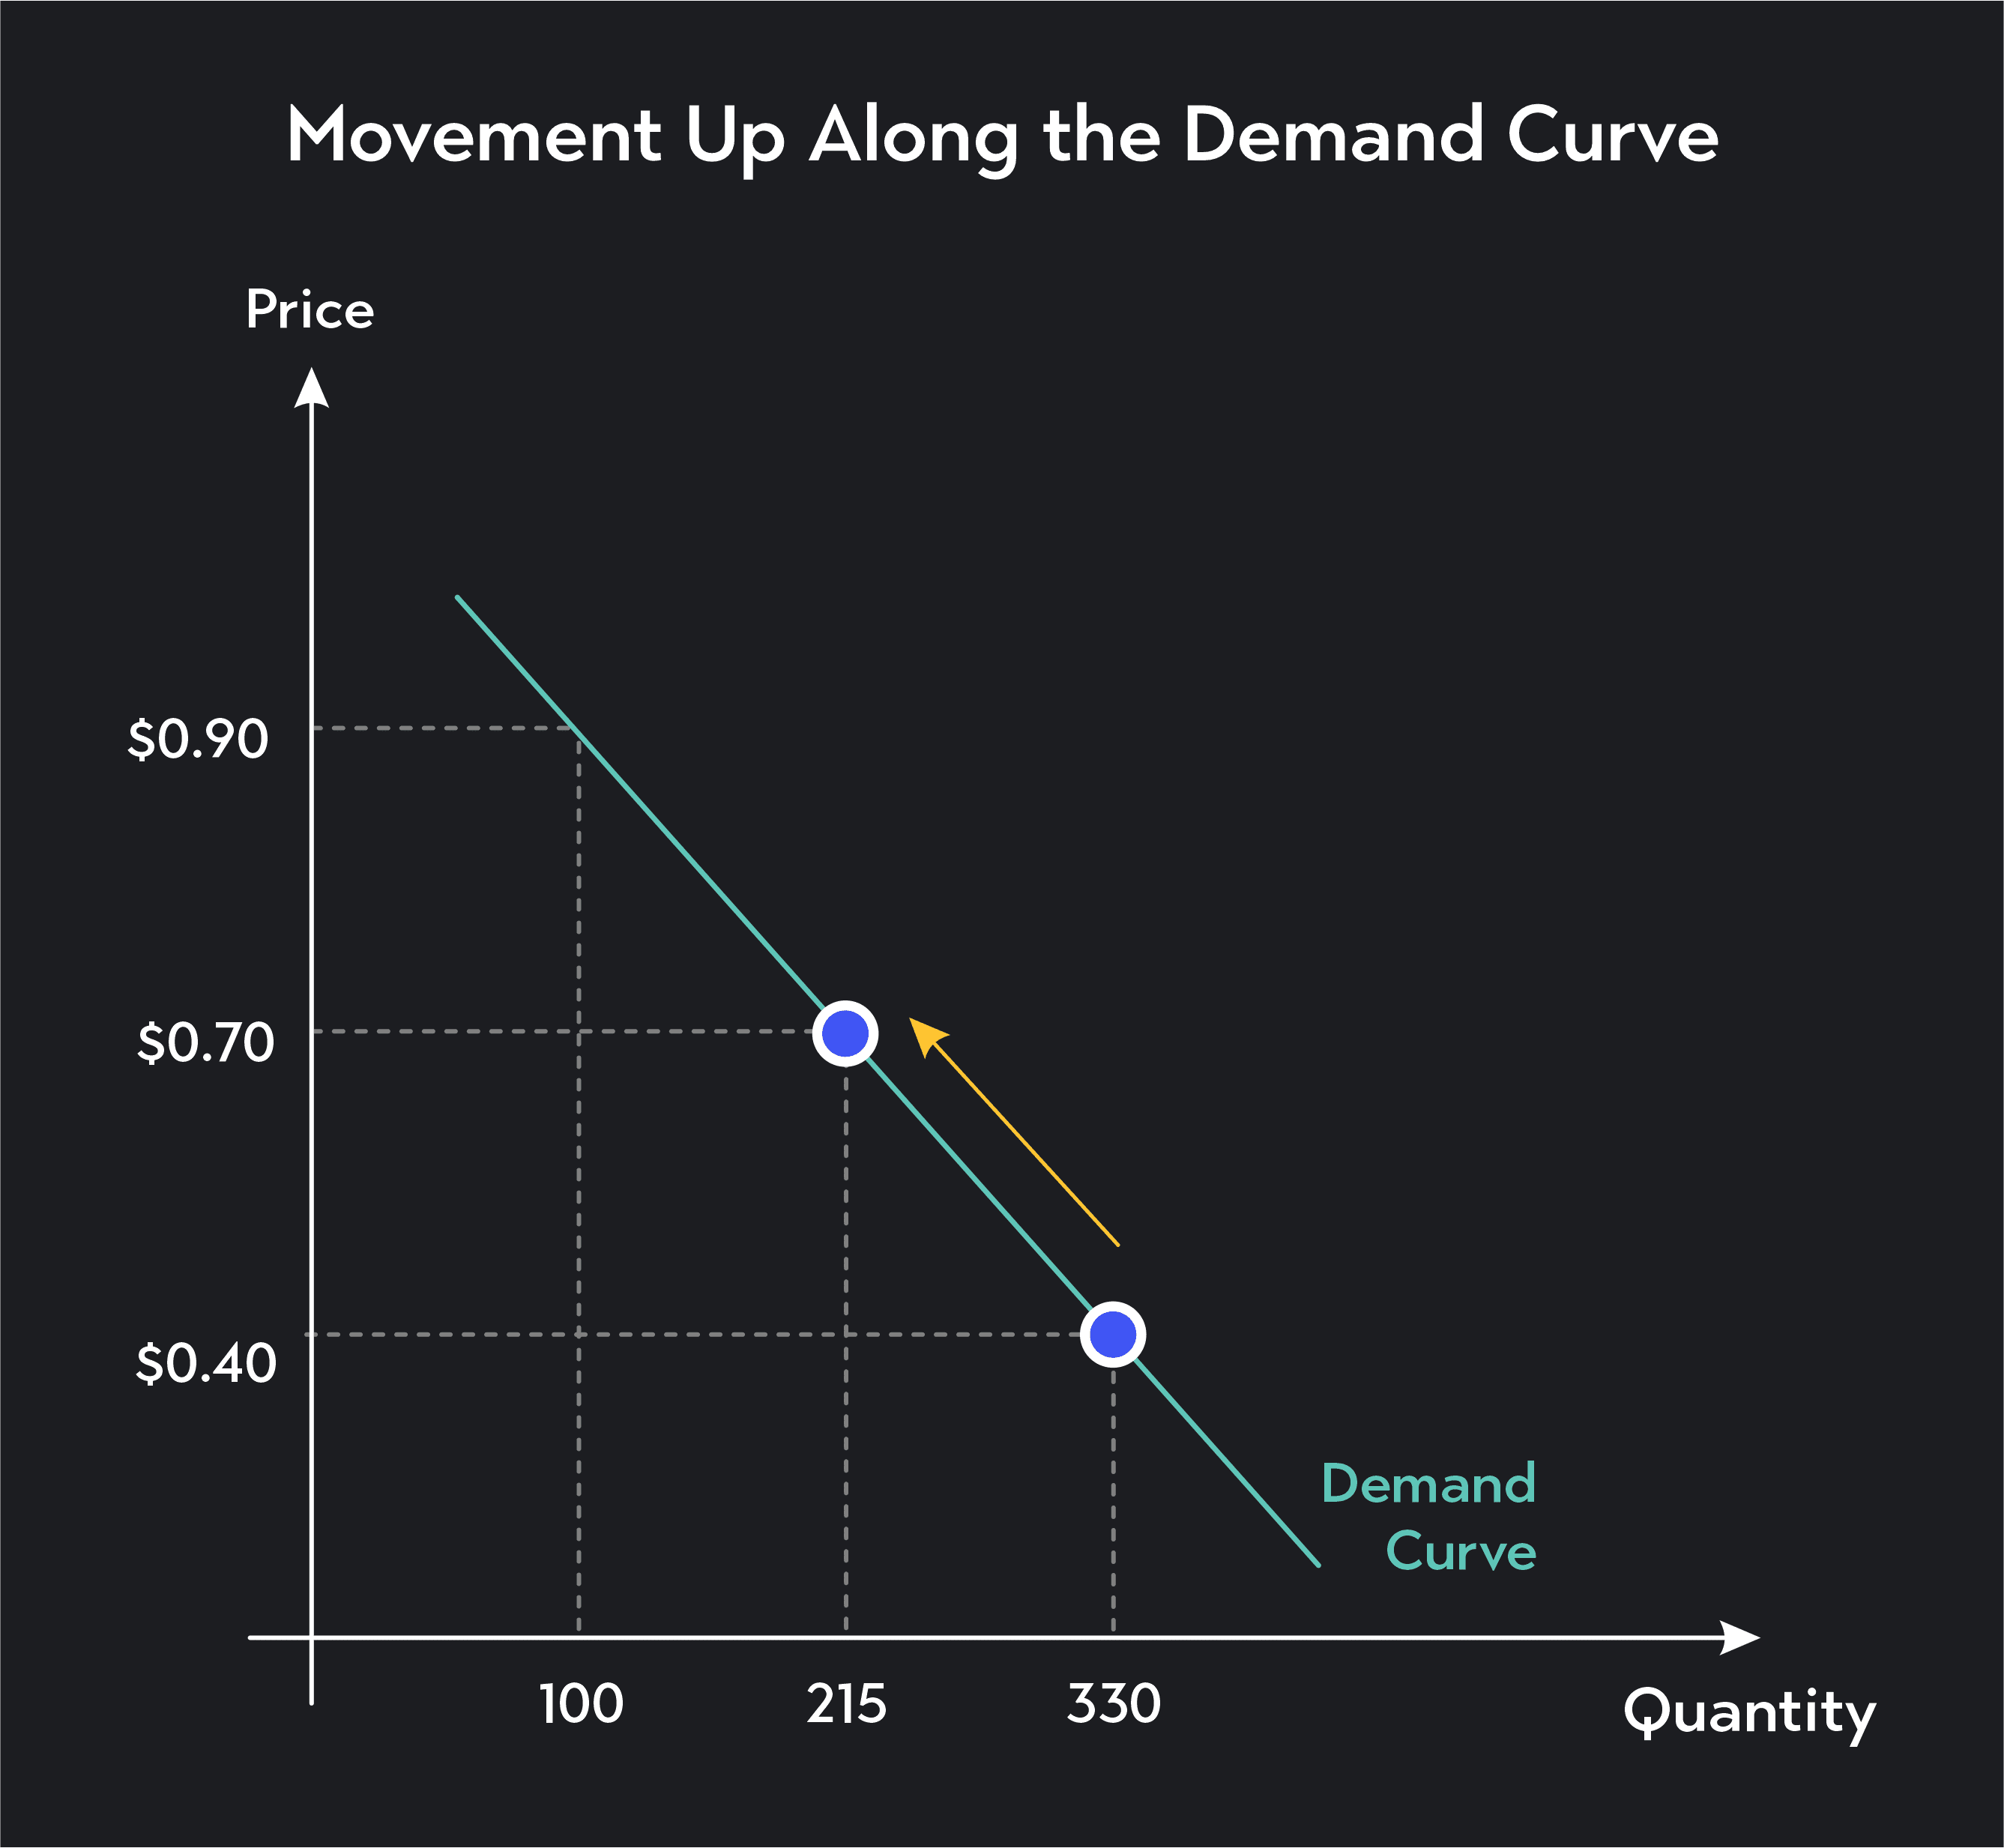
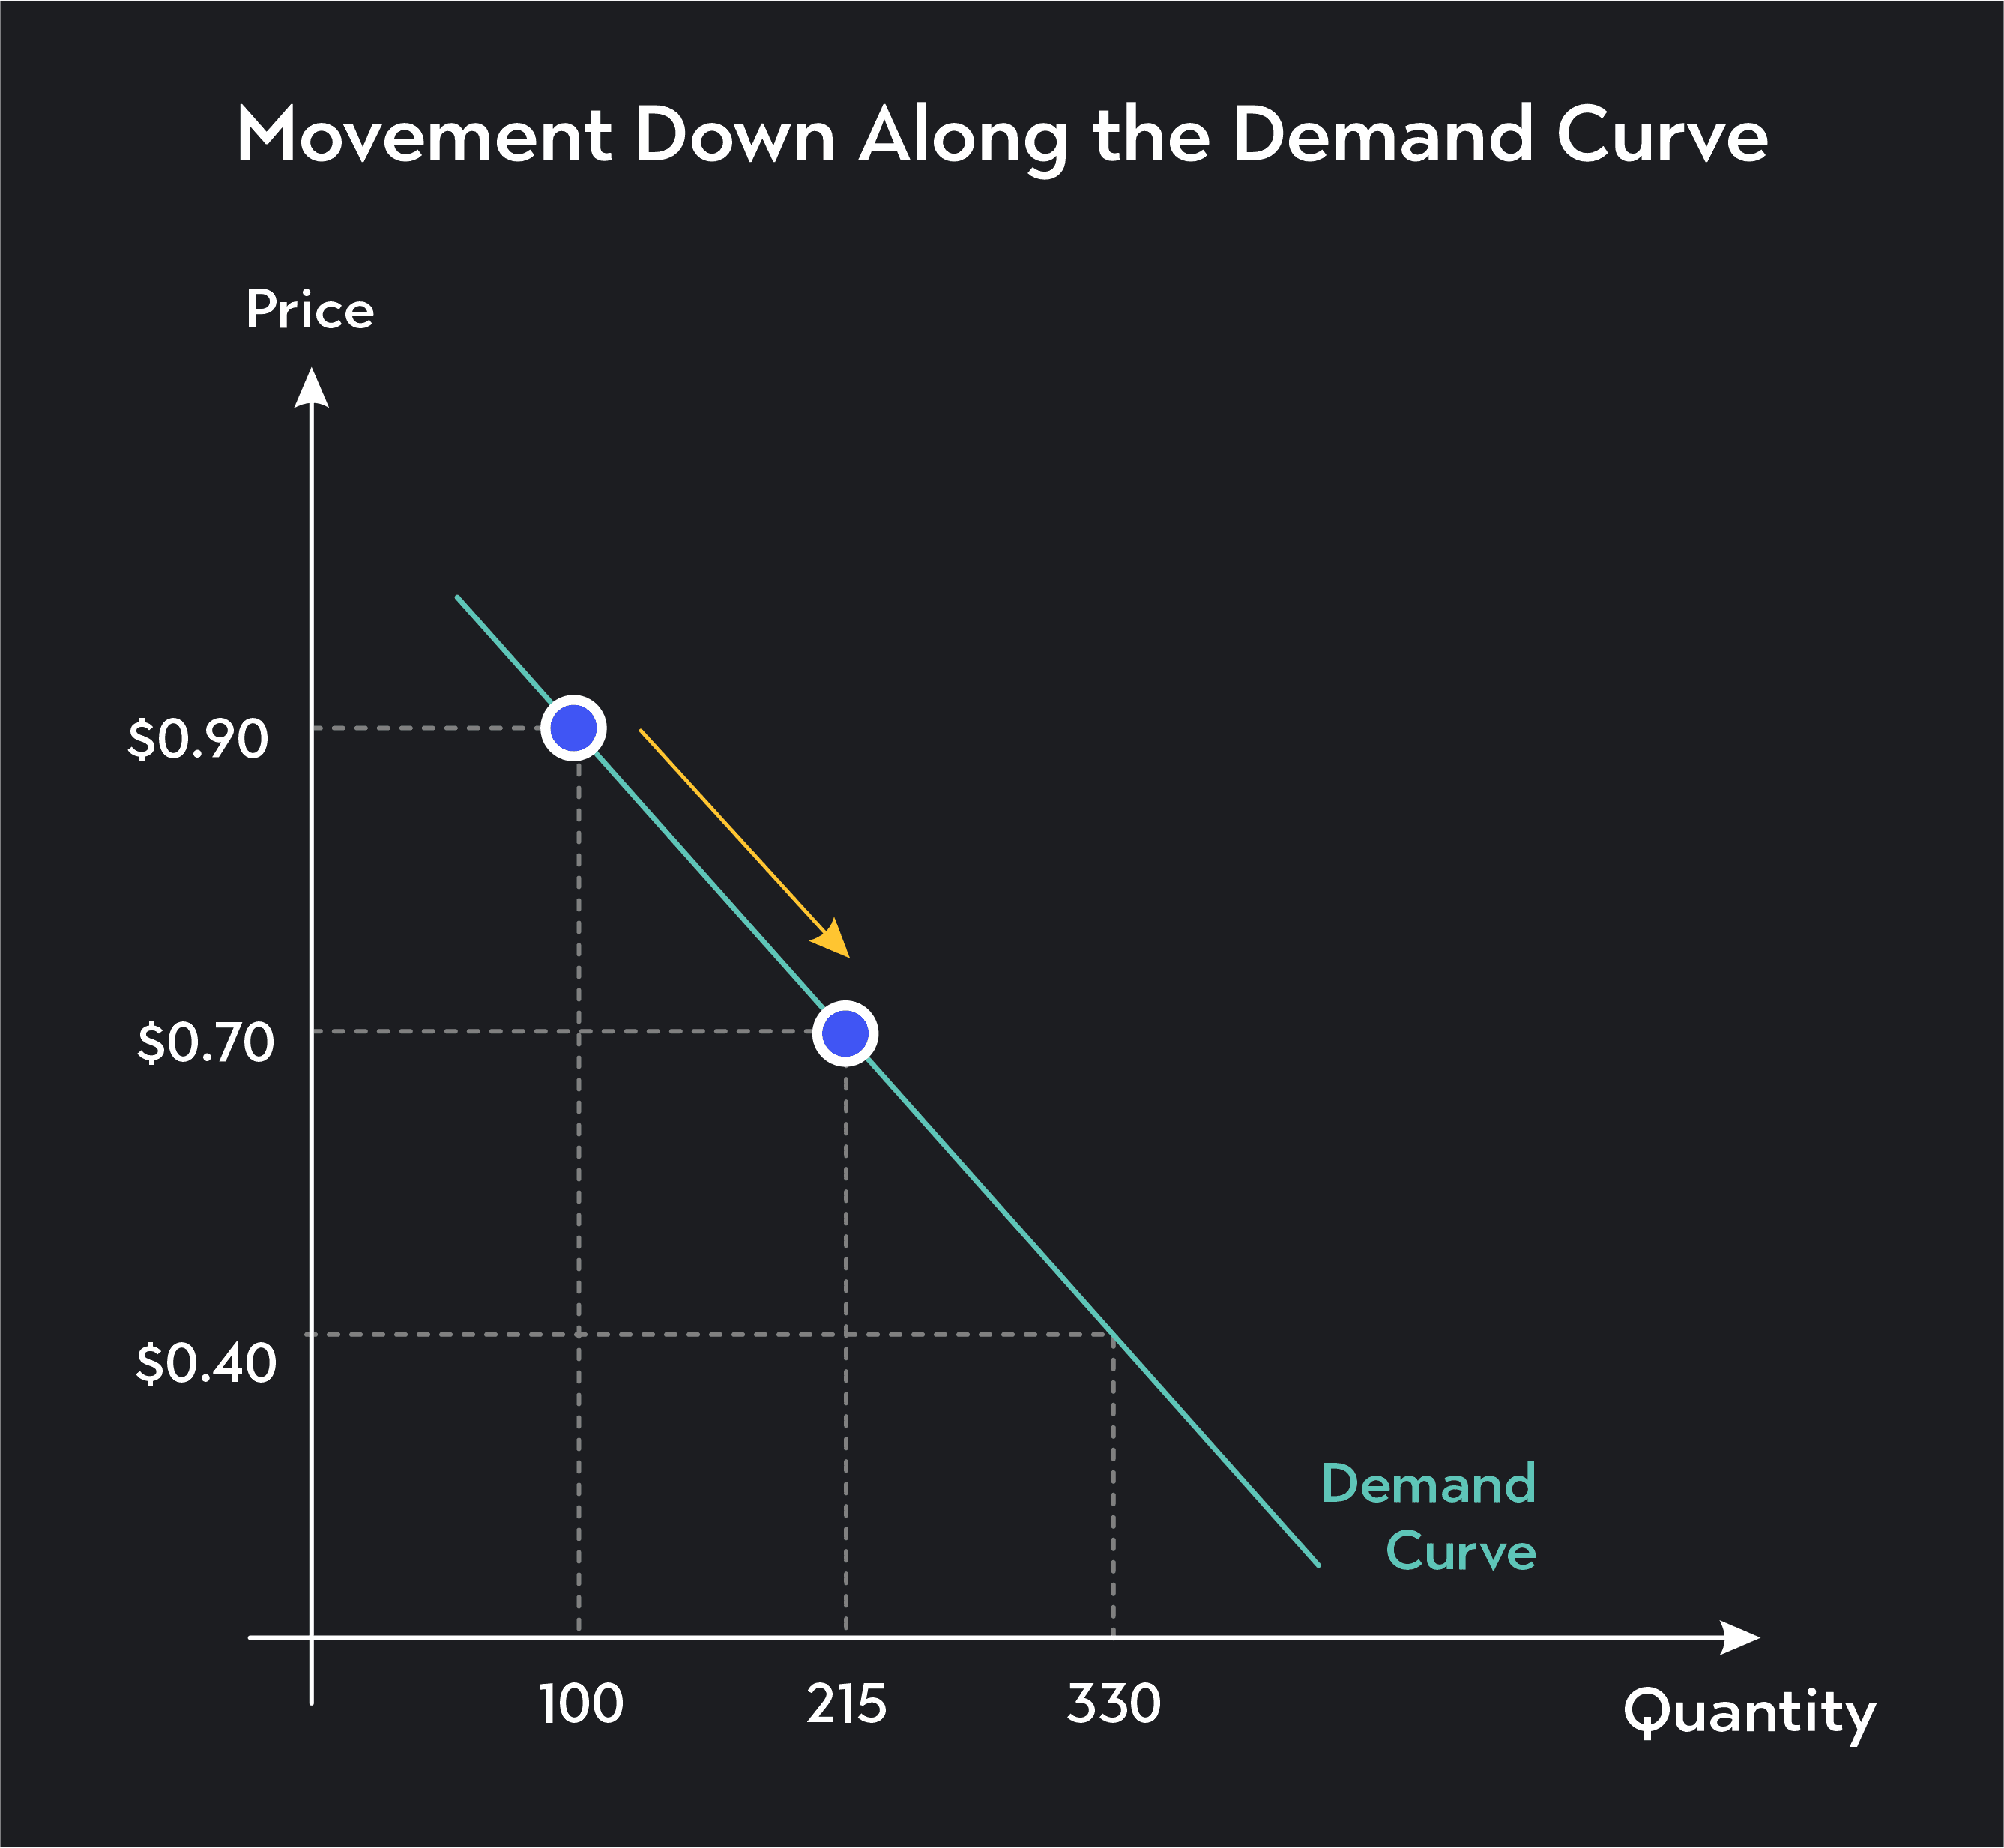
Following the law of demand, when prices rise, consumers typically respond by demanding fewer units. This results in a movement up and to the left along the demand curve. When prices decrease, consumers will react by demanding more units. This results in a movement down and to the right along the demand curve
When price falls, quantity demanded decreases.

When price decreases, quantity demanded increases.

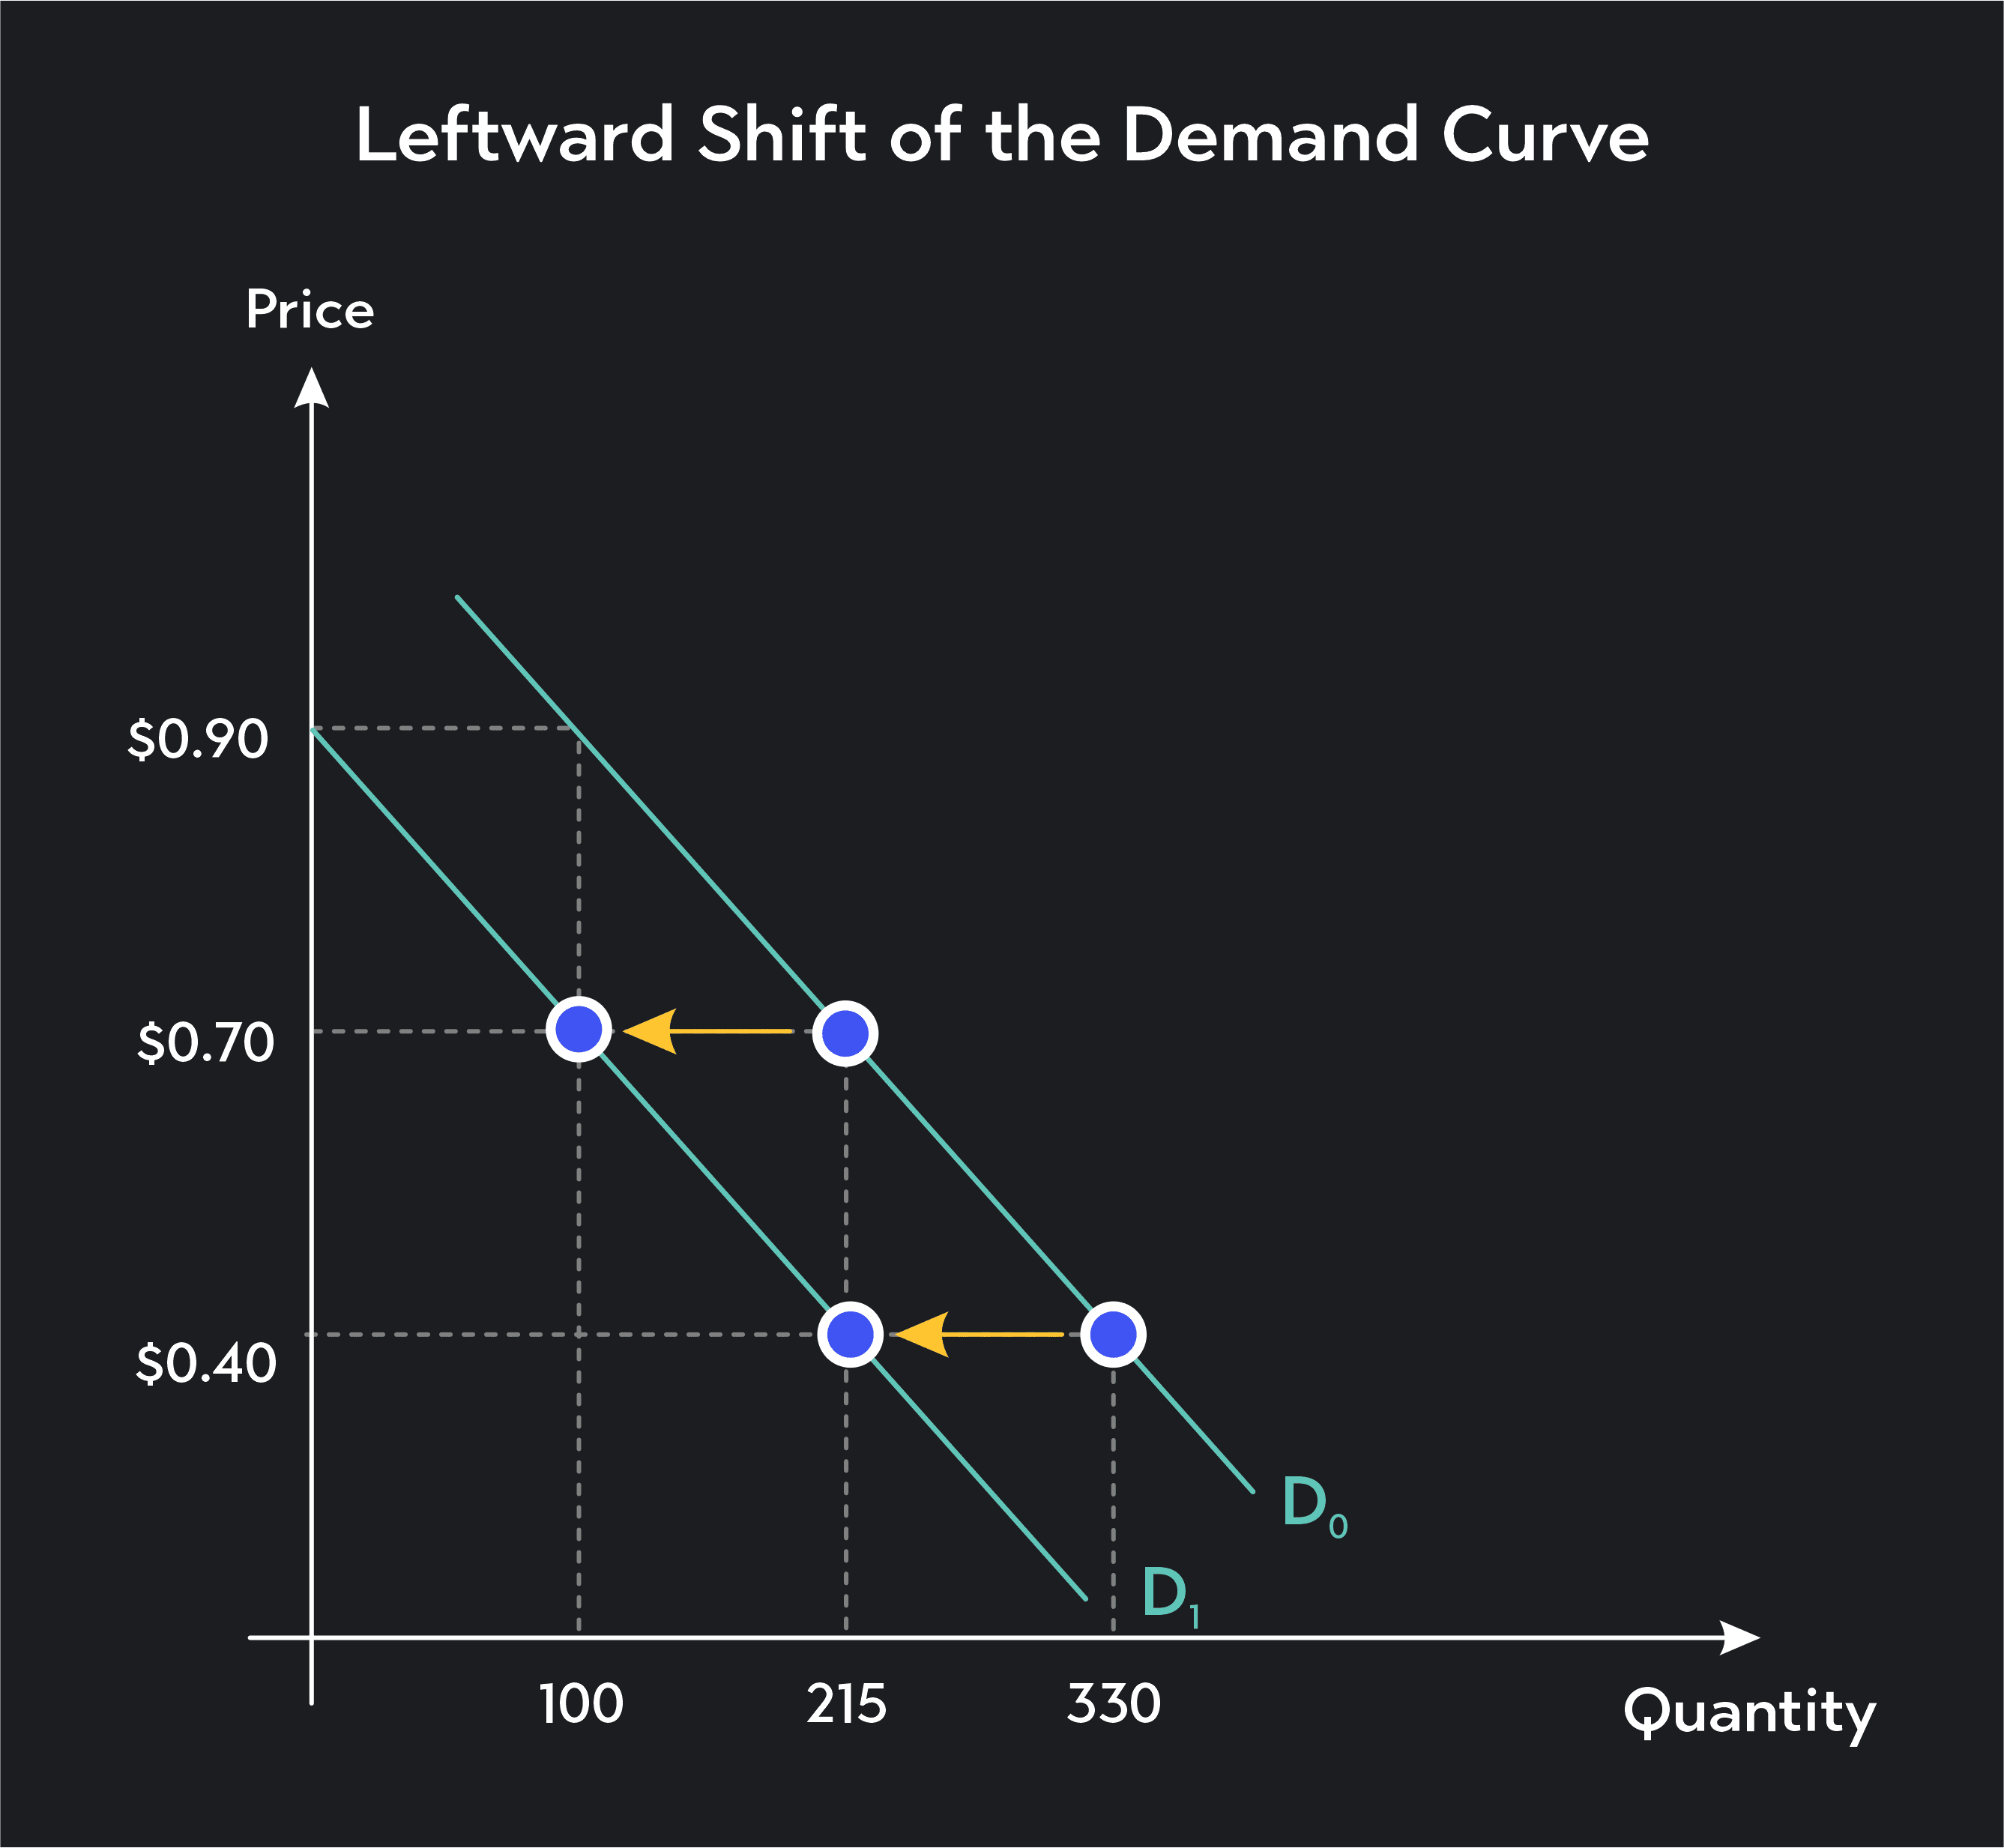
Demand curves can shift in two ways. If demand increases, the demand curve shifts to the right. If demand decreases, the demand curve shifts to the left.
A rightward shift in the demand curve signals an increase in demand. At every price, consumers are willing to buy a larger quantity of the good or service being sold. In a supply and demand model with perfect competition, if demand shifts to the right, the equilibrium price and quantity will both increase.
A demand curve can shift to the right for any of the following reasons:
Increasing popularity of the good or service being sold
Income increases (if the good being sold is a normal good)
Income decreases (if the good being sold is an inferior good)
Increases in the number of buyers in the market
An expectation that future prices will be higher
An increase in the price of substitute goods
A decrease in the price of complementary goods
A leftward shift in the demand curve signals a decrease in demand. At every price, consumers are willing to buy a smaller quantity of the good or service being sold. In a supply and demand model with perfect competition, if demand shifts to the left, the equilibrium price and quantity will both decrease.
A demand curve can shift to the left for any of the following reasons:
Decreasing popularity of the good or service being sold
Income decreases (if the good being sold is a normal good)
Income increases (if the good being sold is an inferior good)
Decreases in the number of buyers in the market
An expectation that future prices will be lower
A decrease in the price of substitute goods
An increase in the price of complementary goods

The key difference between a movement and a shift in demand is that a movement along a demand curve occurs when a ceteris paribus change occurs in price.
The change in price causes a change in the quantity demanded. Shifts in demand occur when something other than the price of the product changes the behavior of buyers more generally. When demand changes, the entire demand curve shifts to the right or to the left.
Outlier (from the co-founder of MasterClass) has brought together some of the world's best instructors, game designers, and filmmakers to create the future of online college.
Check out these related courses:

Economics
Learn what the demand curve is, how to calculate it, how it works, and the different types. Plus learn what causes it to shift and movements along it.
Subject Matter Expert

Economics
Learn about what a supply curve is, how a supply curve works, examples, and a quick overview of the law of demand and supply.
Subject Matter Expert

Economics
Learn about quantity demanded, its relationship with price, and what happens when there’s a shift in the quantity demand, and price elasticity of demand.
Subject Matter Expert