
Economics
Main Difference Between Demand & Quantity Demanded
Find out the difference between demand and quantity demanded. Plus learn how the quantity demanded affects society in everyday life and the economy.
Sarah Thomas
Subject Matter Expert

Economics
04.05.2023 • 5 min read
Subject Matter Expert
Learn what a decrease in quantity demanded is and what concepts you should know to understand it. Also read about a decrease in demand and how it’s different.
In This Article
Suppose your local movie theater charges $15 per ticket. If the theater suddenly increased ticket prices to $25, what would you expect to happen?
Would moviegoers buy more tickets or fewer tickets? When prices in a market increase, buyers typically respond by lowering the quantity they are willing to purchase. This is called a decrease in quantity demanded.
In this article, we’ll explore changes in the quantity demanded. We’ll also explain the difference between a decrease in quantity demanded and a decrease in overall demand.
Quantity demanded is the quantity of a particular good or service buyers are willing to buy at a given price. For example, if, at a price of $4 per gallon, consumers are willing to buy 500 gallons of milk, we say the quantity demanded is 500 gallons at a price of $4.00.
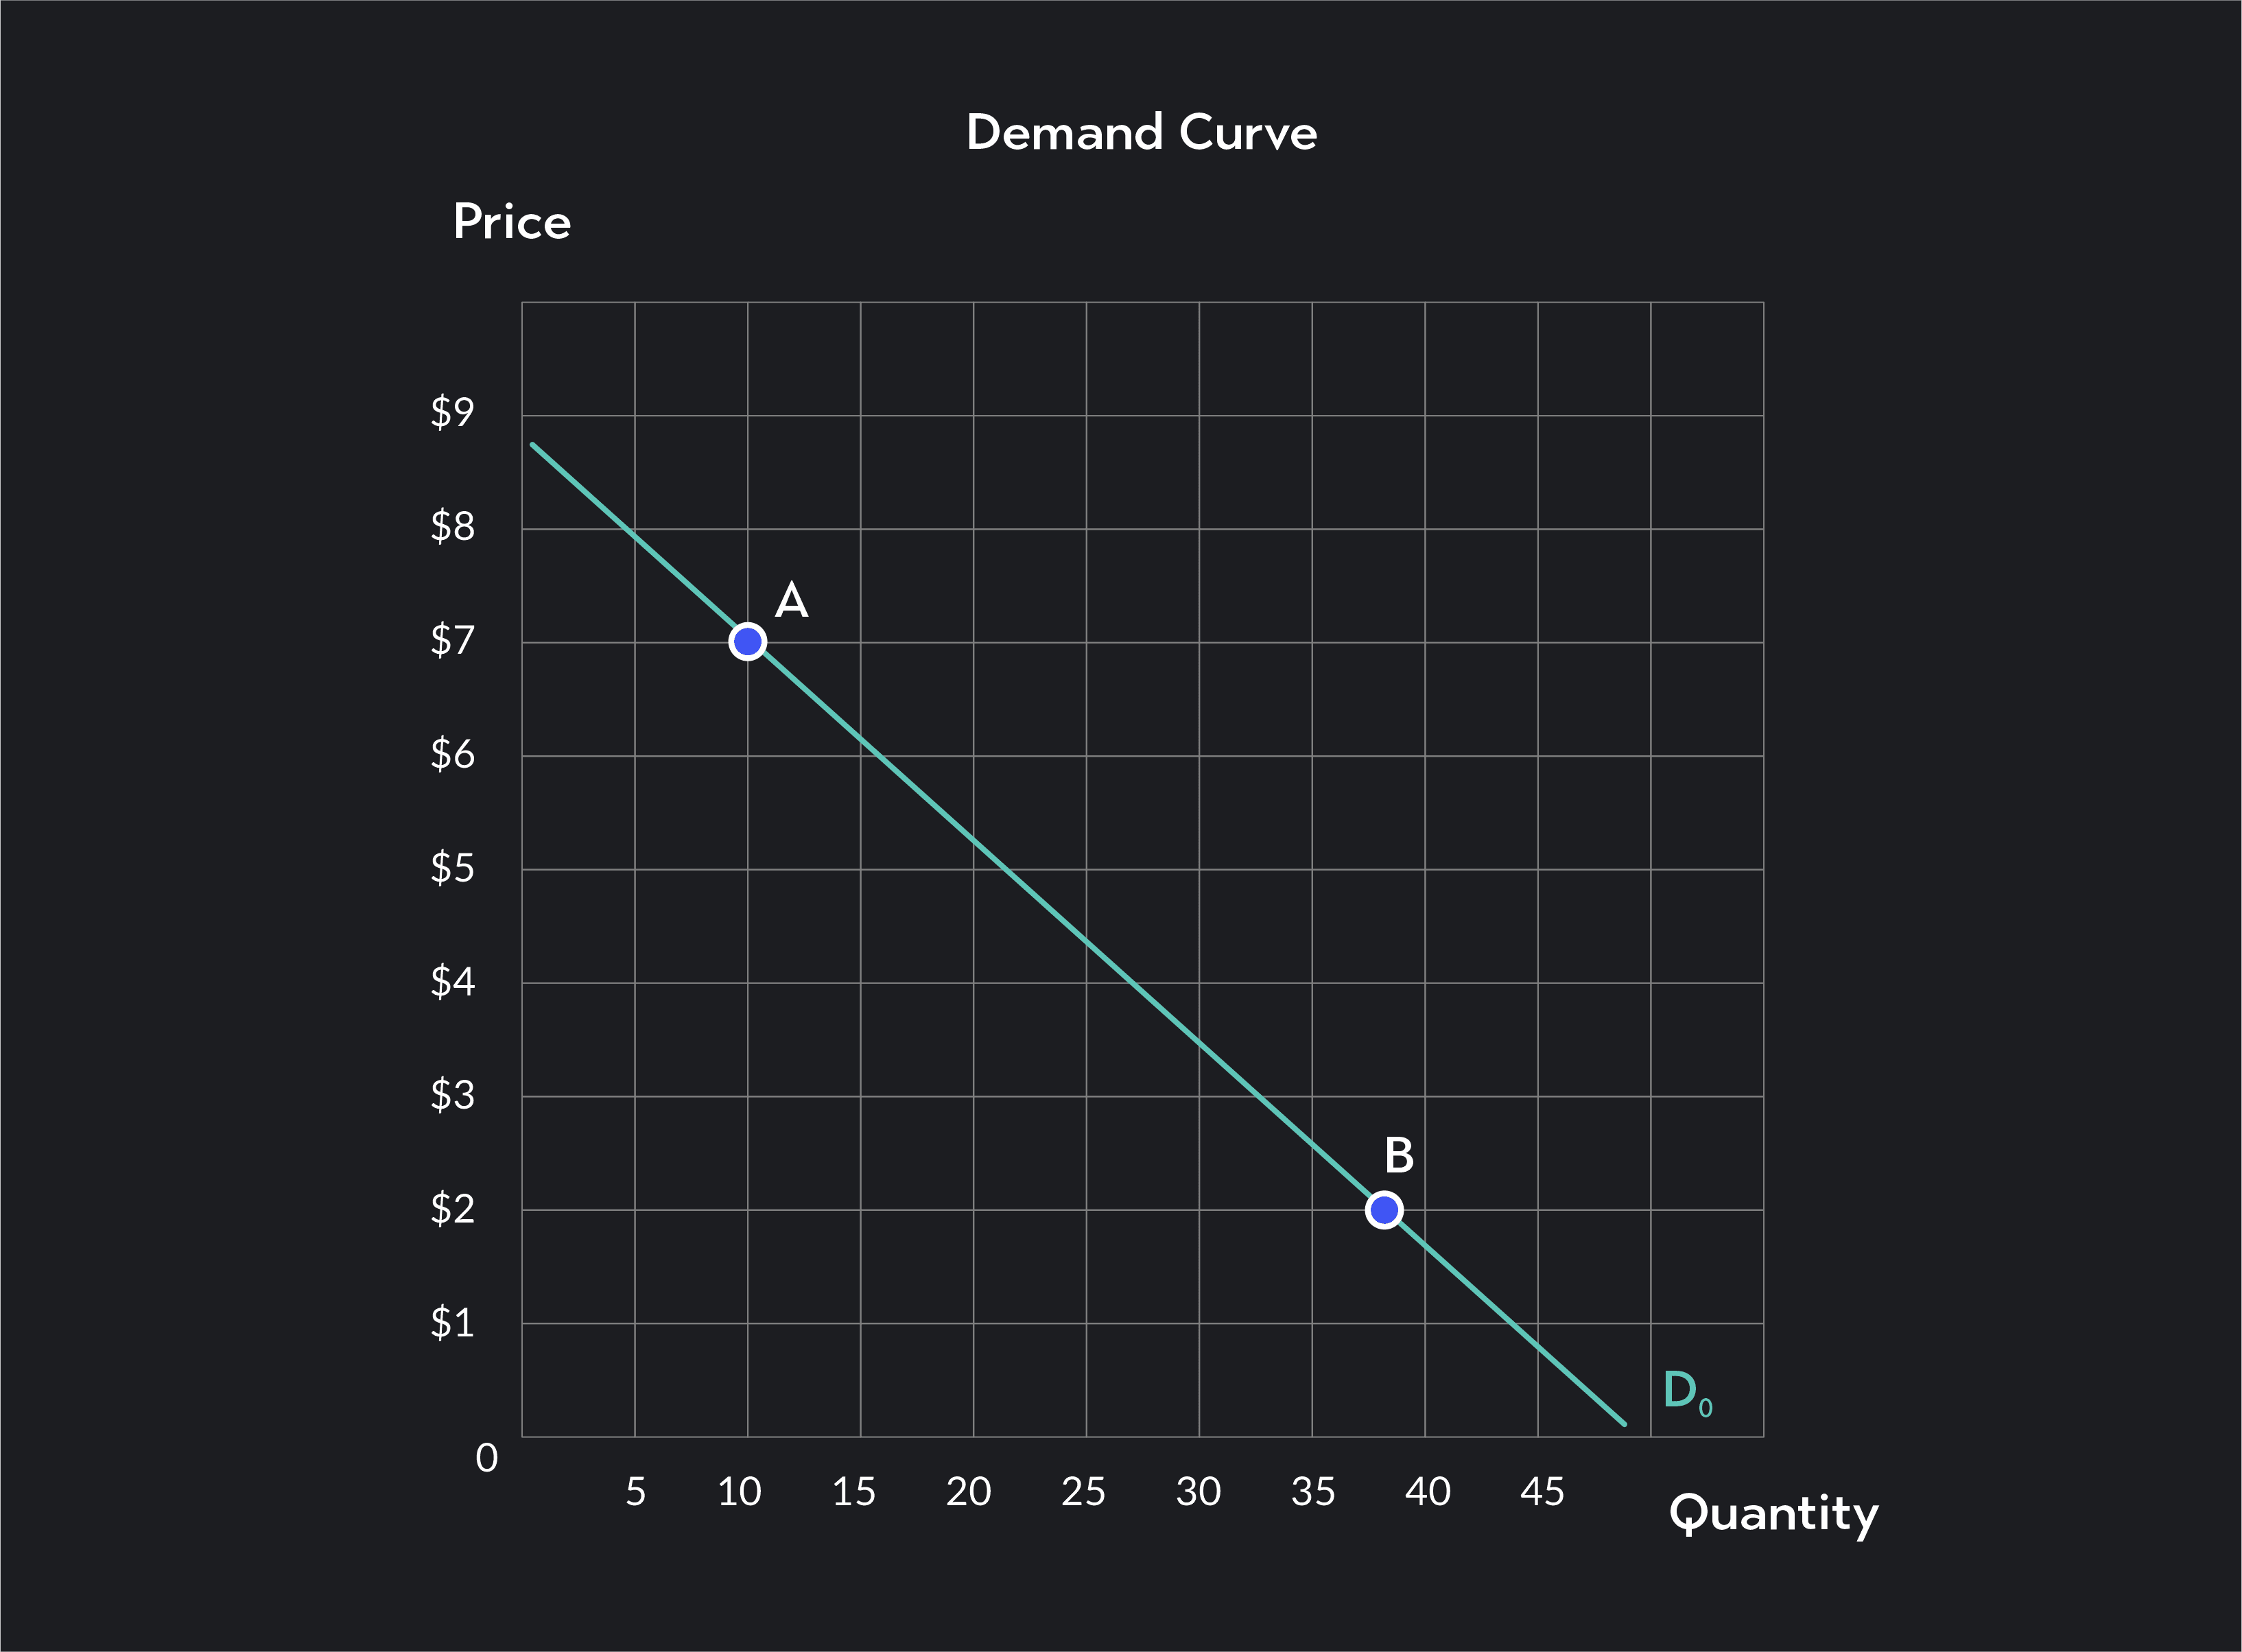
On a demand graph—a graph with prices plotted along the vertical axis and quantities plotted along the horizontal axis—the quantity demanded is the quantity associated with a particular point along the demand curve.
In the demand curve below, quantity demanded is 10 units at Point A. At a lower price, say $2, quantity demanded is 37 units, and so on.
On a demand schedule—a table showing consumer demand—quantity demanded is a particular value in the quantity column of the table.
In the demand schedule below, quantity demanded is 0 at a price of $9; 10 units at a price of $7, and so on.

To deepen your understanding of quantity demanded, it’s helpful to understand the following concepts:
The law of demand describes the relationship between price and quantity demanded. For most goods and services, there is an inverse relationship between price and quantity. This means all other things being equal, quantity and price move in opposite directions. When the price rises, quantity demanded decreases, and when the price falls, quantity increases.
You can visualize demand with a downward-sloping demand curve. A demand curve is a graph that shows the relationship between price and quantity demanded.
You can draw a demand curve by plotting prices along the vertical y-axis and quantities along the horizontal x-axis. Demand curves can be linear (straight) or curved. But if the law of demand holds, the demand curve will always slope downward from left to right and have a negative slope.
While they may sound similar, quantity demanded is not the same as demand more generally. Demand describes the overall relationship between prices and the various quantities consumers demand at those prices. In other words, demand refers to the entire demand curve.
Quantity demanded, on the other hand, is a term economists use to refer to a single quantity associated with a particular price.
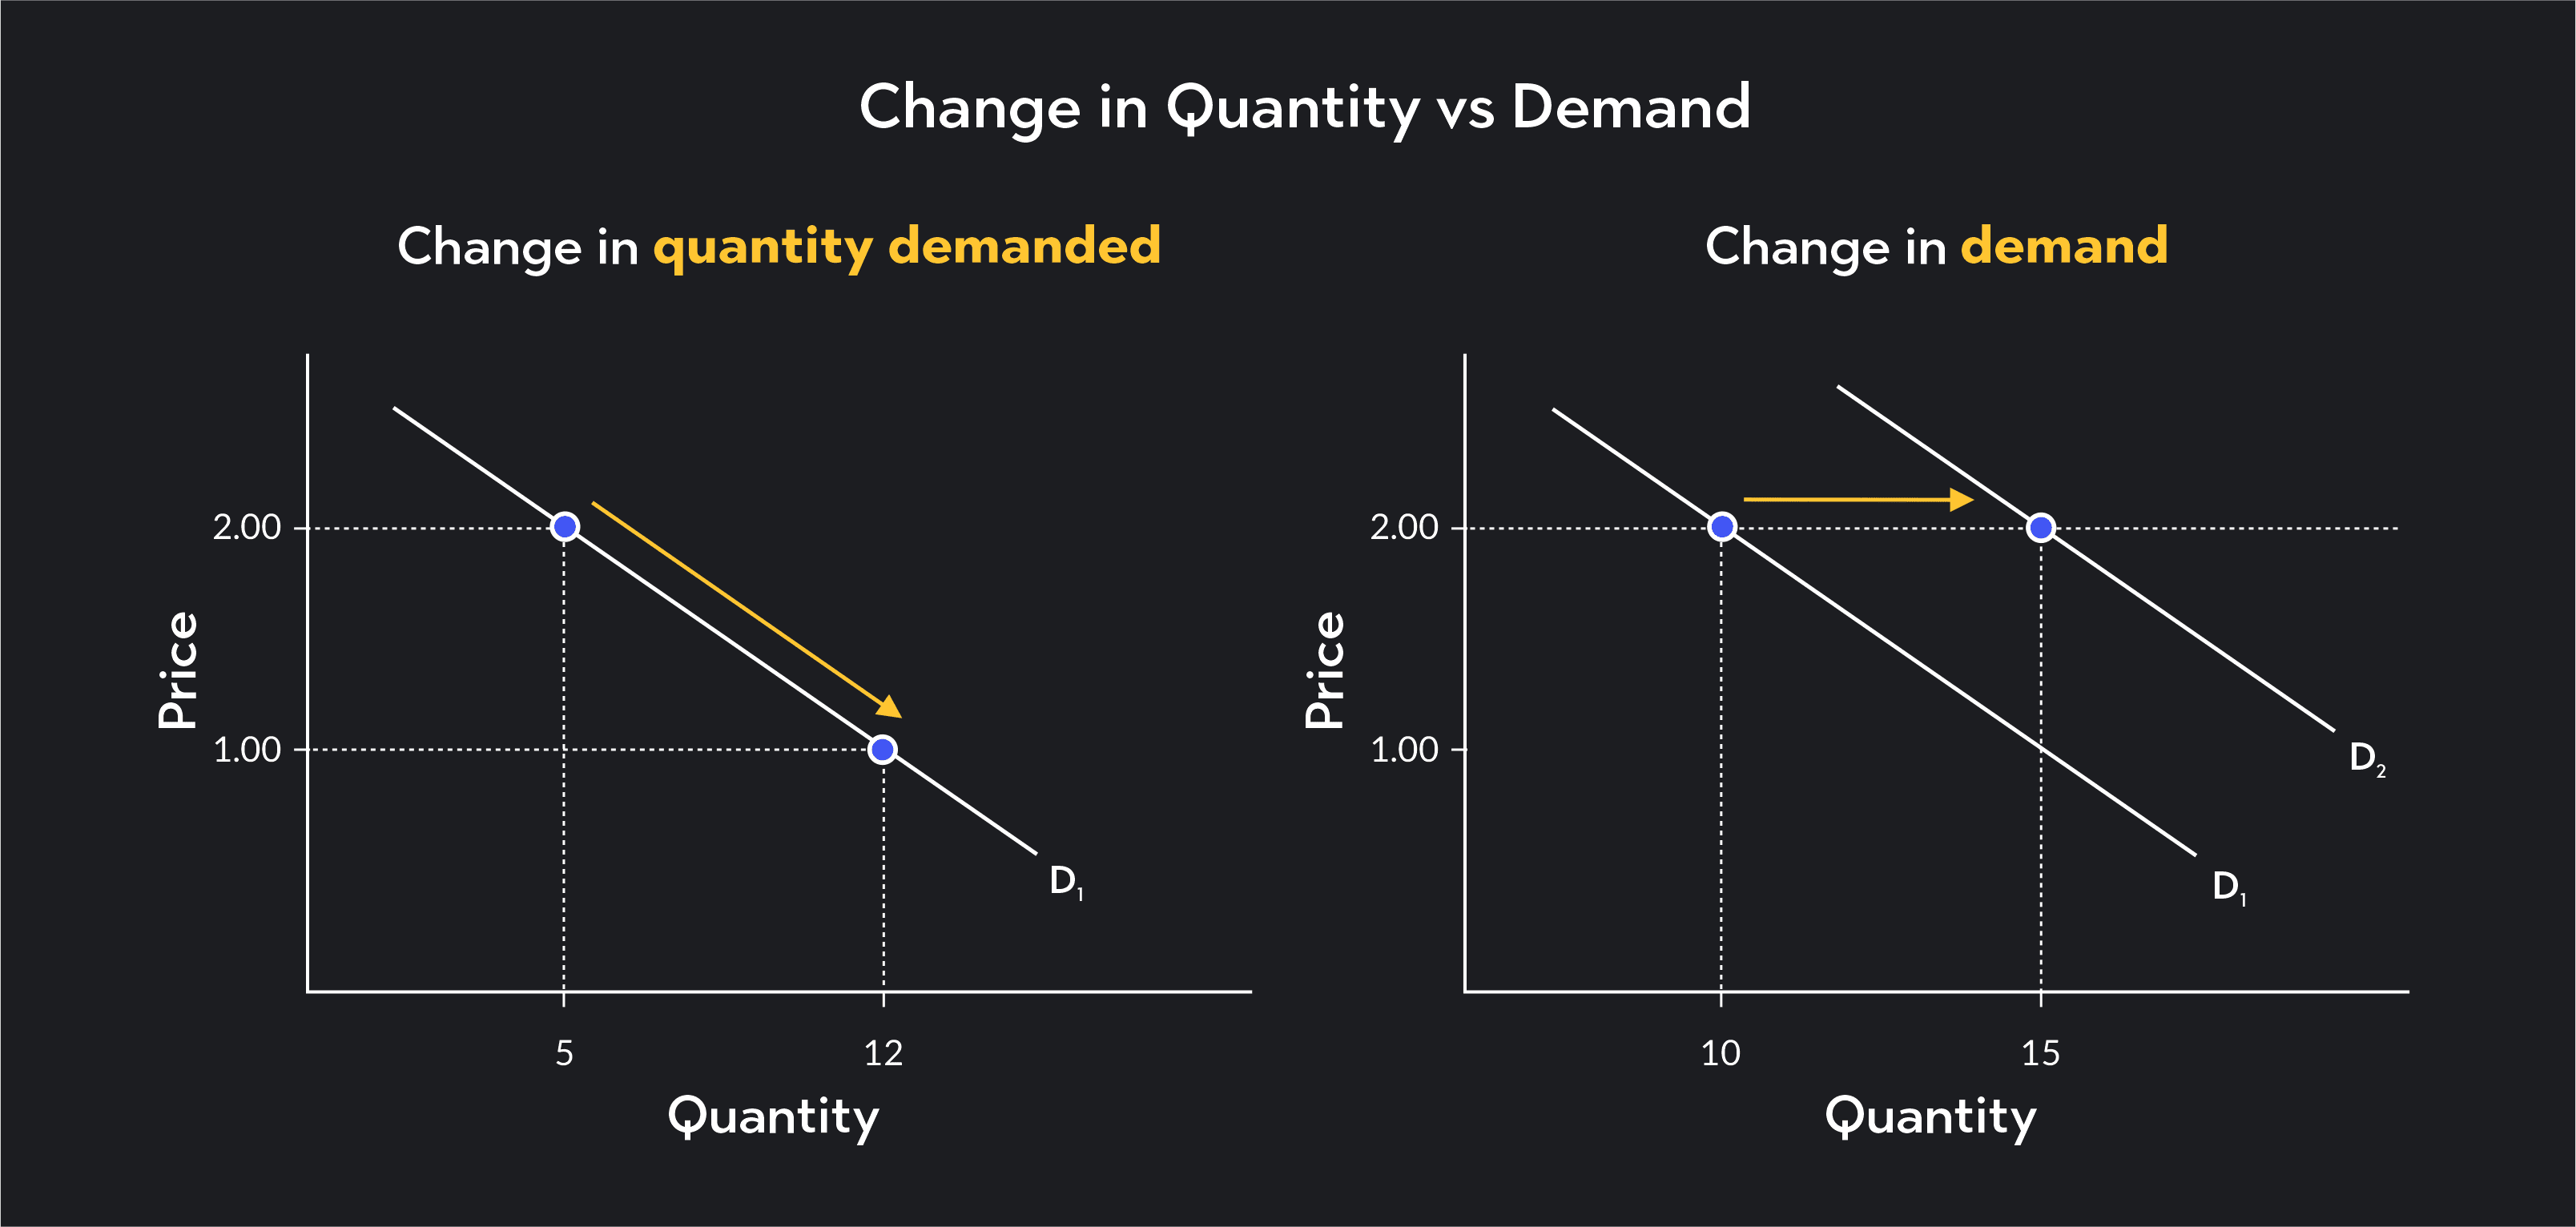
A change in quantity demanded is also distinct from a change in demand. Graphically, a change in quantity demanded refers to a movement up or down along the demand curve. This type of movement is caused by ceteris paribus price changes. When the market price decreases, quantity demanded increases and vice versa.
A change in demand, however, refers to a shift in the entire demand curve. When demand increases, the demand curve shifts to the right, and when demand decreases, the demand curve shifts to the left.
While changes in quantity demanded are caused by a change in price, changes in demand are caused by a change in consumer behavior.
The main causes that shift demand are:
Changes in consumer preferences
Changes in consumer budgets
Changes in the price of related goods and services
Demographic changes
Changing expectations about the future
As we mentioned above, a decrease in quantity demanded is not the same thing as a decrease in demand more generally.
A decrease in quantity demanded refers to when consumers buy less of a product or service due to a price change, with other factors constant. This is a part of the law of demand: as the price of a good or service goes up, the quantity demanded goes down. This is true, even if other factors stay the same. We can represent this graphically as a leftward movement along a fixed demand curve.
If nothing else about consumer behavior is changing and the market price increases, consumers usually respond by decreasing the quantity they demand. The extent to which quantity demanded will decrease depends on the price elasticity of demand, which is a measure of how responsive quantity demanded is to changes in price.
For elastic goods, quantity demanded will change by a proportionally greater amount relative to the change in price. For inelastic goods, quantity demanded will change by a proportionally smaller amount relative to the change in price.
A decrease in demand, on the other hand, refers to an overall change in consumer behavior that causes the entire demand curve to shift to the left. This means that at every single price, consumers will now demand fewer units.
A decrease in demand can result from any of the following changes:
Buyer preferences shifting away from the good or service being sold (i.e., the product becoming less popular)
An increase in the price of a complement good
A decrease in the price of substitute good
A decrease in the population of buyers
A negative shock to consumer incomes (if the good being sold is a normal good)
A positive shock to consumer incomes (if the good being sold is an inferior good)
A change in consumer expectations which make buyers more weary about buying.
When demand decreases and the demand curve shifts to the left, the market equilibrium will change as well. Recall that in a supply and demand model of a competitive market, the equilibrium occurs at the intersection of the demand and supply curves. When the demand curve shifts to the left, this intersection moves down and to the left.
The new equilibrium occurs at a lower equilibrium price and a lower equilibrium quantity. Consequently, the quantity supplied by producers falls, and there is a movement along the supply curve.
As an example of how demand and quantity demanded can decrease, consider the housing market.
If the price rises in the housing market—but nothing else about consumer behavior changes—the demand side of the market responds to the higher price by decreasing the number of houses they are willing to buy. Visually, on a demand curve, we would see a movement up and to the left along the demand curve. Price increases and quantity demanded will decrease.
If, on the other hand, housing becomes less attractive to buyers, the entire demand curve for housing would shift to the left—demand for housing would decrease.
This type of change could occur because:
A substitute like rental properties becomes cheaper
Complementary goods such as home renovation and upkeep costs become pricier
The economy falls into a recession and homeowners take a hit to their income or housing budget
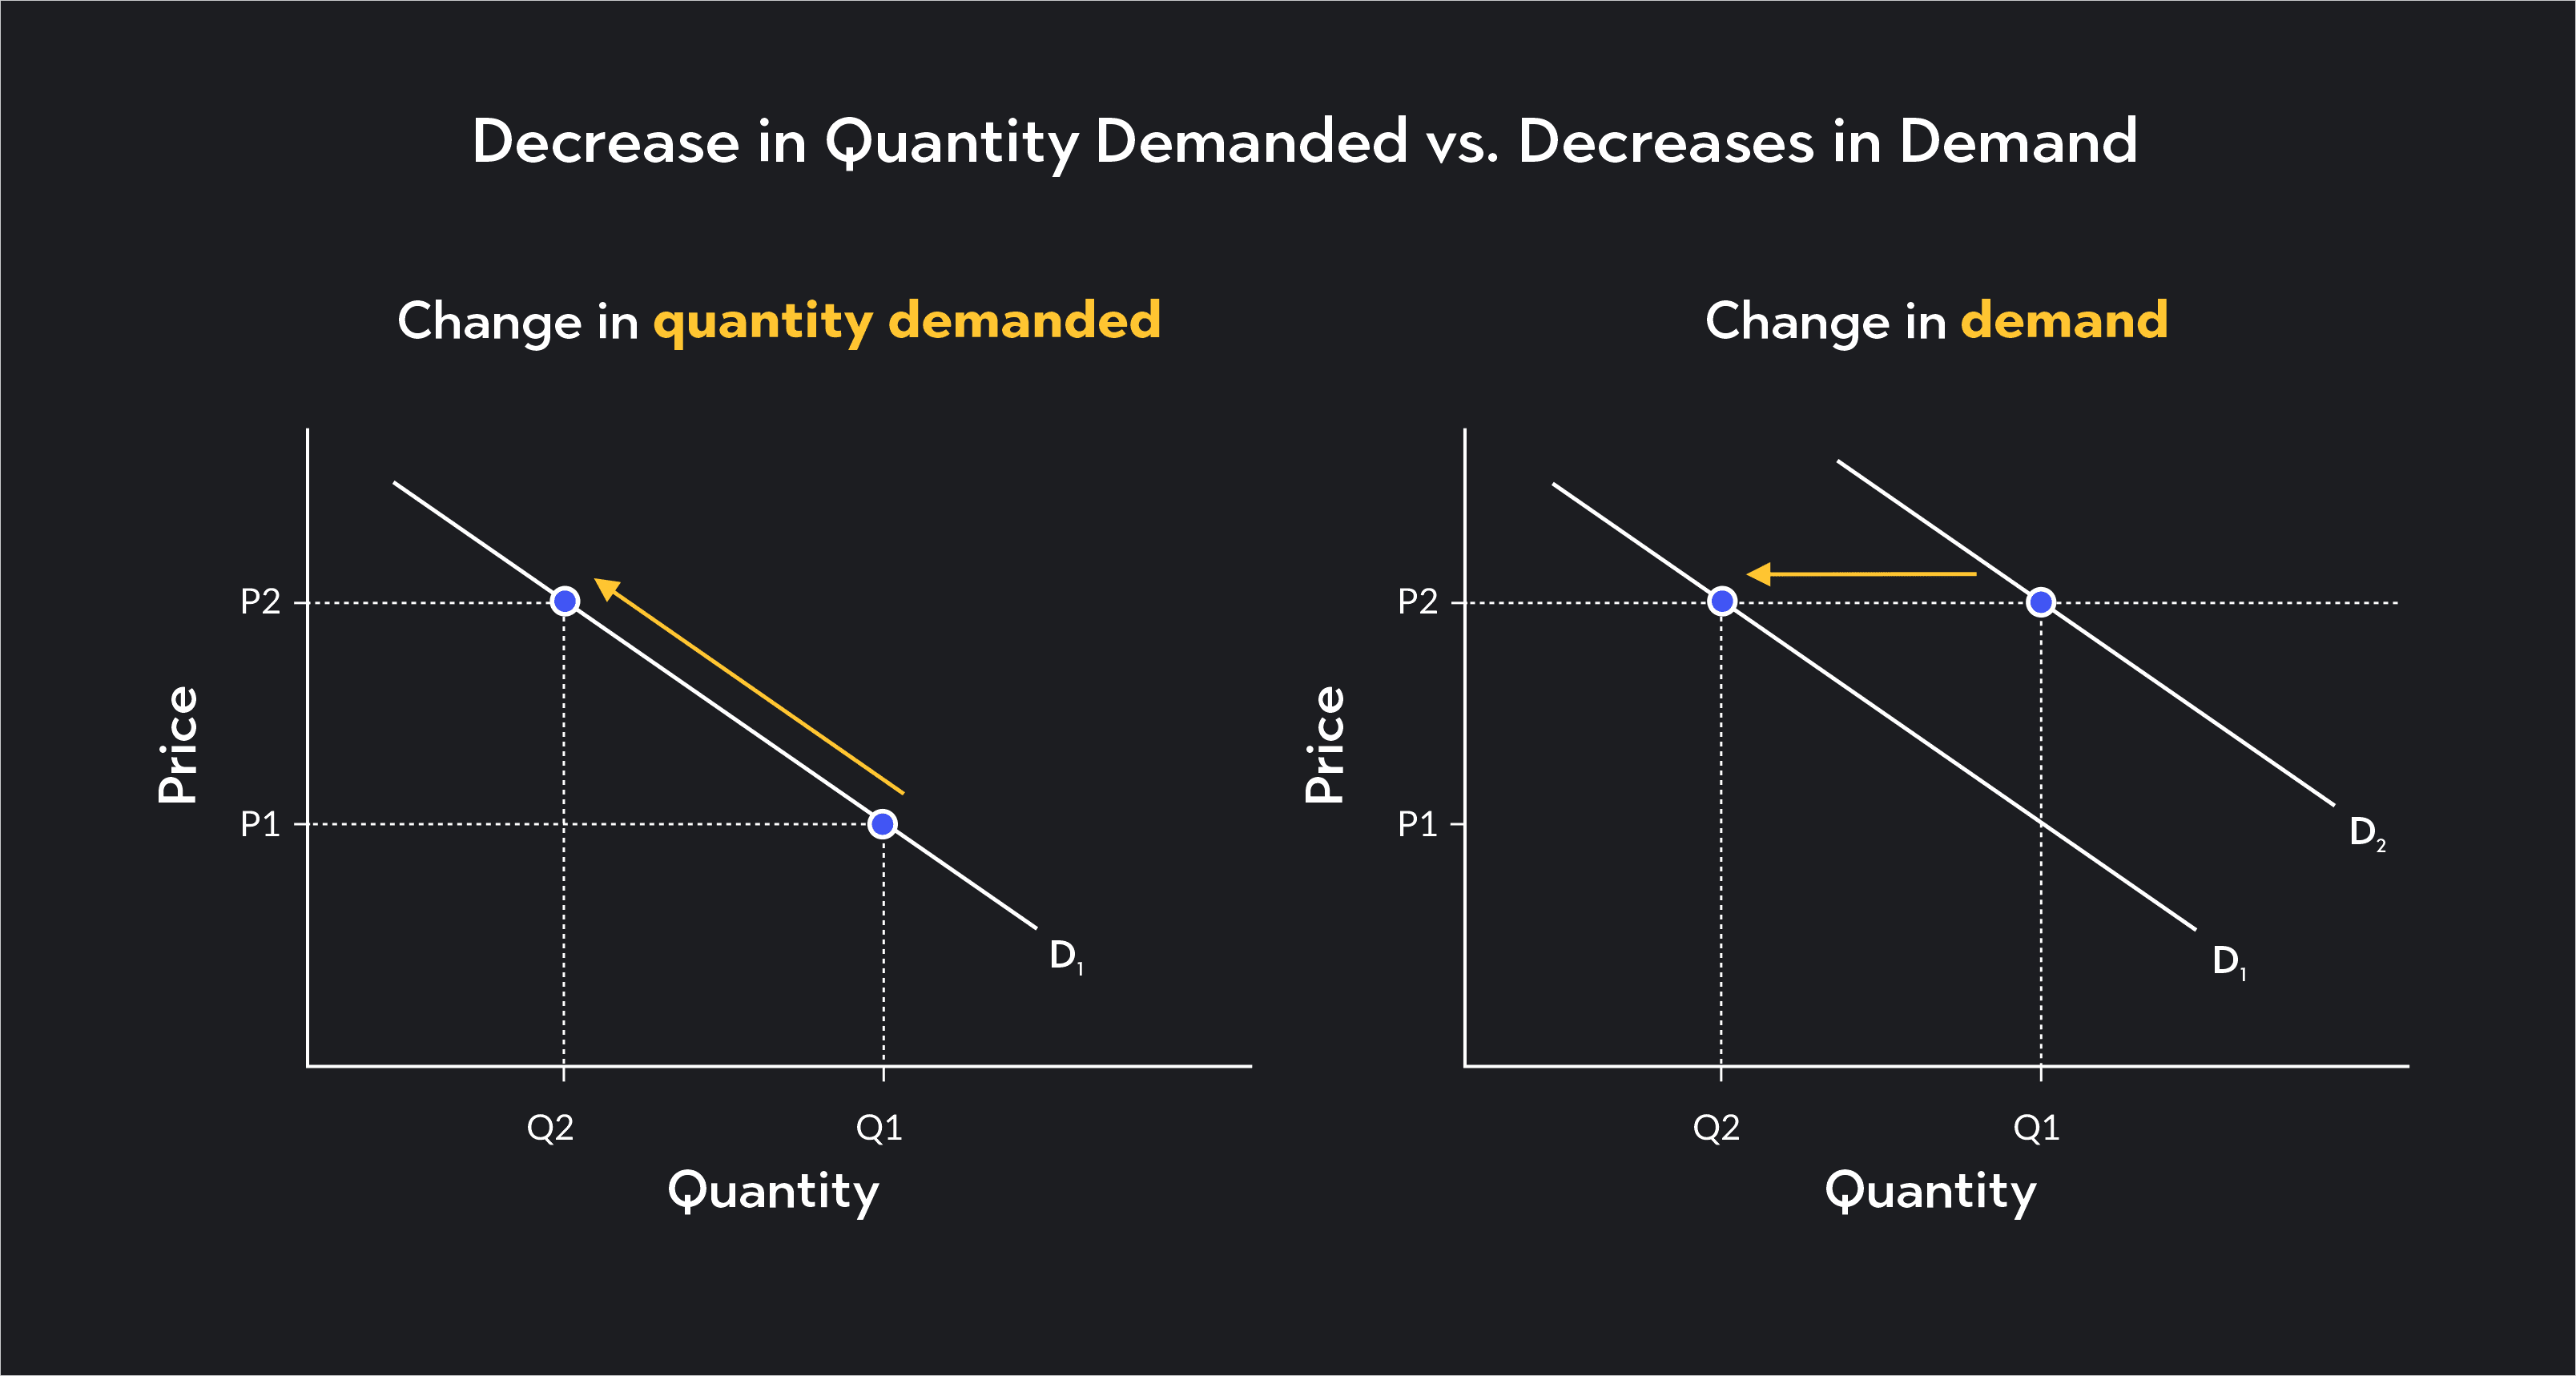
So movement and shifts of the demand curve work differently. A decrease in quantity demanded leads to a leftward movement along a fixed demand curve, while a decrease in demand, shifts the entire demand curve to the left!
Outlier (from the co-founder of MasterClass) has brought together some of the world's best instructors, game designers, and filmmakers to create the future of online college.
Check out these related courses:


Economics
Find out the difference between demand and quantity demanded. Plus learn how the quantity demanded affects society in everyday life and the economy.
Subject Matter Expert

Economics
Learn about price elasticity of demand, the five categories of price elasticities, formulas and examples, and the demand curve.
Subject Matter Expert

Economics
This article is a comprehensive guide on the causes for a demand curve to change. Included are five common demand shifter examples.
Subject Matter Expert