In This Article
What Is Perfect Competition?
What Is Profit Maximization?
Profit Maximization in Perfect Competition
A Perfectly Competitive Firm’s Profit Maximizing Decision
How To Determine the Profit Maximizing Level of Output?
Firms in perfect competition have one key decision to make: choosing a profit-maximizing output level. In this article, you’ll learn how economists model this decision.
What Is Perfect Competition?
Perfect competition is the first market structure model you’ll learn in economics. Economists use perfect competition to model highly competitive markets, where many sellers compete to sell the same good in a market with many buyers.
Assumptions
Perfect competition rests on five key assumptions:
Many buyers and sellers are present
Everybody is a price-taker; nobody has market power
The product being bought and sold is identical from one item to the next
No barriers to entry and exit are present
Buyers and sellers have perfect information about the product being sold
Finding Equilibrium in Perfect Competition
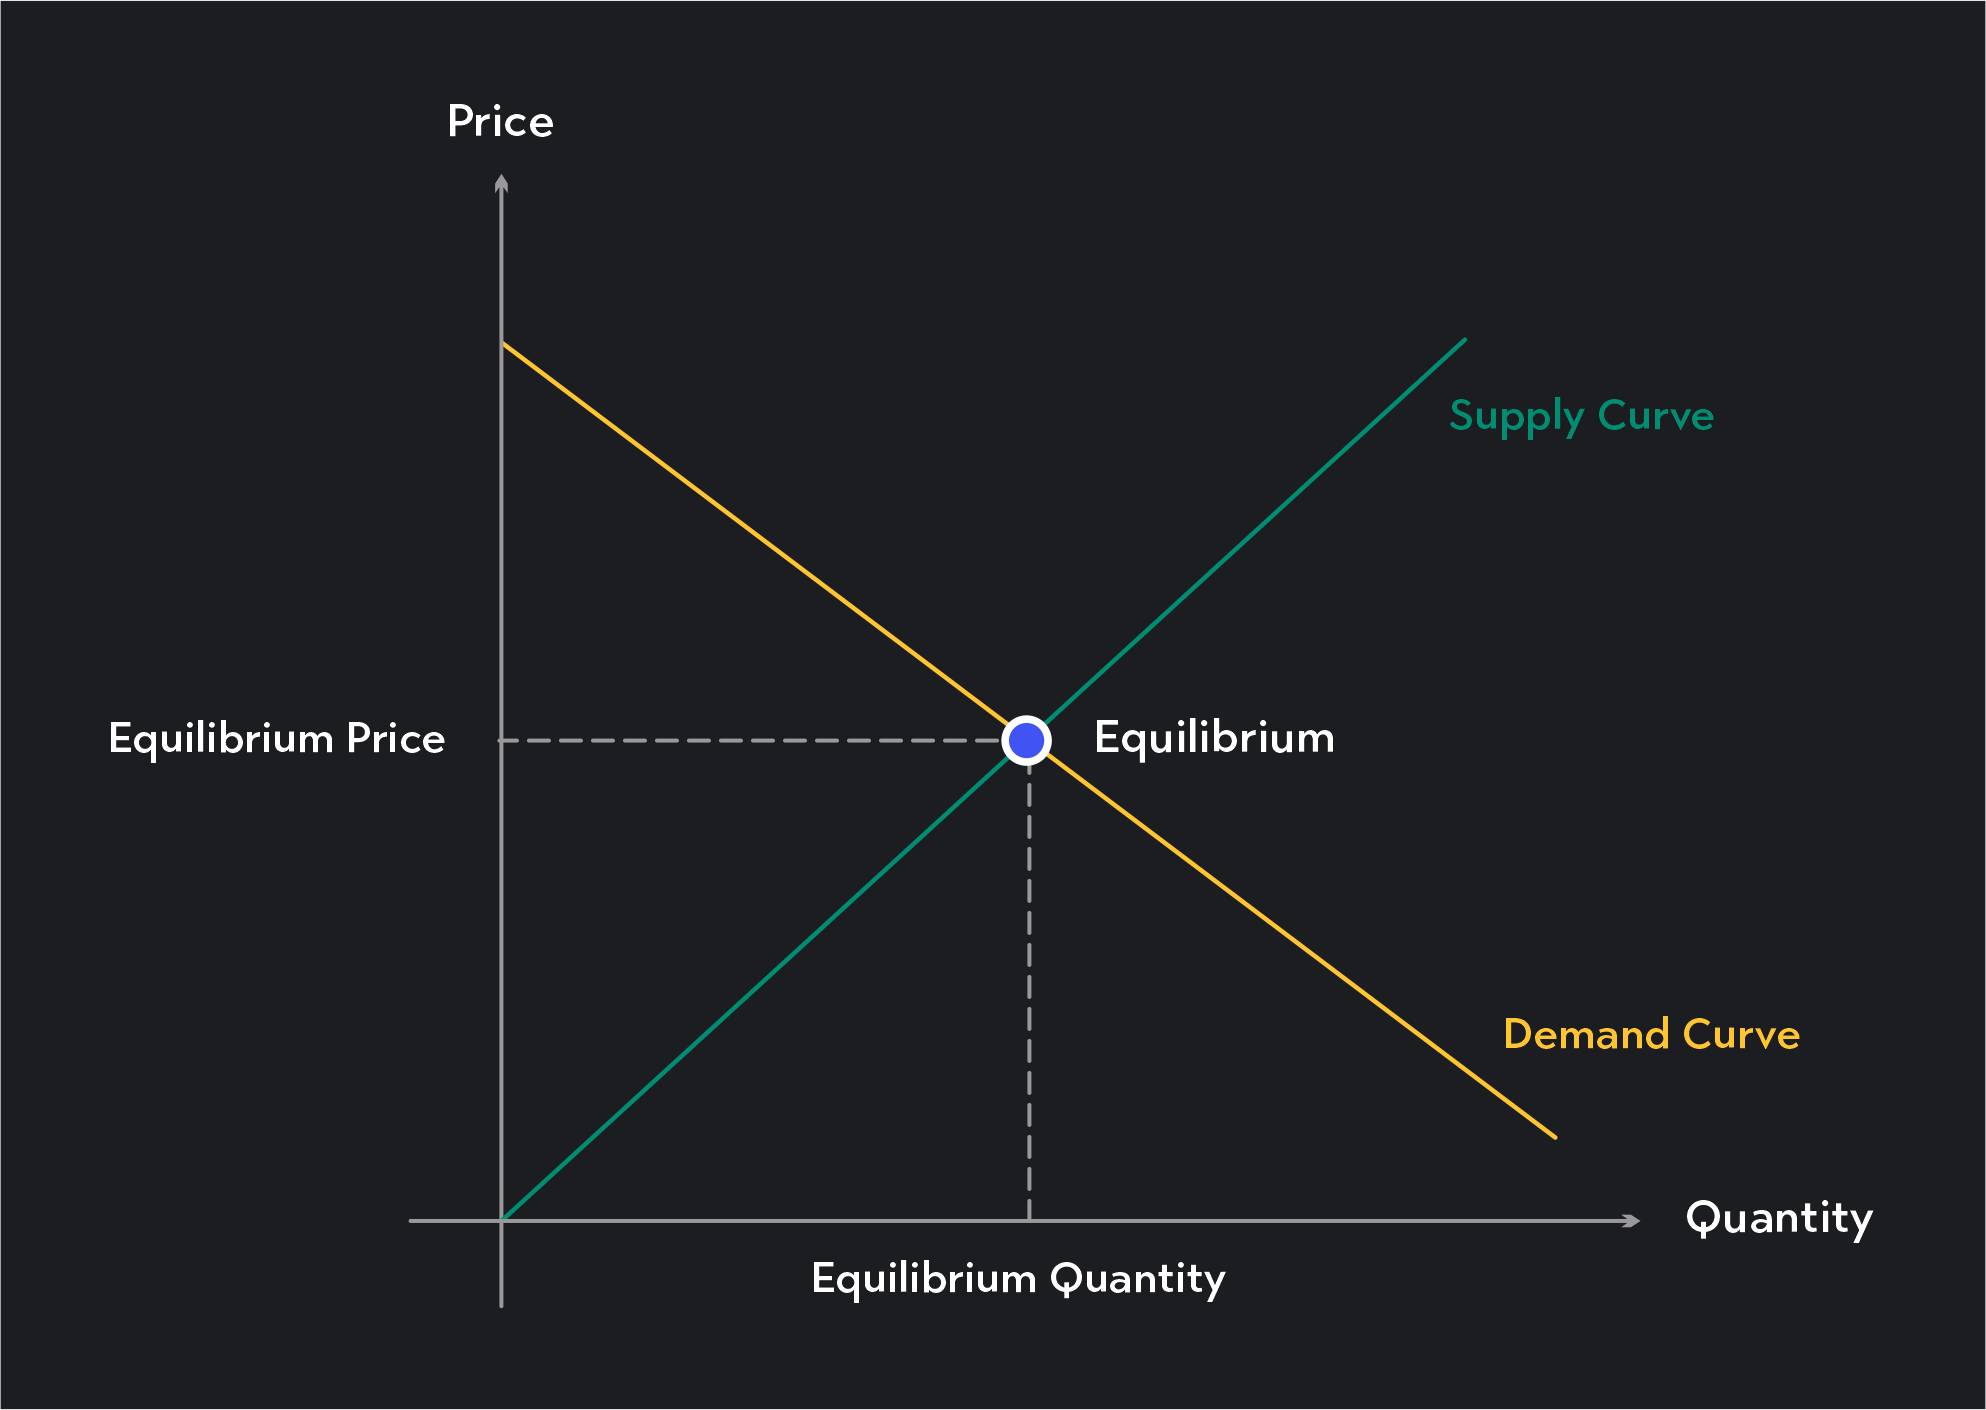
Equilibrium in perfect competition is the point where the quantity supplied by sellers is equal to the quantity demanded by consumers. This point tells you the equilibrium price and quantity—the price and quantity the market will gravitate toward in the long run, assuming no government intervention in the market and no supply or demand shifts.
You can find the equilibrium at the intersection of the upward-sloping supply curve and the downward-sloping demand curve on a supply and demand diagram.
What Is Profit Maximization?
In perfect competition, as with most market structure models, we assume sellers want to maximize profits. Profits are the difference between total revenue and total costs. Revenues are what sellers earn from their customers, and costs are the explicit and implicit costs a seller incurs while running their business.
Profits = Total Revenue (TR) - Total Costs (TC) To maximize profits, firms need to identify the production point with the largest gap between revenues and costs.
Profit Maximization in Perfect Competition
One of the predictions of perfect competition is that, in the long-run, firms will earn normal profits. Normal profits are when the firm's economic profits (total revenue, less total costs) equal zero.
This might sound strange to you at first. How can zero profits be the best any firm can do? Why would any business choose to stay in a market where their total profits are zero? You need to remember two points to understand the reasoning behind normal profits.
The competition is fierce. In perfect competition, we assume sellers compete in the most competitive market environment possible. They have no ability to set prices and no ability to differentiate their product from what other sellers are bringing to the market. In such an environment, firms can make profits, or incur losses in the short-run, but in the long-run, they can’t expect a better outcome than breaking even.
Economic profits are not the same as accounting profits. Earning zero economic profits does not mean businesses won’t earn any monetary (or accounting) profits.
When economists calculate profits, they factor in both explicit and implicit costs. Explicit costs are the actual dollars businesses spend to keep their business up and running, while implicit costs equal the value of the next best opportunity business owners must forgo to run their business.
Say you babysit your aunt’s children for $100 one night when you could be pet-sitting your uncle’s labradoodle for $50. Your accounting profit equals $100 less any explicit costs you incur, like taking the bus or ordering pizza. Your economic profit equals the $100 less your explicit costs and the implicit costs of giving up the $50 you could have earned pet-sitting.
A Perfectly Competitive Firm’s Profit Maximizing Decision
Firms in perfect competition are price takers. This means they have no ability to set their own price and must accept the price set by the market. Their profit-maximizing decision, therefore, boils down to choosing a profit-maximizing level of production (q*) given the market price (P).
As a general rule, profit-maximizing firms continue to increase the number of units produced up to a point where their marginal revenue (MR) equals their marginal cost (MC). Marginal revenue is the revenue gained from each additional unit sold, while marginal cost is the cost of production per unit of output.
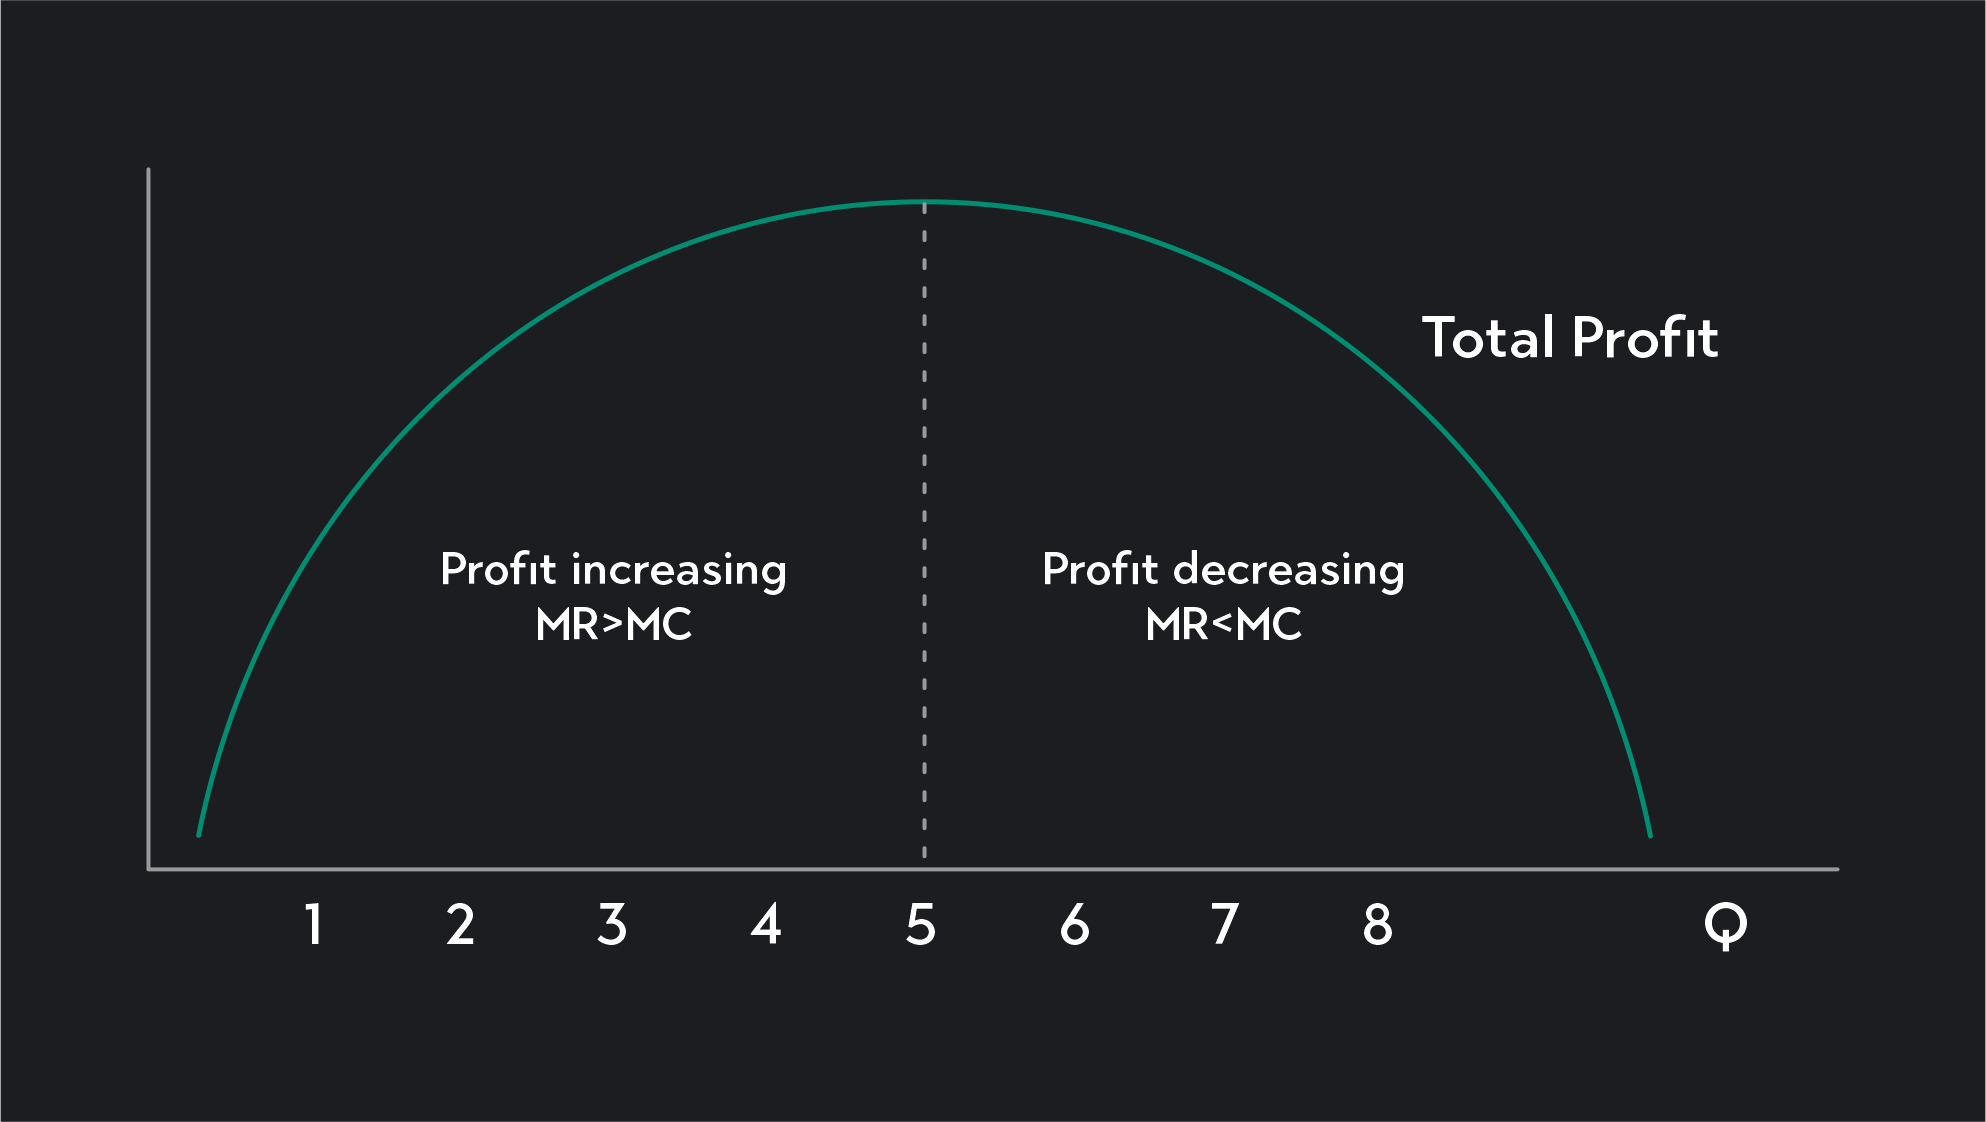
A firm’s profits increase as long as MR is greater than MC for each unit sold. Maximum profits occur at the point where MR=MC and profit decreases when MR falls below MC.
General Profit Maximization Rule
Firms should produce up to the point where…
MR = MC How To Determine the Profit Maximizing Level of Output?
In perfect competition, a firm’s marginal revenue equals average revenue (AR) and the market price (P). For every unit sold, sellers will always receive a marginal revenue equal to P. For this reason, each firm in a perfectly competitive market faces a horizontal demand curve at the market price, and we can rewrite the profit-maximization rule as follows:
Profit Maximization for Perfect Competition
Firms should produce up to the point where…
P = MC Let’s go over three methods you can use to identify the profit-maximizing quantity where P=MC.
Equations
In your economics courses, you may be asked to find a perfectly competitive firm’s profit-maximizing level of output using the market price, P, and a total cost function.
For example, suppose a good's market price is $10, and the total cost function for a firm is the one shown below.
Market Price (P)=$10 TC=1000+2q+0.01q2 To find the profit-maximizing quantity, follow these steps:
Step 1
Find the marginal cost function by taking the first derivative of the total cost function.
MC = TC′=2+0.02q Step 2
Set the marginal cost function to be equal to the market price.
$10=2+0.02q Step 3
Solve for q to find the firm’s profit-maximizing output level. In this example, at a given price of $10, the profit-maximizing output level is 400 units.
Table
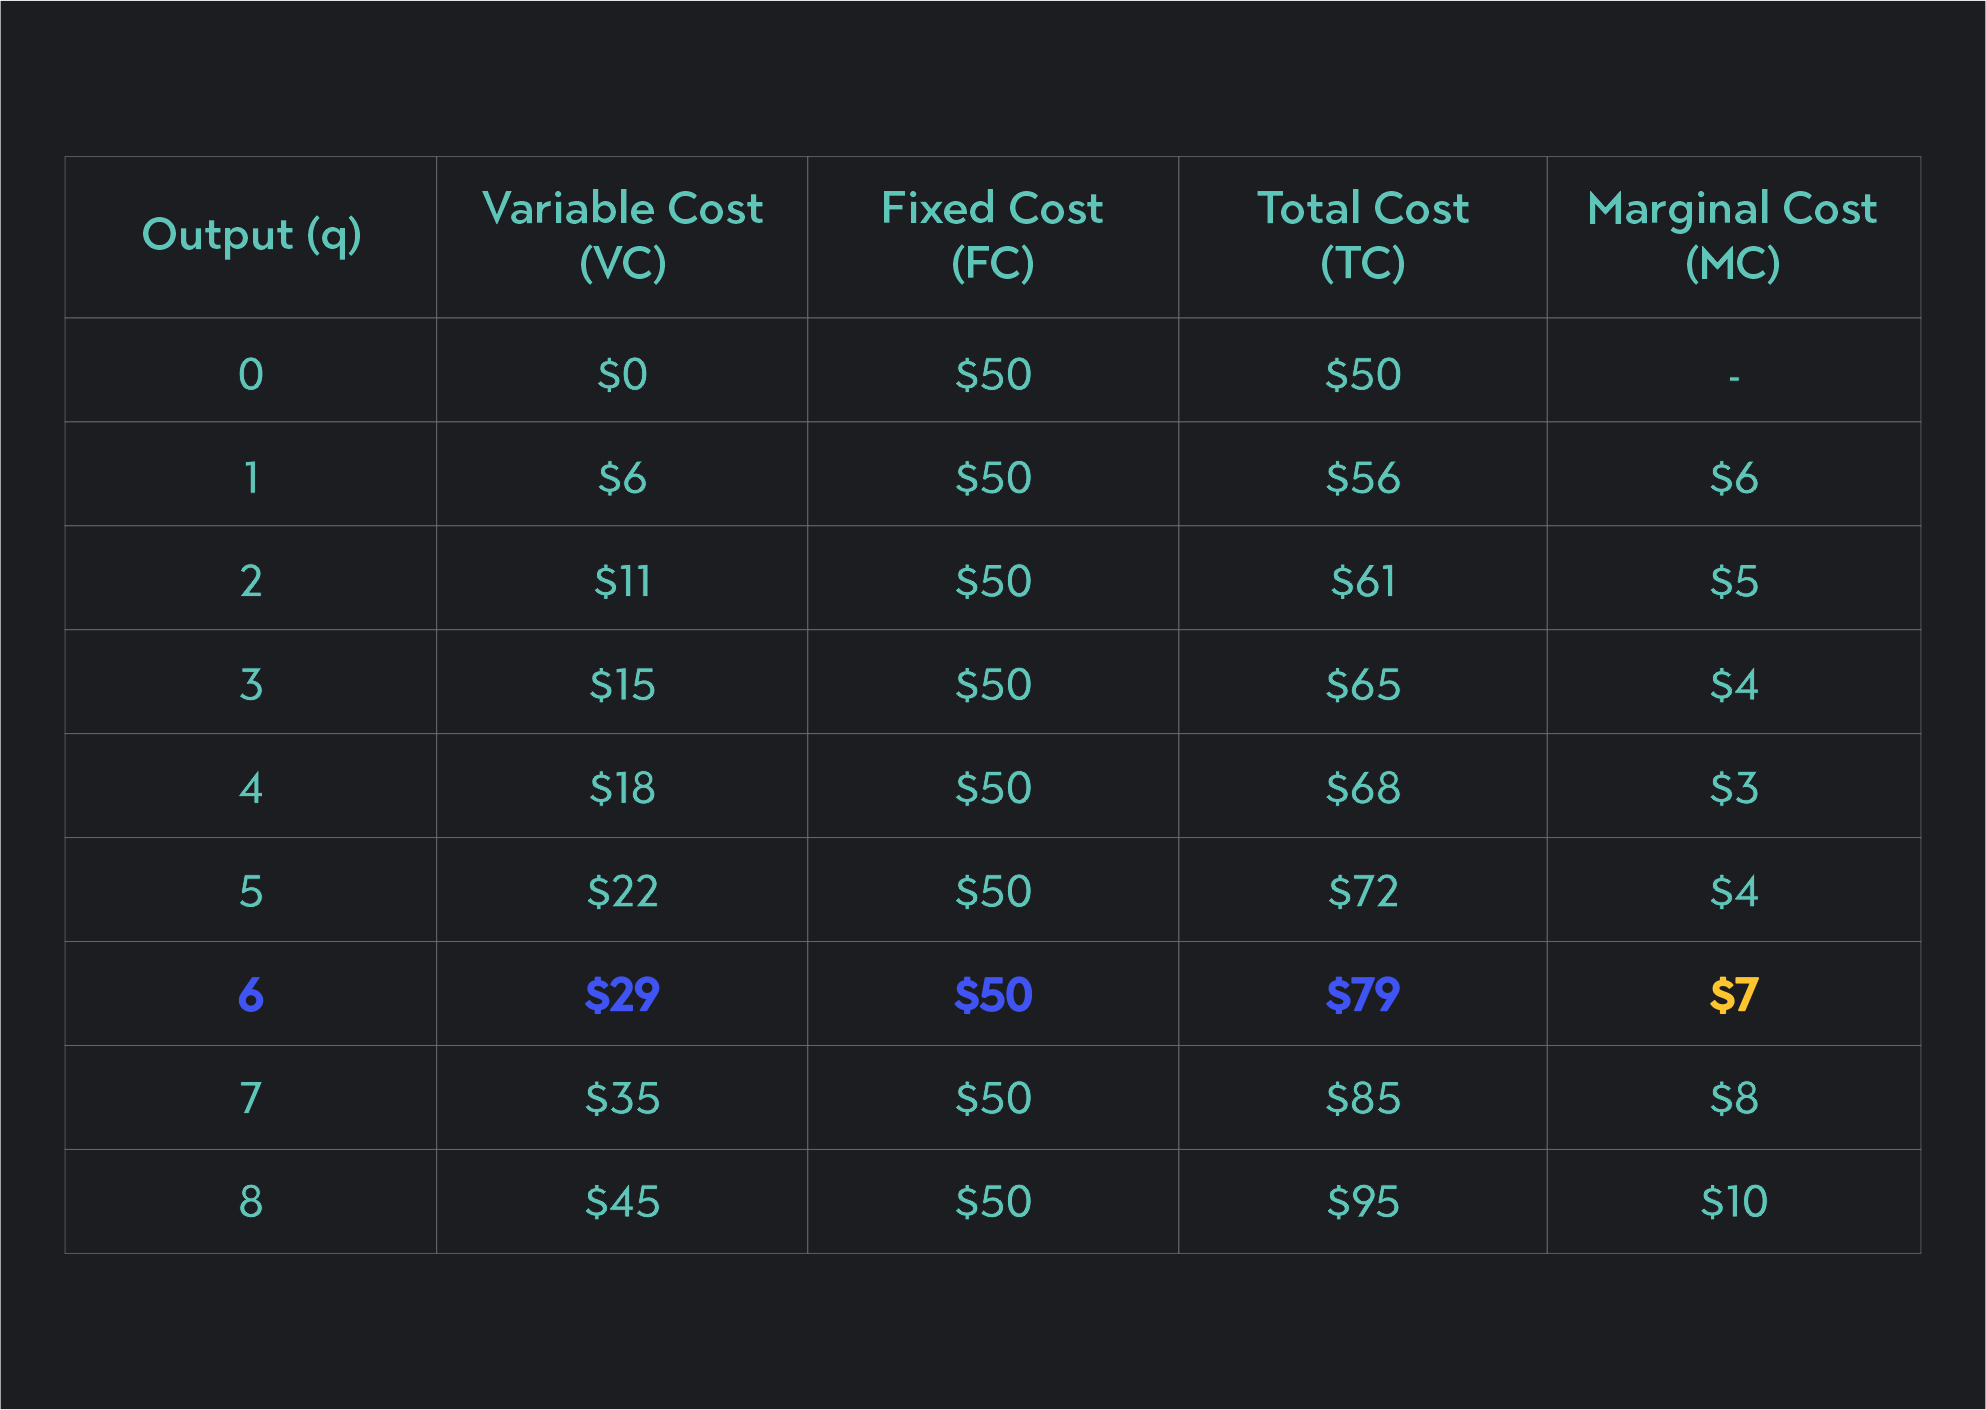
If you are given a cost table, like the one below, solve for q* using these steps.
Market Price (P)=$7 Look at the marginal cost column and find the cell where MC=P. If no cell exists where the two values are equal, look for the largest output level where the marginal cost is as close to P as possible without being greater than P.
Once you’ve identified the marginal cost, look for the corresponding quantity. This will be the firm’s profit-maximizing quantity, q*. In this example, the profit-maximizing quantity is 7 units.
Graph
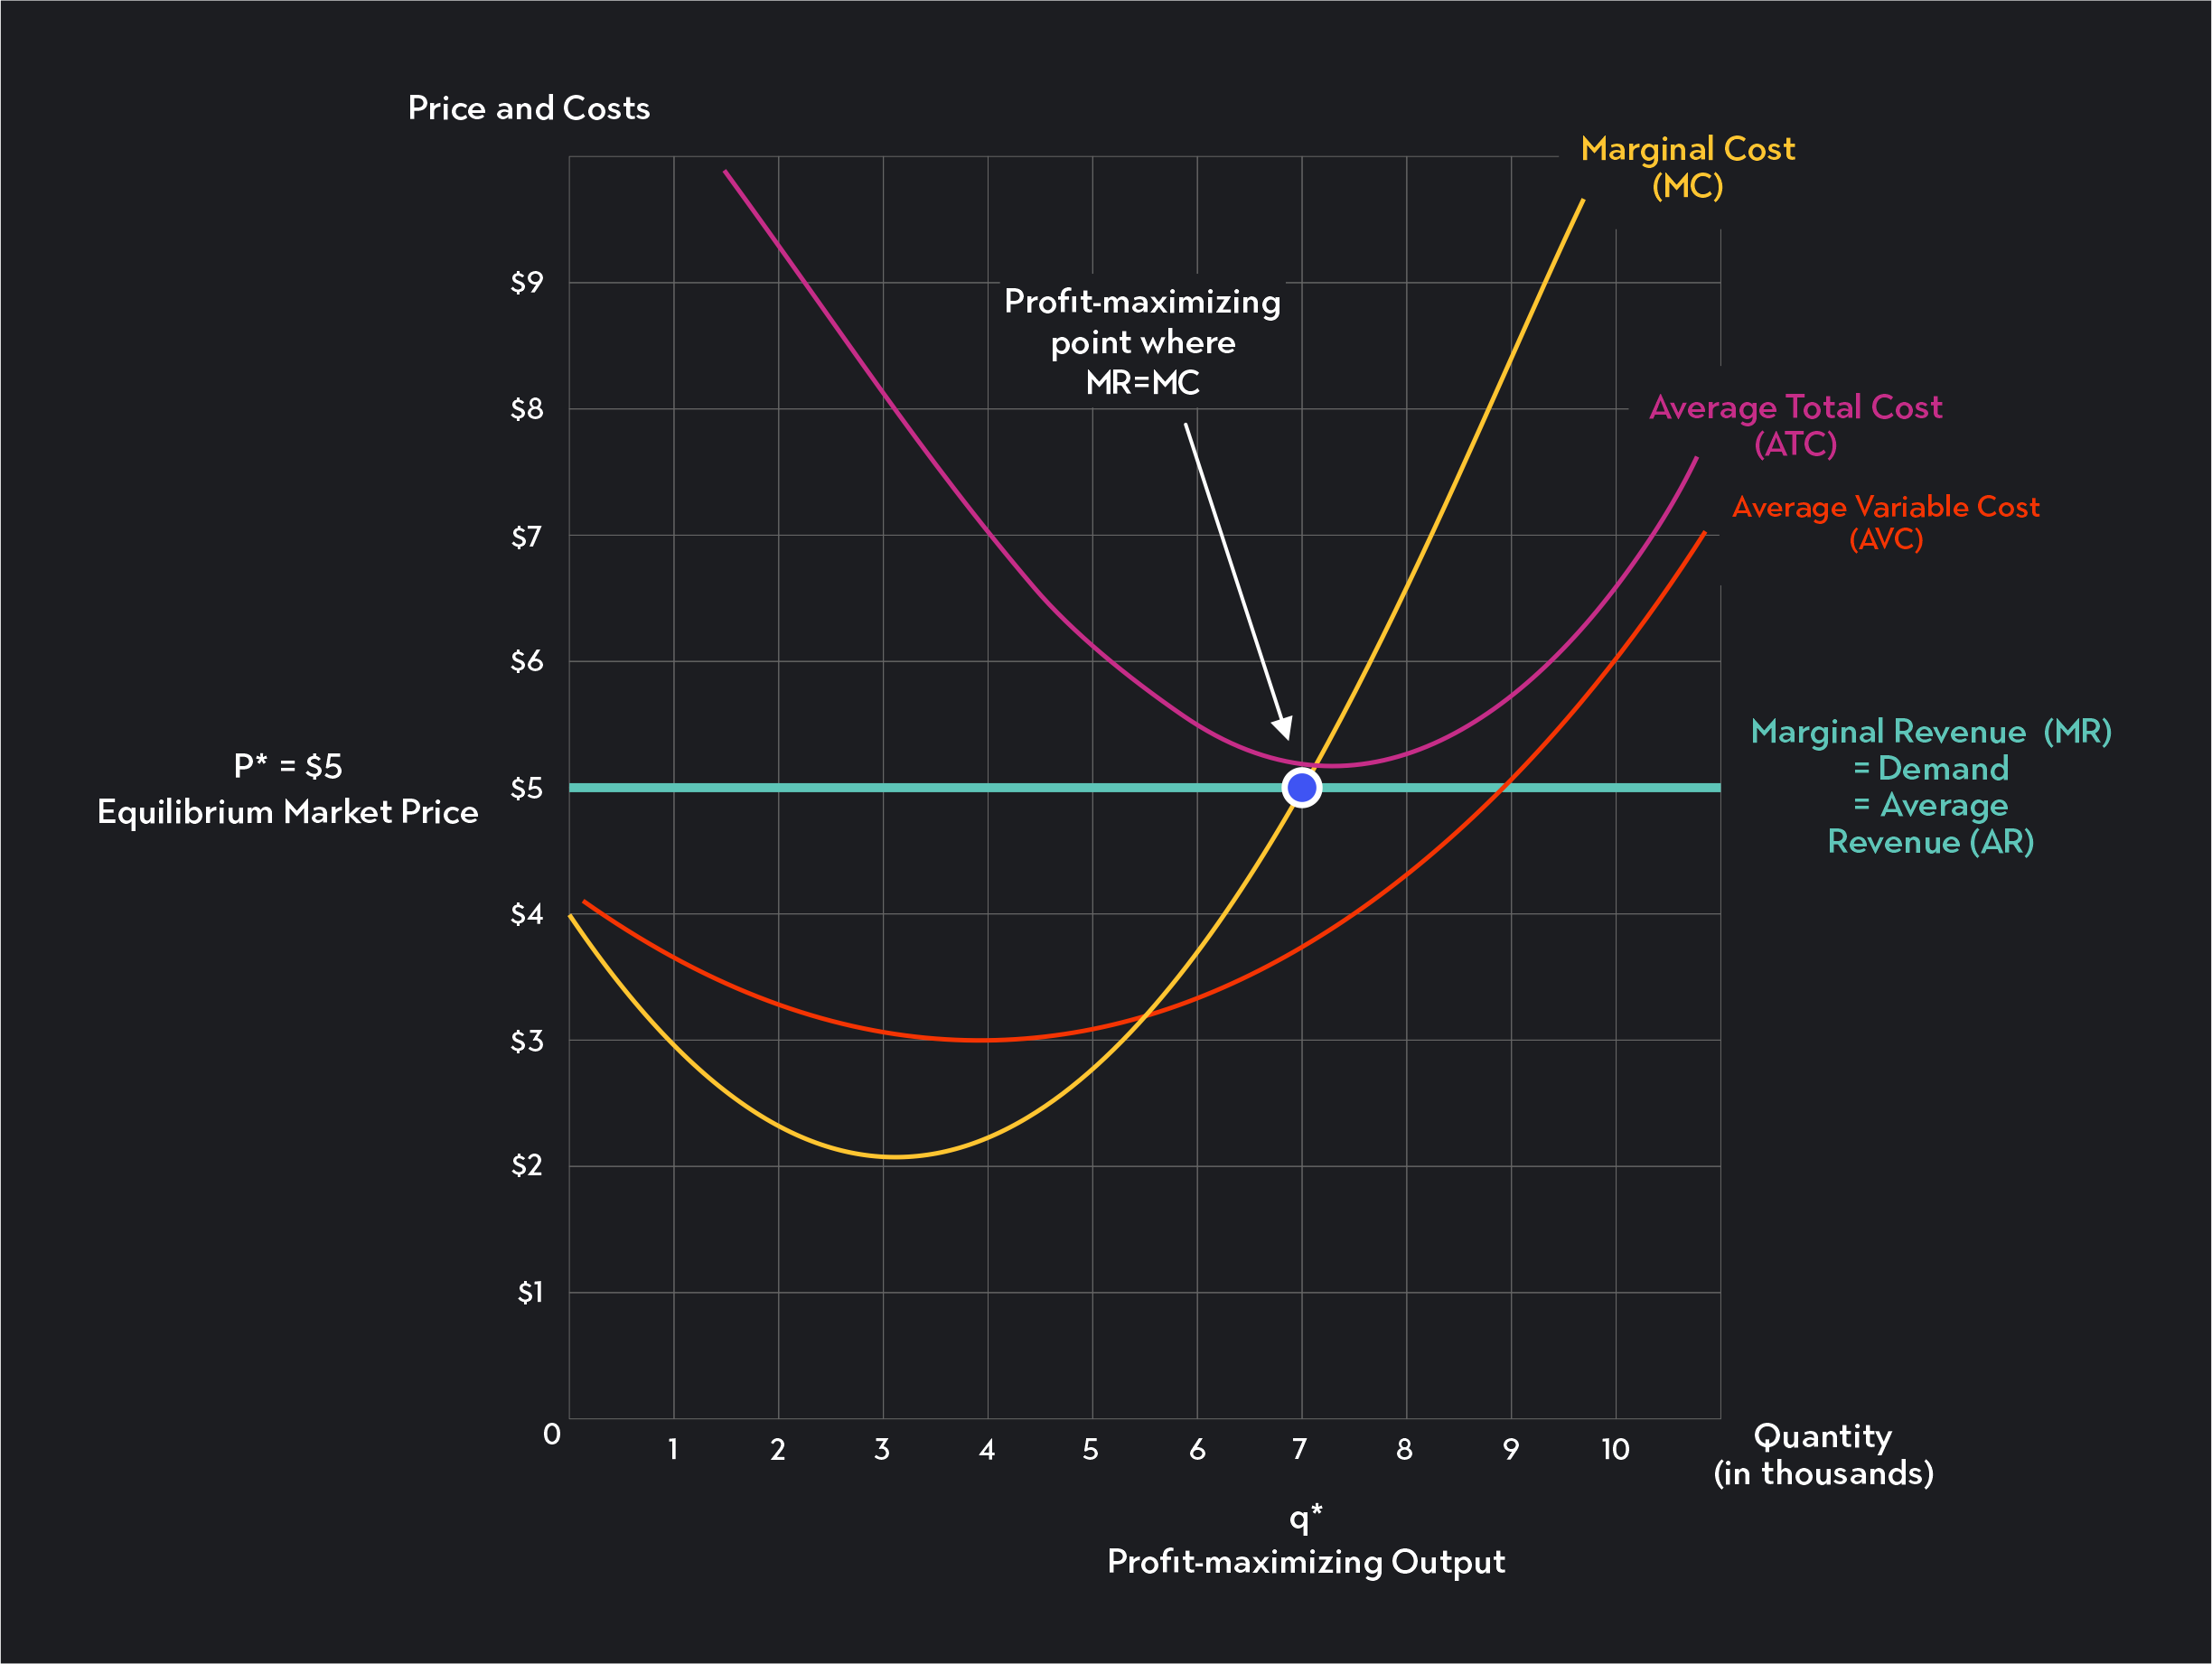
You can also identify the profit-maximizing quantity (q*) using a graph of cost and revenue curves. Follow these steps.
Step 1
Start by identifying the marginal revenue curve on the graph. Remember, the marginal revenue curve for a perfectly competitive firm is the same as the perceived demand curve (the horizontal line drawn at the market price). If you don’t see a curve labeled “marginal revenue” or “MR,” look for the line labeled “P,” “Market Price,” or “Firm’s Demand Curve.”
Step 2
Next, identify the marginal cost curve. This curve should be labeled “Marginal Cost” or “MC,” but it might also be labeled ”Supply.” That’s because a firm’s short-run supply curve in perfect competition is the marginal cost curve above its average variable cost (AVC) curve.
Step 3
Since the profit-maximizing point occurs where MR=MC, you need to find the point where these two values are equal. This occurs at the intersection of the MR line and the MC curve. If you’re looking at a graph of the long-run, this point of intersection will occur at the minimum of the firm’s average total cost curve (ATC).
Step 4
To find the profit-maximizing quantity, trace the point of intersection down to the horizontal axis. There you’ll find the profit-maximizing quantity, q*. In this example, the firm produces 7,000 units to maximize profits.
Explore Outlier's Award-Winning For-Credit Courses
Outlier (from the co-founder of MasterClass) has brought together some of the world's best instructors, game designers, and filmmakers to create the future of online college.
Check out these related courses: