Learn about the determinants of demand and why it’s important. Plus get a refresher on the concept of demand, its laws, and its importance for economic growth.
Consumer demand is at the heart of economics. If it weren’t for our needs and wants, we would not have a functioning economy. When demand is robust, the economy tends to be very healthy, and when demand slumps, the economy typically slows or falls into a recession.
Given the importance of demand, it’s crucial to understand what drives demand and what causes it to change.
In this article, we’ll look at how price and five other determinants impact buyers' behavior in the economy.
What Is Demand?
In economics, the term “demand” refers to the behavior of buyers. We model this behavior by looking at the relationship between the prices of goods and services and the quantities buyers are willing to purchase at those prices.
In macroeconomics, you’ll hear the word demand used to describe aggregate demand across an entire economy. In microeconomics, you’ll analyze demand within specific markets, such as the market for housing or the market for gas.
What Drives Demand?
Ultimately, consumers' desires and preferences drive demand, but demand is also a function of price.
When we map the relationship between price and quantity demanded, we find an inverse relationship. We call this inverse relationship the Law of Demand. All else being equal, when the price of a good is high, consumers will demand fewer units. When the price is low, consumers demand more units.
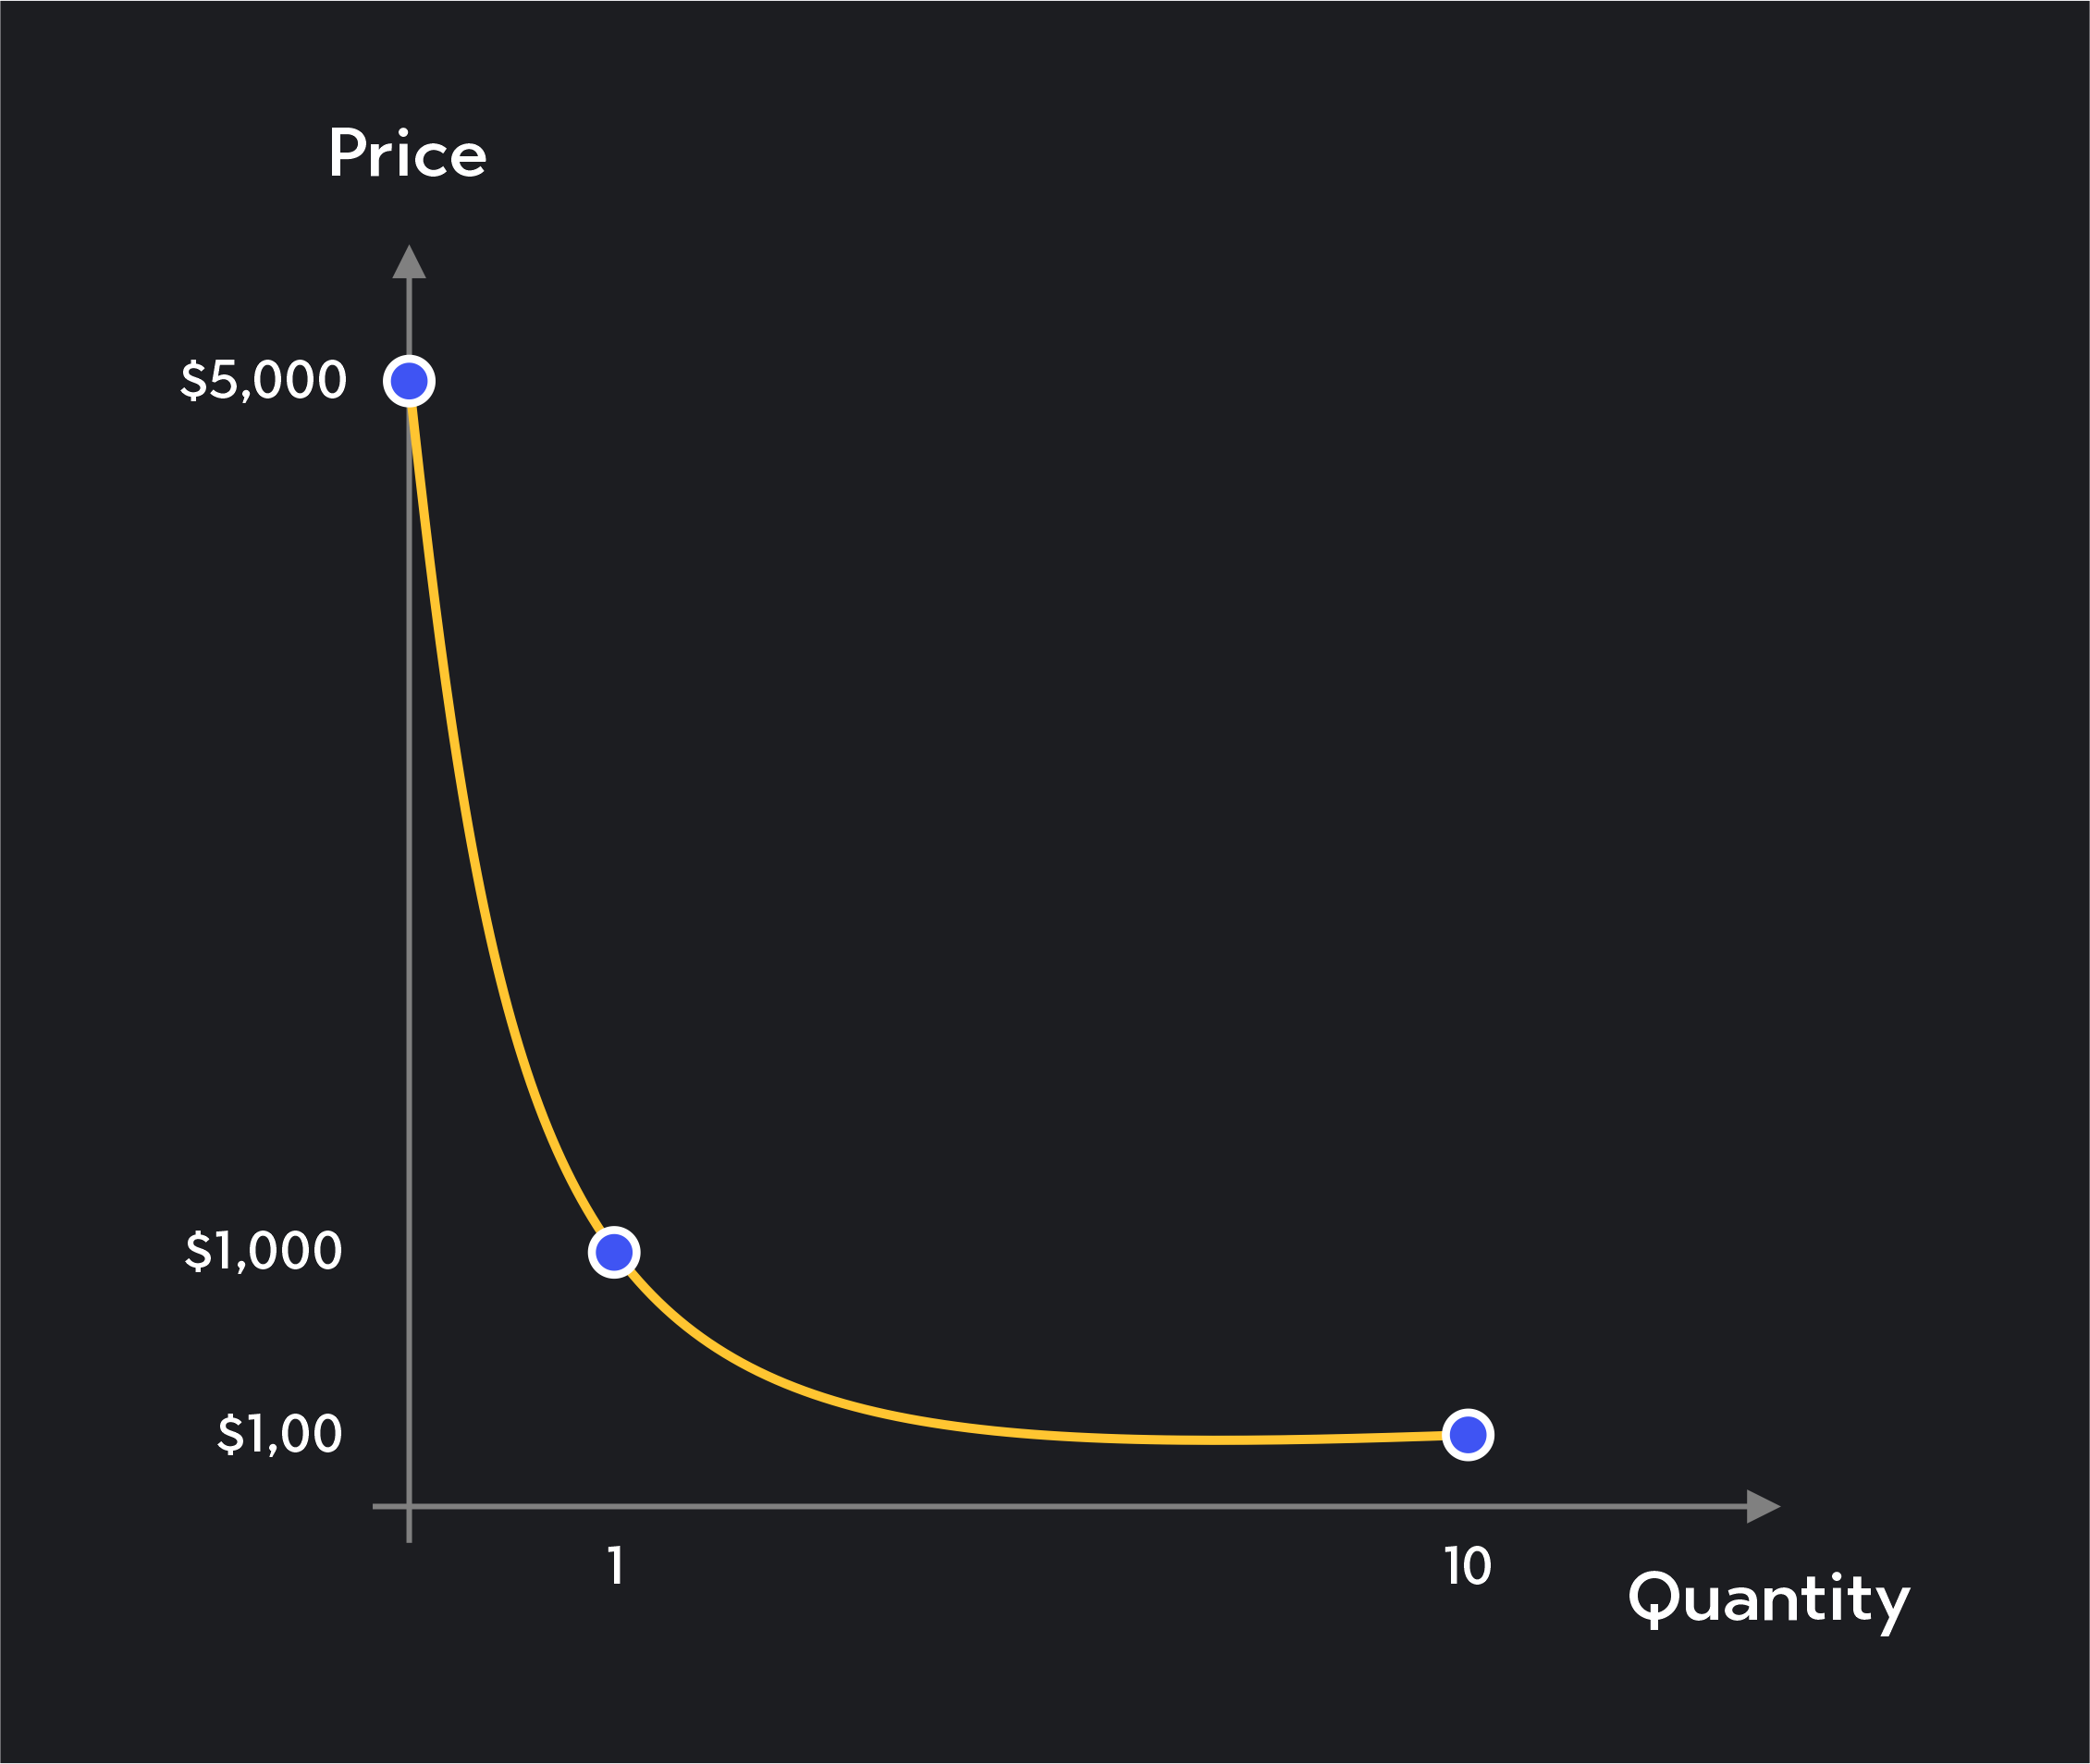
As a quick example, say I offer you front-row tickets to a Beyonce concert for a price of $5,000 per ticket. Beyonce may be your favorite artist, but at this price, you may be unwilling to purchase even a single ticket. If I were to lower the price, the quantity of tickets you’d be willing to purchase would likely increase.
If I lowered the price to, say, $500, you may be willing to purchase 1 ticket. If I lowered the price further to $100, you may be willing to buy 10 tickets. This is the law of demand at work. Despite a strong desire to see an artist on stage or despite a desire to purchase a good you’ve been longing to have, price matters.
5 Determinants of Demand
Other than price, there are 5 major determinants of demand. When these factors change, the quantities that consumers demand at either increase or decrease at every price.
1. Buyers’ Income
The budget or income of consumers matters tremendously. Think back to our Beyonce example. Part of the reason you may be unwilling to spend $5,000 on a concert ticket is that $5,000 is a lot of money. You need the money for other things. The more income you have, however, the more affordable a $5,000 ticket becomes. A Beyonce fan who’s a millionaire may easily dish out tens of thousands of dollars for $5,000 tickets.
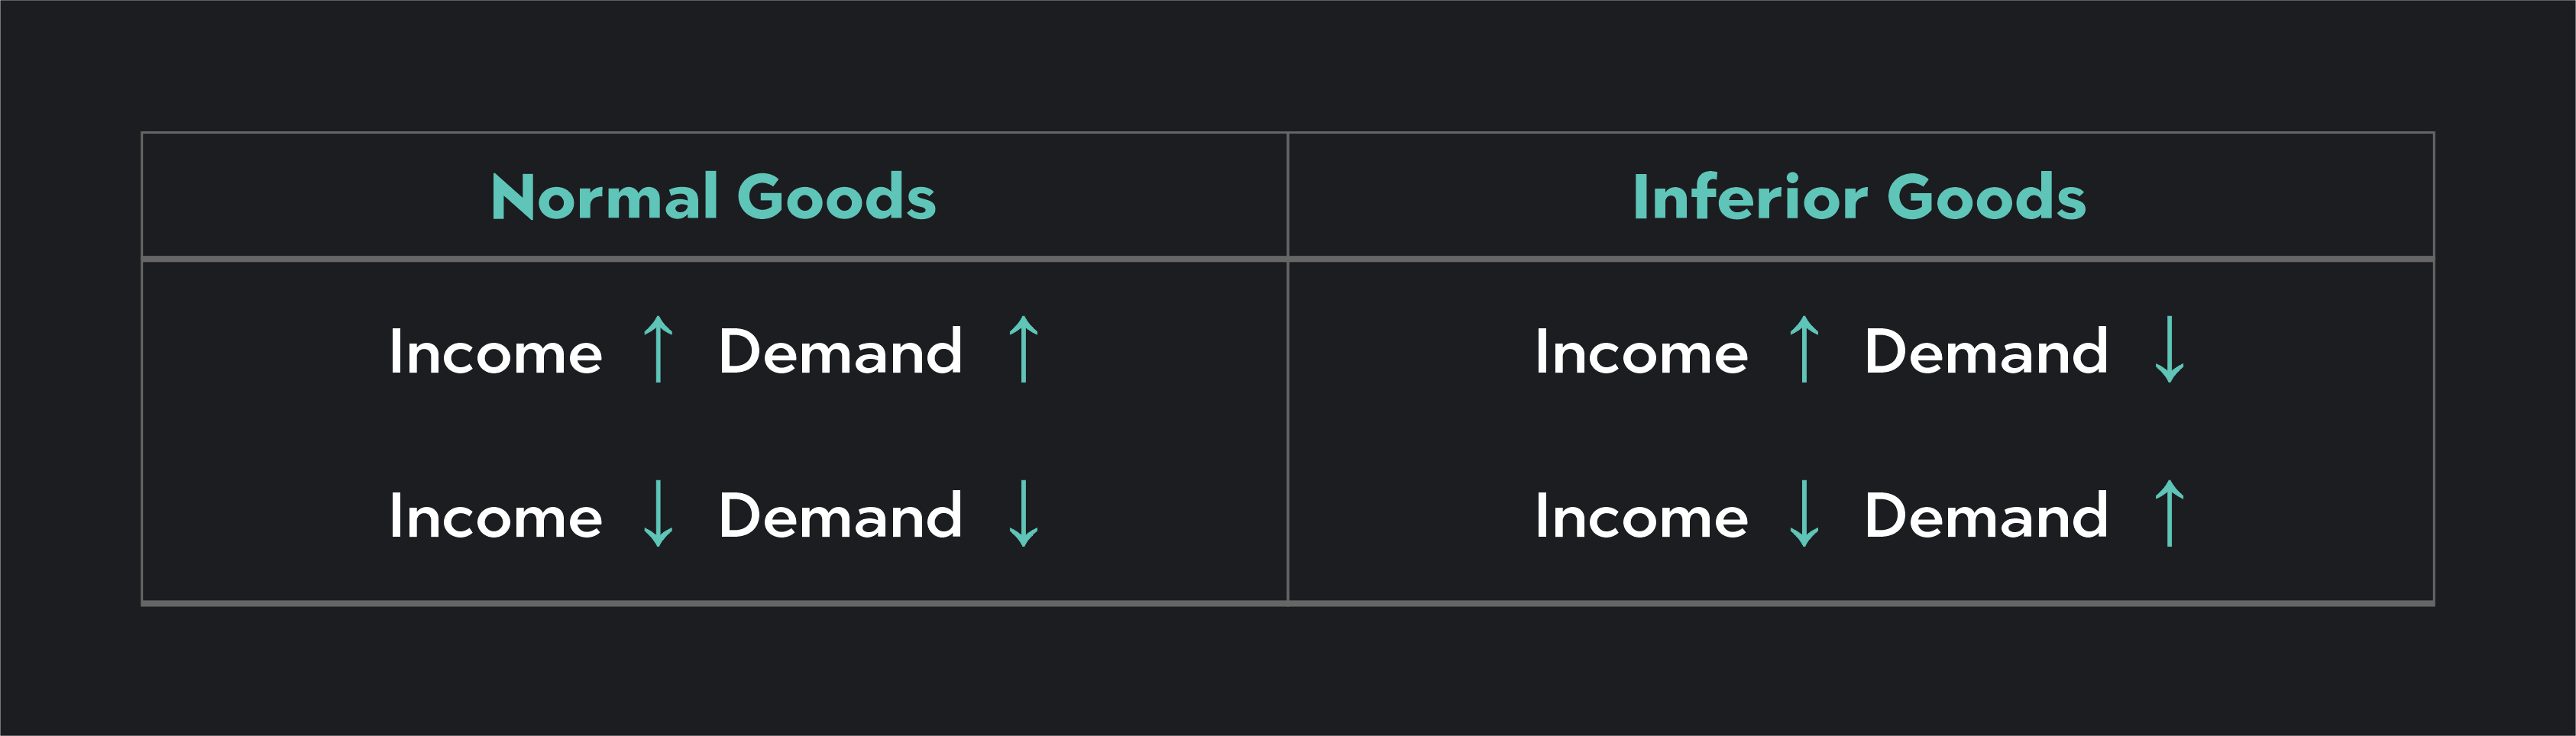
In general, demand rises as consumer incomes increase and falls when consumer incomes decrease. Economists call goods that fit this pattern “normal goods.” There is, however, an exception to this rule.
For a class of goods and services known as “inferior goods,” the relationship between income and demand is an inverse relationship. An example of this is cheap foods like instant noodles. You buy instant noodles because they are cheap, but as your income decreases, your demand decreases as you switch to more expensive alternatives like unprocessed ingredients or fresh noodles served at a restaurant.
Economists distinguish between inferior goods and normal goods to highlight the fact that for
2. The Price of Related Goods and Services
Another determinant of demand is the price of related goods and services, of which there are two types: substitutes and complements.
Substitute goods are products that can be bought in place of another. For example, you may be willing to substitute Häagen-Dazs ice cream with Otter Pops popsicles.
A complementary good is a good or service that is often purchased together with another. Think pasta and pasta sauce or ketchup and mustard.
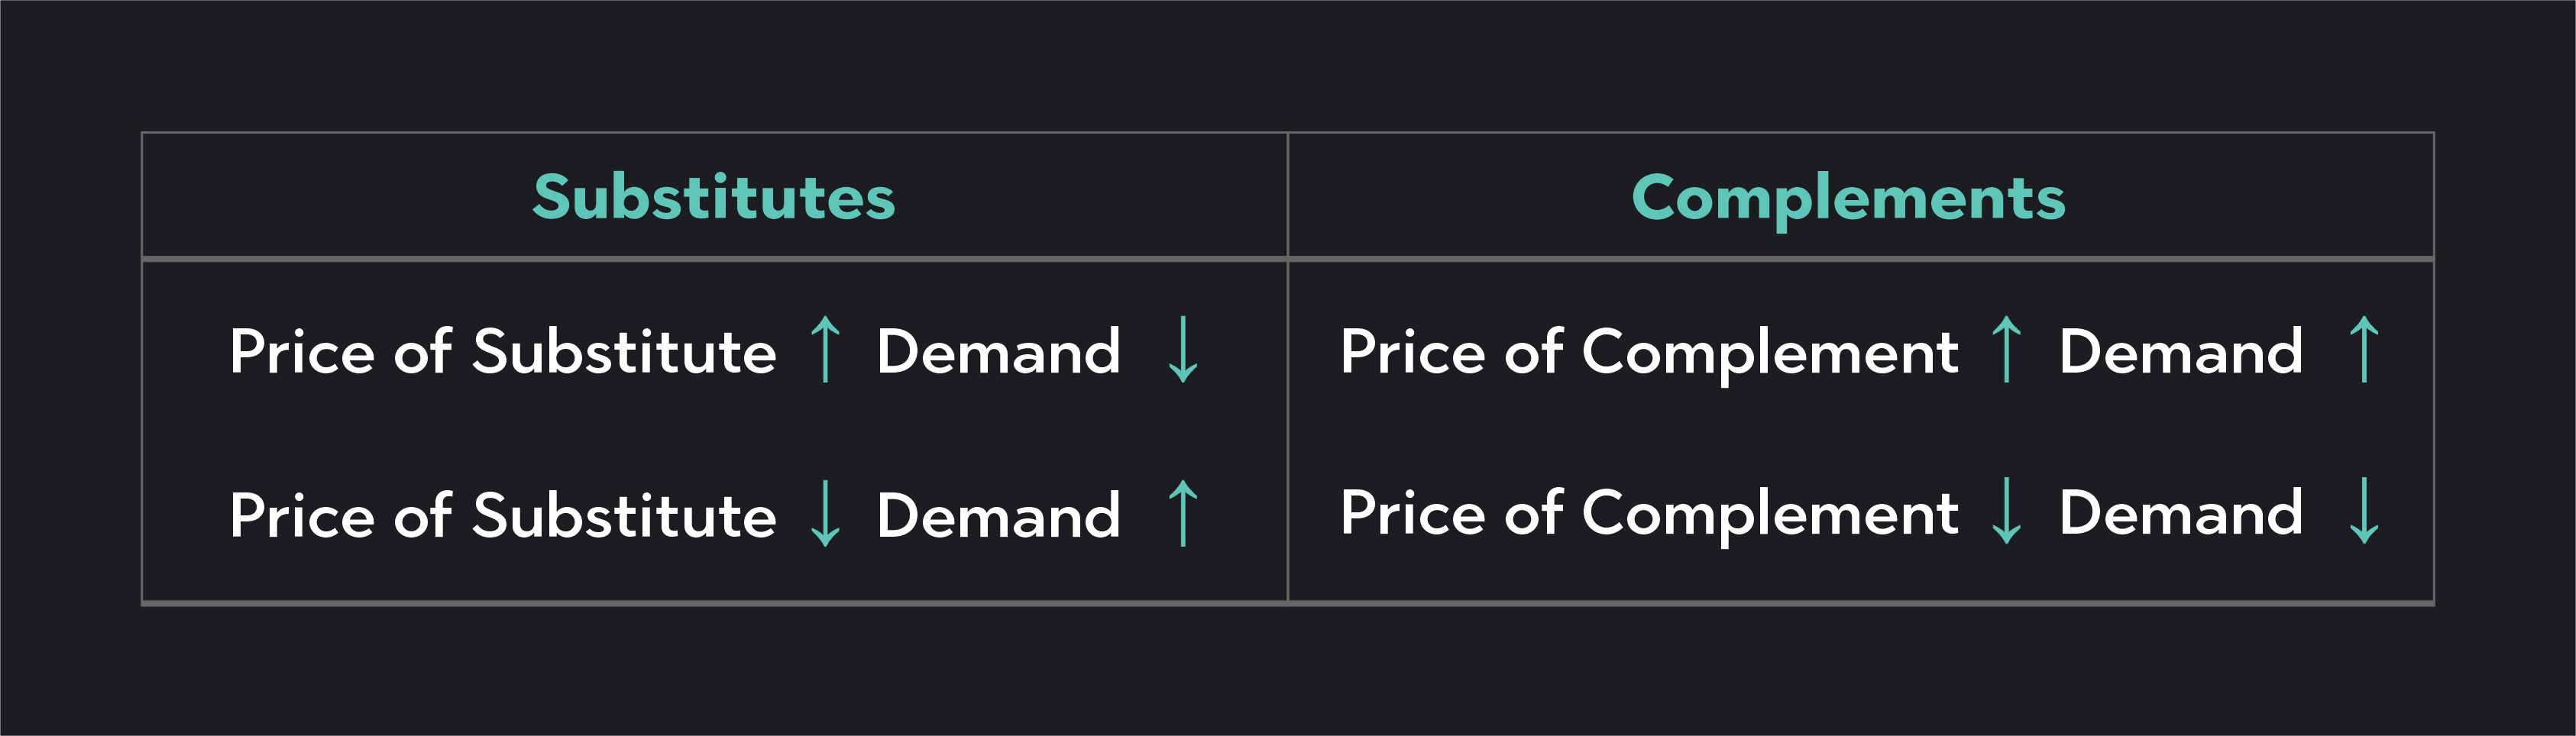
An increase in the price of a substitute will increase demand for a product. For example, if you are somewhat indifferent between Häagen-Dazs and Otter Pops, if the cost of Otter Pops increases, you’ll likely buy more Häagen-Dazs. The opposite is also true. A decrease in the price of a substitute will decrease demand. All else being equal, if the price of Otter Pops drops, you’ll likely demand less Häagen-Dazs.
The price of a complement is inversely related to demand. All else being equal, you’ll likely buy more pasta if pasta sauce prices decrease. If the price of pasta sauce increases, your demand for pasta decreases.
3. Tastes and Preferences of Consumers
The tastes and preferences are the most fundamental determinants of demand. The more popular a good is, the higher the demand for it. When a good or service loses popularity, demand falls.
4. Consumer Expectations of When Prices Will Rise or Fall
Demand also depends on what buyers think will happen in the future. Imagine you want to buy a new gaming console and are just weeks away from Black Friday. Would you buy the console now or wait for it to go on sale?
Demand in the present falls if consumers believe prices will be lower in the future. Likewise, demand in the present increases if consumers believe that future prices will be higher.
5. Demographics and Market Size
The final determinant of demand is the number of consumers in the market. A nice one-bedroom Airbnb listed in Manhattan will have higher demand than if it were listed in upstate New York. This is, in part, because there are more people looking for Airbnbs in Manhattan. When the number of buyers increases, demand increases. When the number of buyers falls, demand decreases.
How To Show Changes in Demand on a Demand Curve
Now that you know what factors influence demand, we’ll end this article by showing you how changes in demand can be shown on a demand curve.
Price and Movements Along a Fixed Demand Curve
If the determinants of demand remain unchanged, but the market price changes, we show the impact on buyers as a movement along a fixed demand curve.
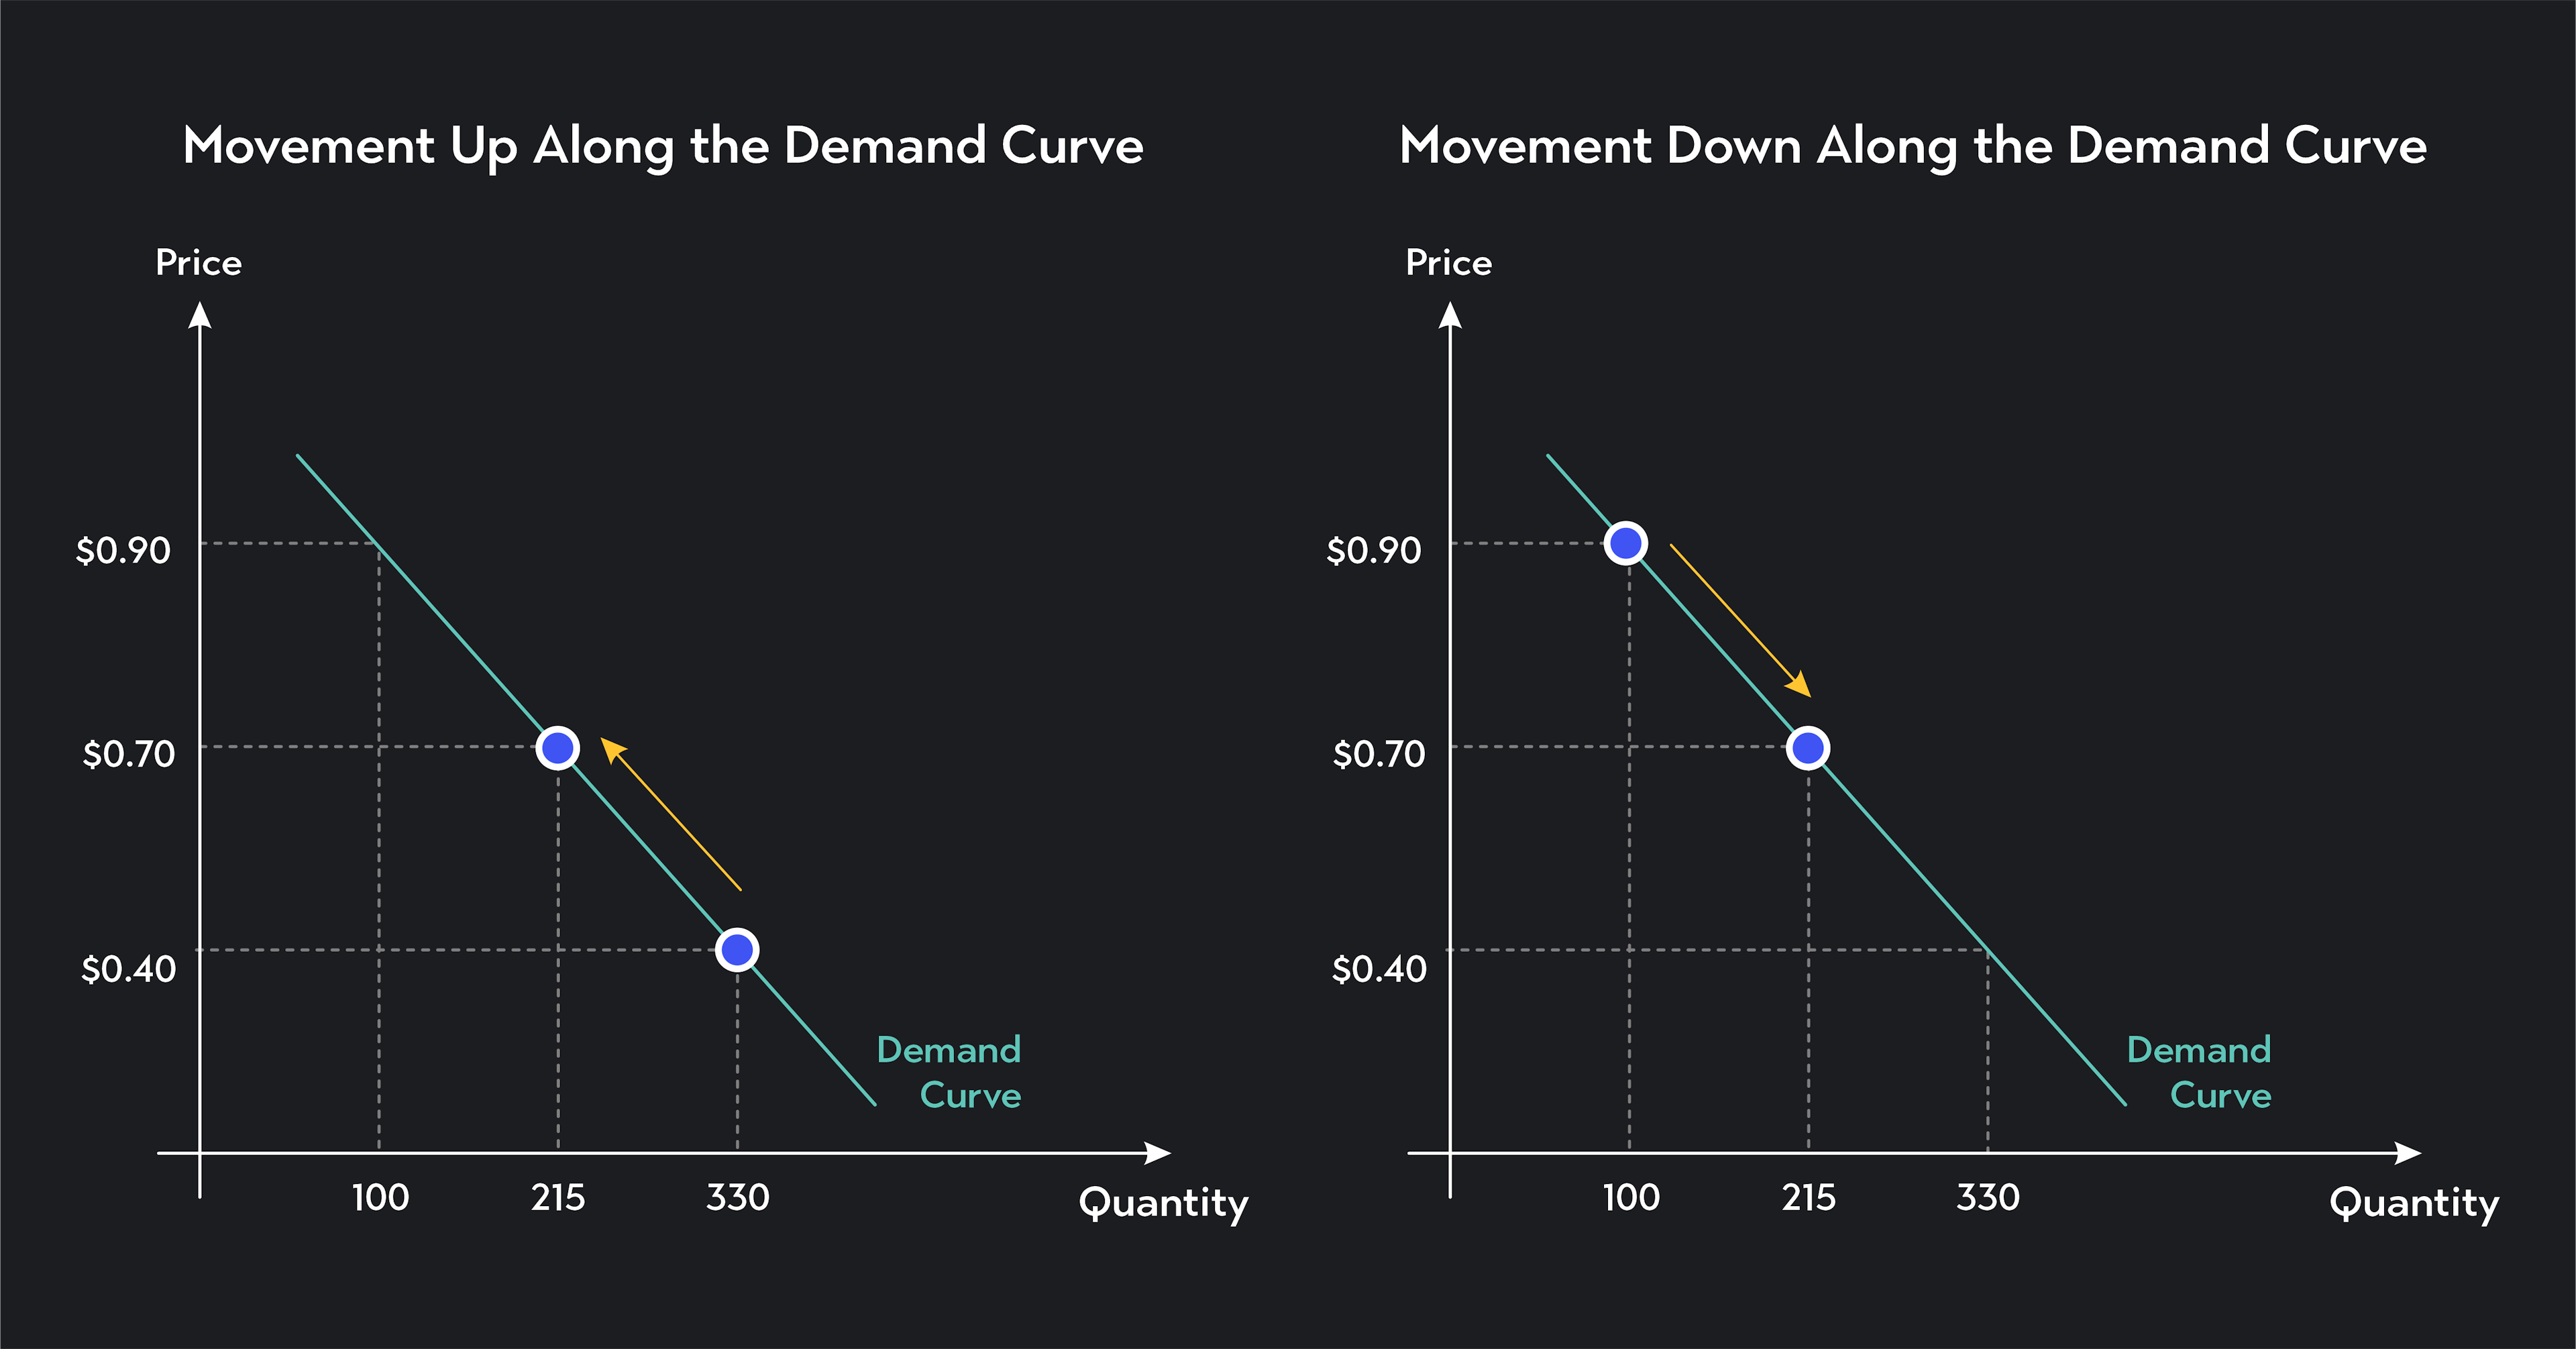
When the price increases, there is a movement up and to the left along the demand curve. Following the law of demand, this movement shows the quantity demanded falling as the price increases.
When the price decreases, there is a movement down and to the right along the demand curve. Following the law of demand, this movement shows the quantity demanded increasing as the price decreases.
The extent to which quantity demanded changes in response to a price change depends on the price elasticity of demand. When a good is elastic, quantity changes by a lot relative to the change in price. When a good is inelastic quantity changes by a little relative to the price change.
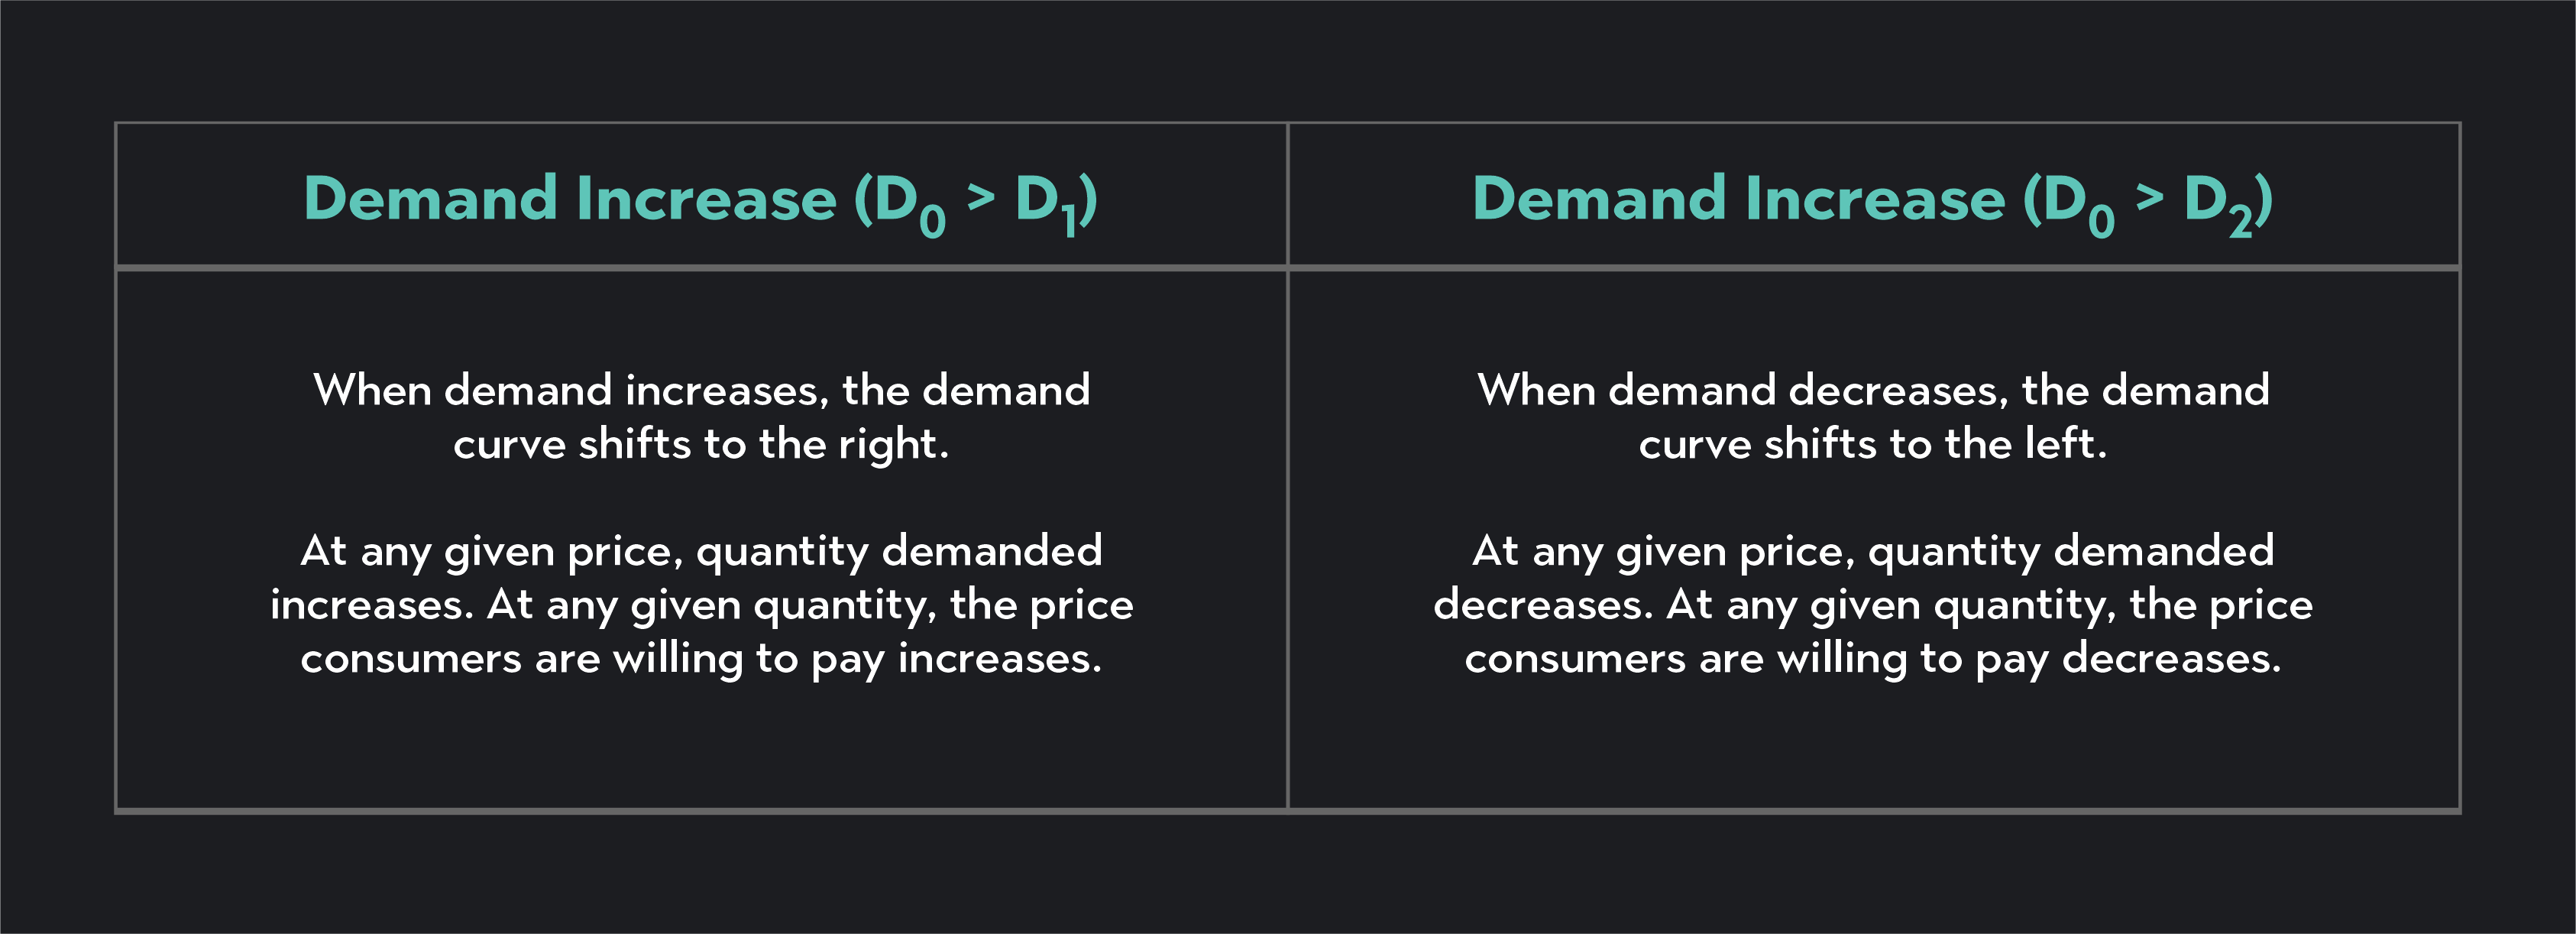
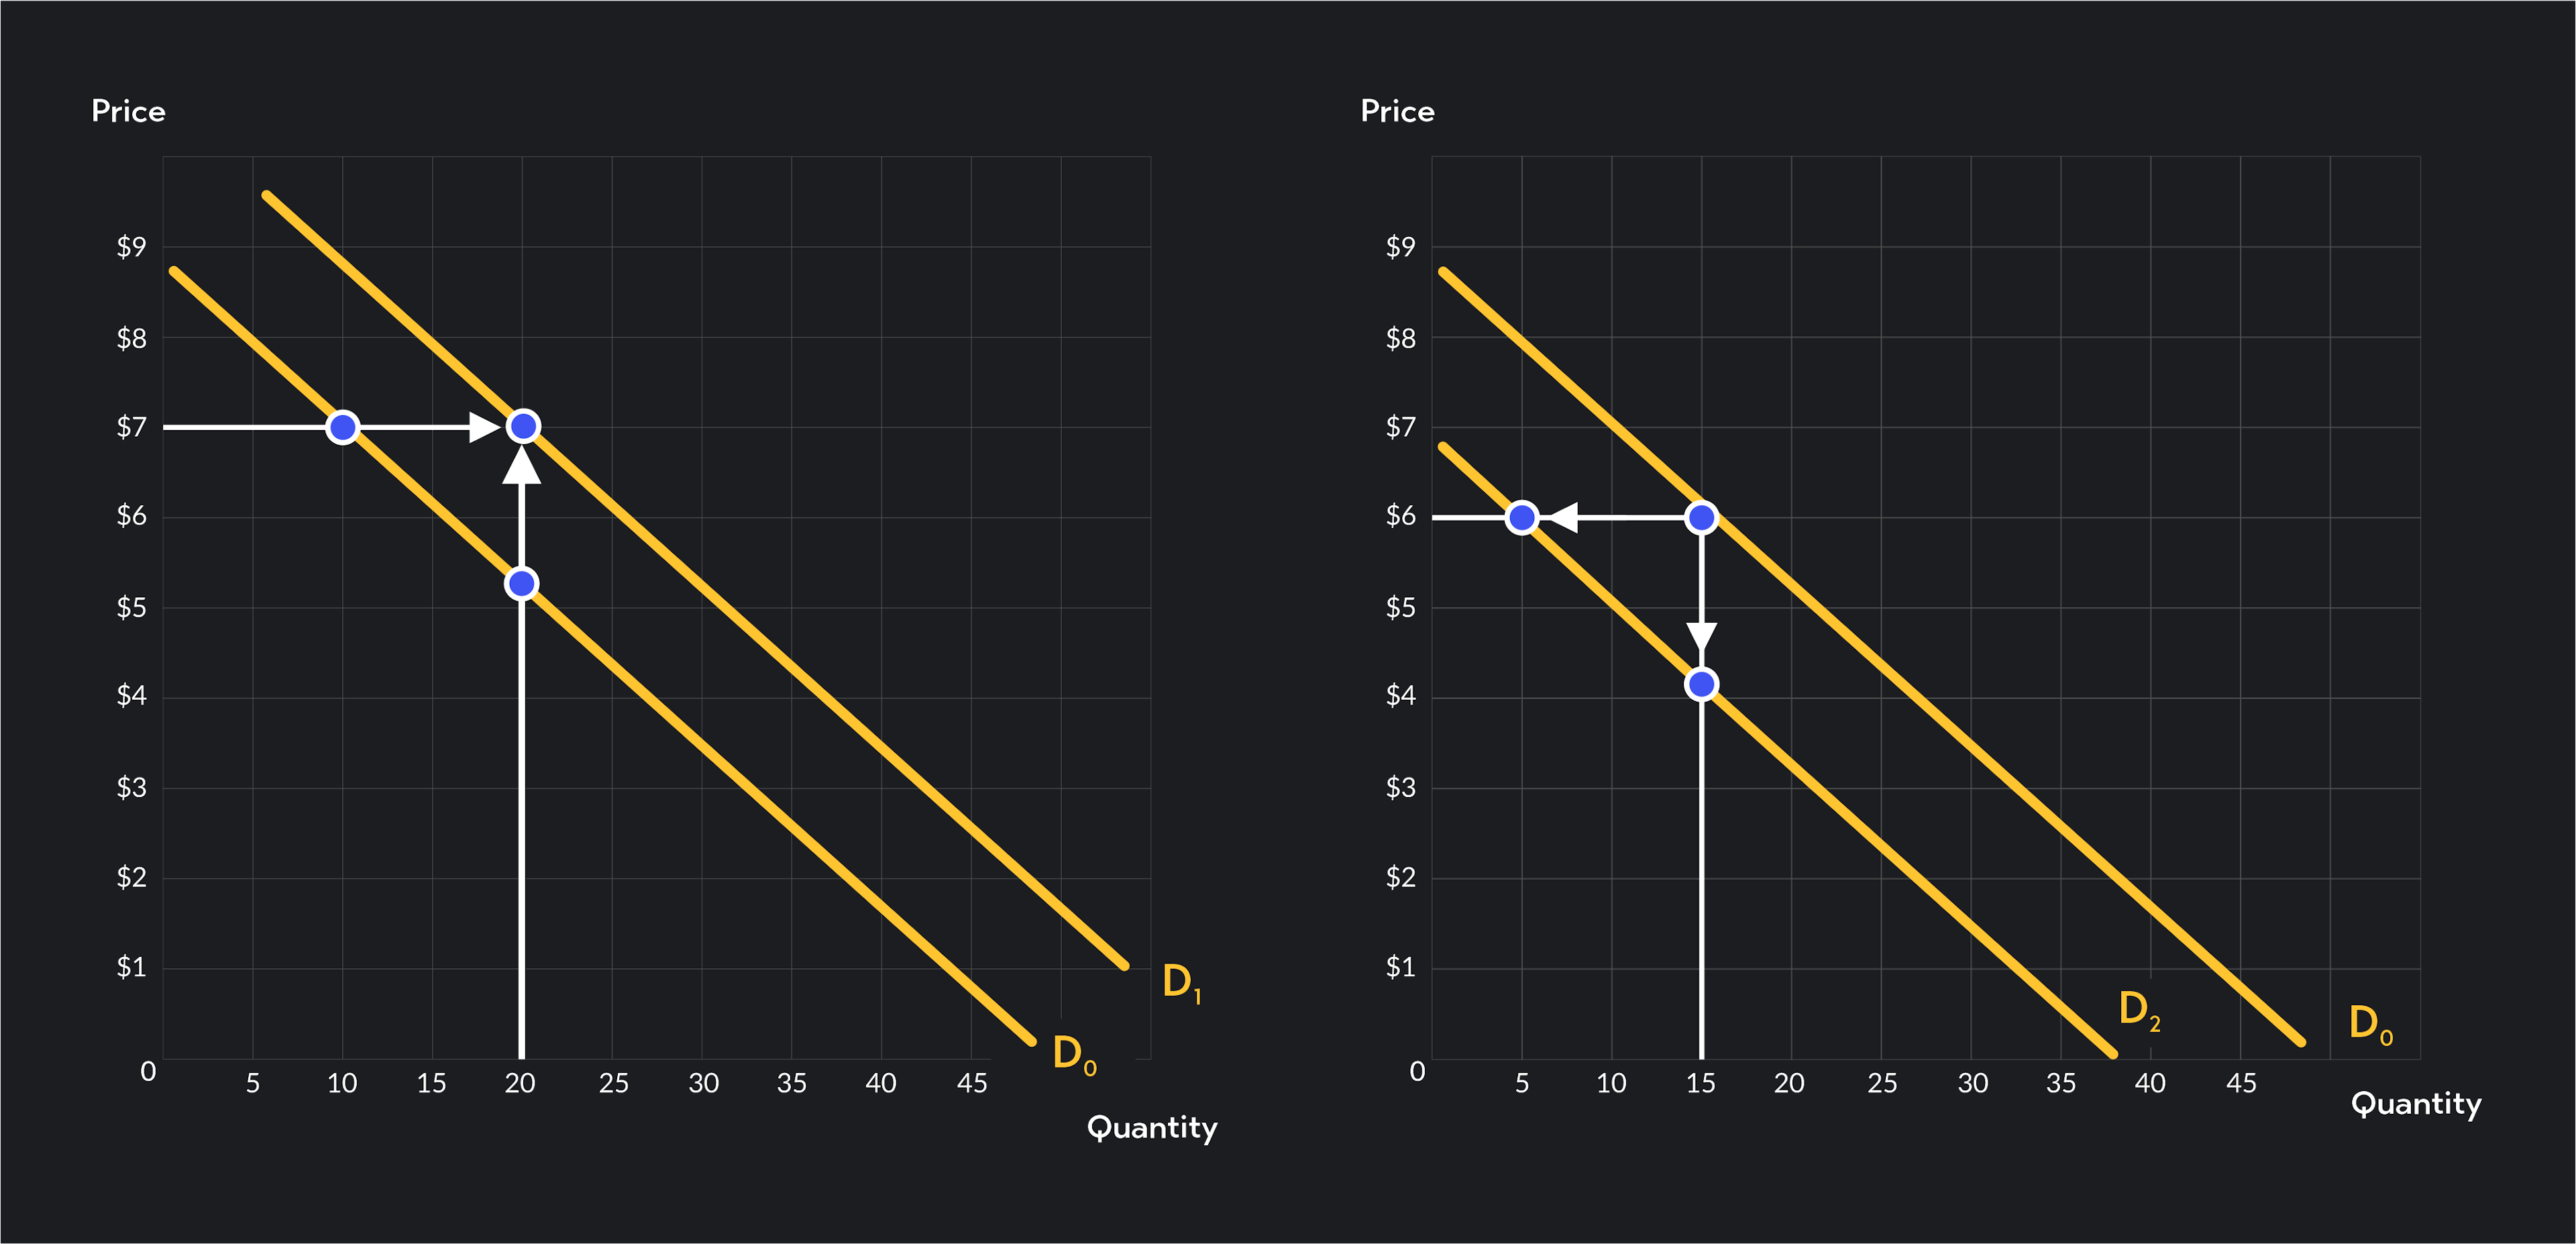
When demand increases, the demand curve shifts to the right. A rightward shift demonstrates that consumers are now willing to purchase a higher quantity at every price.
When demand decreases, the demand curve shifts to the left. A leftward shift demonstrates that consumers are now willing to purchase a lower quantity at every price.
ON LEFT- Demand increases, the curve shifts right.
ON RIGHT- Demand decreases, the curve shifts left.
Understanding demand is central to understanding economics. In this article, we looked at the relationship between price and quantity demanded and the five determinants of demand that can shift the entire demand curve. Now that you understand how the demand side of the economy works, you’re ready to explore the flip side of markets—supply!
Outlier (from the co-founder of MasterClass) has brought together some of the world's best instructors, game designers, and filmmakers to create the future of online college.